JAMES C. WEST, SEAN MEAKIM and ZACHARY SADOW, Barclays Capital
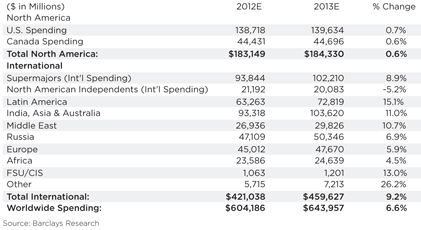
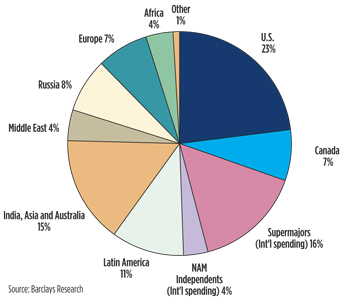
Global exploration and production spending is set to reach a record $644 billion in 2013, up 7% from $604 billion in 2012, according to Barclays’ Global 2013 E&P Spending Outlook. Spending growth in 2013 should be driven almost entirely by international markets, where estimated capital budgets will jump 9%, as the international and offshore cycles continue to build momentum, and commodity prices remain at attractive levels. In contrast to the international sector, E&P spending in North America (NAM) is forecast to pause, with flat, year-on-year spending in both the U.S. and Canada expected during 2013. By region, E&P spending is expected to rise most meaningfully in Latin America, Australasia and the Middle East. The forecast is based on responses from over 300 oil and gas operating companies, including integrated oil companies (IOCs, independents and national oil companies (NOCs).
E&P spending outside NAM is forecast to reach a record $460 billion (+ 9%) and drive global CAPEX growth in 2013. This compares to the estimated spending of $421 billion in 2012, which rose 11% from 2011 levels. Sustained high oil prices, the sanctioning of major projects, and the delivery of a large number of offshore rigs in both 2012 and 2013, are driving the spending increases. This growth is spread across the globe, as almost every country with hydrocarbons to exploit is experiencing an increase in activity. This is placing heavy demand on oil service, equipment and drilling companies. As a result, pricing for all products internationally has been, or is, in the process of increasing. Regionally, the most significant growth is expected to unfold in Latin America, Australasia and the Middle East.
After several years of high-speed growth in North America CAPEX, spending growth slowed during 2012, and 2013 budgets are expected to be roughly flat, with 2012 levels. NAM spending rose 27% in 2010, 31% in 2011, and 4% in 2012. Lower natural gas prices (which have rebounded somewhat), modestly reduced WTI oil prices, volatile differentials in Canada, lower NGL prices, logistical challenges in many newer oil plays, and a desire to spend within cash flow, are constraining NAM CAPEX. In the near term, U.S. spending fell sharply into year-end, and flat budgets in 2013 (compared to 2012) suggest that a trough is setting in. Growth should unfold in 2013, as NAM recovers to average 2012 levels.
Companies are basing their 2013 spending plans on oil prices averaging $98/bbl for Brent and $85/bbl for WTI (both of which may be conservative), as well as U.S. natural gas prices of $3.47/Mcf. These projections suggest our early look at 2013 spending levels may underestimate the total spending levels, when they reveal themselves late this year.
| Worldwide E&P Capital Spending By Company Type/Region, 2012-2013 |
|

|
LATIN AMERICA LEADS, ASIA CLOSE BEHIND
Once again, Latin American companies are expected to lead the way in 2013. We forecast capital spending in the region to increase 15% (compared to 17% growth in 2012), driven by a significant step-up in activity by state firm PEMEX in Mexico, an aggressive post-election capital program for state company PDVSA in Venezuela, and Petrobras’ continued capital deployment in Brazil, in support of its pre-salt development plan.
Spending in India, Asia and Australia is also projected to rise meaningfully in 2013 (up 11% vs. 2012), led by the Chinese NOCs, as they continue to pursue production growth, particularly offshore, and work on shale gas development onshore. Expenditures should be up for PetroChina (+11.5%), Sinopec (+14%), Inpex (+27%) and Petronas (+7.7%).
Higher activity in the Middle East (+11% in 2013) will include a pickup in activity in Abu Dhabi (ADNOC expected up 33%), as well as further growth for Saudi Aramco’s rig count, particularly shallow-water jackups. Iraq remains the largest E&P spending growth story this decade, in our opinion, driven largely by remediation work at brown fields by various IOCs and NOCs.
E&P expenditures in Africa are expected to increase 4.5% in 2013 to $25 billion from $23.5 billion in 2012. This follows a strong 2012 that saw investment and upstream spending bounce back in the aftermath of the Arab Spring and ensuing political instability in several countries.
Spending for select European E&P companies is expected to increase 6% in 2013, led by Statoil (expected to be up 6%), and BG Group (expected to gain 10%). We believe this is primarily going to be driven by increased exploration activity and enhanced recovery techniques in the Norwegian portion of the North Sea. Spending for select companies in Russia is expected to grow 7% in 2013, led by continued significant increases in E&P activity by Lukoil (expected up 31% to $12.9 billion).
 |
| 2013 Worldwide E&P capital spending by company type/region |
|
NORTH AMERICA TAKES A BREATHER
After several years of high speed growth in North American CAPEX, spending growth in 2012 slowed, and 2013 spending budgets are expected to be roughly flat with 2012 levels. NAM spending rose 27% in 2010, 31% in 2011, and 4% in 2012. Lower natural gas prices (which have recently rebounded somewhat), modestly reduced WTI oil prices, volatile differentials in Canadian basins, lower NGL prices, logistical challenges in many of the newer oil plays and a desire to spend within cash flow are constraining capital spending in NAM in our view.
We see many of these issues as transitory and believe that spending will trend higher throughout the year—an acceleration of growth in 2014 is likely. While greater efficiency is impacting the NAM rig count, we ultimately expect E&Ps to use efficiency savings to drill additional wells. The good news, near-term, for NAM is that U.S. spending is diving sharply into year-end, and "flattish" capital spending budgets in 2013, compared to 2012, suggest a trough is setting in. Accordingly, activity growth will unfold in 2013, and move back to spending levels that are flat with the prior year.
SUPER-MAJORS: STRONG INTERNATIONAL GROWTH EXPECTED
This year, the supermajors will continue to exhibit leadership internationally (+9%), while low gas prices at home have crimped cash flows for the NAM independents, leading to an expected pullback (-5%) in international CAPEX in 2013. More modest growth is expected in Europe (+6%), driven by increased exploration activity and enhanced recovery techniques in the Norwegian portion of the North Sea.
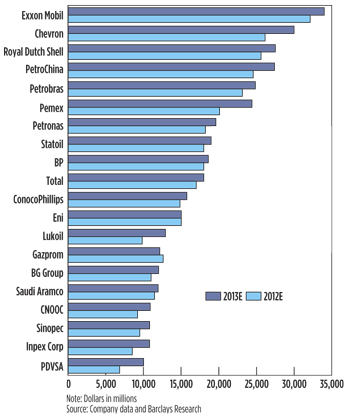
Capital deployment hampers NOCs. The top 20 E&P spenders globally account for about 57% of total spending (similar to 2012). With the exception of Gazprom (-4%) and Eni (flat), the top 20 are expected to increase CAPEX in 2013 (by an average 12%). Once again, Exxon should remain the world’s largest capital spender on oil and gas in 2013. Despite significant production growth expectations and considerable jumps in spending for several NOCs (e.g. PetroChina and Petrobras) in recent years, the top three spenders in our survey are all super-majors. Over time, we think the NOCs can close the gap with the super-majors, but capital deployment has been a challenge for some of late.
SPENDING INFLUENCES
We continue to believe that the industry is in the early stages of a multi-year, double-digit growth, spending up-cycle internationally, characterized by increased drilling in complex geologies on land, and exploration and development of traditional and emerging deepwater basins. Although North America has historically been a short-cycle market characterized by volatile swings in activity, the shift toward oil-directed and liquids-rich activity has significantly reduced the region’s cyclicality and will result in more consistent spending levels, in our view. Long-term and across cycles, we expect spending growth in North America to remain in the high single digits through at least 2016.
Frontier markets drive investment. We believe continued high spending levels for the super-majors is being driven by years of flat spending and under-investment in the early-to-mid-2000s, resource nationalization that has resulted in the expansion of deepwater drilling activity (particularly in Brazil and West Africa), and the need to find and replace large pockets of reserves and increase production. Active exploratory programs in emerging offshore markets in West Africa and East Africa, and the continued ramp-up in activity levels in frontier markets, including Iraq, Colombia, and Southeast Asia, are also contributing to the year-over-year growth.
Production declines should continue to drive exploration for new reserves, as well as spending on production enhancement of existing fields. We see Russian CAPEX rising 7% in 2013, led by continued significant increases in E&P activity by Lukoil (+31% to $12.9 billion). Gazprom Neft and Surgutneftegaz should also spend more in 2013, although this growth is offset somewhat by Rosneft, which we think will be down 11% in 2013, largely driven by an end of investment at Vankor oil field in eastern Siberia.
Fracing, EOR lead spending plans. For the fifth consecutive year, fracturing, stimulation and horizontal drilling were most commonly cited among operators as having the greatest impact on their spending plans. Placing third among influential factors was 3D/4D, which is not surprising, given the high focus on exploring new, unconventional plays. Directional drilling, MWD, reservoir recovery optimization, intelligent well completions, and drill bit technology were also frequently mentioned as important technologies used in the oil field.
Exploration budgets indicate long-term investment. The overwhelming majority of our surveyed companies (81%) indicated that exploration budgets would increase or remain stable next year. Given the sizable exploration spend in 2012, we view the forecasts for next year’s exploration budgets as further evidence of the long-term trend toward finding increasingly complex and expensive reserves. We expect exploration budgets to remain elevated for a number of years, as offshore operators move into deeper waters to search for oil and gas, and onshore companies increasingly shift toward unconventional plays.
 |
| Top 20 global exploration & production spenders |
|
COMMODITY PRICE CUSHIONS, CASH FLOW DRIVE BUDGETS
The increase in global capital expenditure budgets forecast for 2013, in tandem with higher oil prices, is consistent with historical trends. The correlation between E&P spending and inflation-adjusted oil prices is significant. We expect a high oil price environment to persist over the next several years, driven by accelerating decline curves; continued difficulty finding and developing large reserves; increased demand, especially in emerging markets; tight spare capacity; and the risk of a reduction in supply, due to potential geopolitical events. This sets the stage for further growth in spending during 2013 and beyond. We believe double-digit-spending growth on average is likely for the next several years.
Oil prices overshadow gas prices as budget determinants. Our most recent survey indicates that oil prices are now the overwhelming determinant of E&P spending, with over 70% of respondents claiming that the price of oil will be a key factor in 2013 budget plans. This marks the third year in a row in which companies indicated that oil prices weighed more heavily on spending decisions than gas prices which we attribute to the oil renaissance currently taking place in North America coupled with high volatility in gas prices.
Healthy cash flows support continued drilling. Cash flow has traditionally ranked high as a key determinant for E&P companies. We expect it will remain an important determinant of spending in 2013. We believe companies will continue to drill, as long as it is economic, and they have the cash flow to support drilling. The majority of companies we surveyed (74%) expect to spend within their cash flow during 2013, with 34% projecting expenditures to be equal to cash flow, and 40% expecting spending to be less than cash flow. This compares to 60% of companies who expected to spend within cash flow in 2012, including 21% anticipating that expenditures would equal cash flow and 39% that expected expenditures would be less than cash flow.
Low risk for NAM budgets. Operators in North America are basing 2013 capital budgets on an average oil price of $85/bbl for WTI and an average natural gas price of $3.47/Mcf at Henry Hub (or $2.95 AECO for Canadians, who use the Alberta benchmark). These budgeted levels compare to current prices of $89 for WTI, $3.44 at Henry Hub and $3.10 for AECO. Many companies have budgeted in a large cushion for commodity price drops in 2013. On average, North American E&Ps indicated they would not revise 2013 budgets lower unless WTI dropped to $67, a 25% discount from the current price. Similarly, our data suggest it would take a steep drop in natural gas prices to negatively impact 2013 spending plans.
Plenty of cushion in international budgets. Prior to 2011, our survey offered only one blended oil price forecast, given the historically small spread between WTI and Brent (~3% on average from 2000 to 2010). However, after the spread widened in 2010, we began asking the companies to specify which benchmark they are using in their budget assumptions. Those tracking Brent have offered forecasts in line with the tradition of underestimating the actual price; the average Brent price forecast for 2012, offered in last year’s survey, was $98, a 13% discount to the YTD Brent average of $112, and 14% lower than the full-year 2012 Barclays Research estimate of $113. Results for this year’s survey are likewise conservative, with respondents forecasting an average Brent price of $98, a 22% discount to the Barclays Research 2013 estimate of $125. 
EDITOR’S NOTE: It is not statistically accurate to compare total estimates with those from prior years, because the companies surveyed vary from year to year.
|


