JAMES M. PAPPAS, P.E., RPSEA
Two projects were performed by the University of Tulsa and its partners for the Research Partnership to Secure Energy for America (RPSEA) to relate hydrates to jumpers and develop dissociate strategies. The objectives of these projects, RPSEA Projects 07121-1603a and -1603b, were as follows:
After modifying a high-pressure flow loop, generate solid hydrate plugs under different scenarios, and evaluate the efficiencies of various hydrate dissociation strategies, including depressurization, wall heating and thermodynamic inhibitors.
Compare new databases for dissociation to existing models for wall heating.
Develop an estimation tool for designing appropriate dissociation methods for different operational conditions.
Perform transient flow experiments in subsea jumper geometries typical of low spots encountered in jumper systems.
Measure water displacement as a function of operating parameters, such as water cut, liquid loading, restart rates and oil viscosities.
Compare measured liquid carry-over from the low spot, and flow patterns during the restart process, to state-of-the-art transient simulation results.
Use the findings to either improve confidence in the performance of transient flow simulators, that are applied to jumper geometries or identify simulator shortcomings.
HYDRATE CHARACTERIZATION AND DISSOCIATION
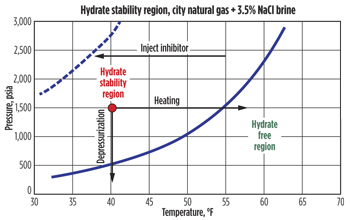 |
| Fig. 1. Hydrate equilibrium curve for Tulsa City gas experiment. |
|
Hydrates are ice-like crystals that tend to form when gas molecules are trapped in water under high-pressure and low-temperature conditions. In subsea jumpers, when shut-in, the line temperature quickly cools towards the ambient mudline temperature, to 40oF or below, at water depths greater than 3,500 ft, as pressure comes to equilibrium. As a result, the system is almost always in the hydrate formation region unless a line is sufficiently depressurized, as shown in Fig. 1. When thermodynamic hydrate inhibitors (e.g., glycol or methanol) are added to a system, they force the curves to move toward the left, thus reducing or eliminating hydrate formation. However, if complete mixing does not occur in the line, for example, in low spots where higher density fluids tend to settle, inhibition will not be complete.
To study the problem, hydrates were characterized by their physical properties and tied to various dissociation techniques, using interpretations of previous experimental data. The data suggested that for the same physical operating parameters:
- Formation time depends on parameters, including gas injection, sub-cooling temperature and fluid salinity.
- Larger sub-cooling temperatures formed hydrates faster than smaller ones.
- Higher gas injection rates created plugs faster than lower rates.
- Higher fluid salinity delayed hydrate formation.
- Hydrate plugs dissociated uniformly, when external heating was applied.
- Inhibitors dissociated hydrate plugs, solely at their point of direct contact.
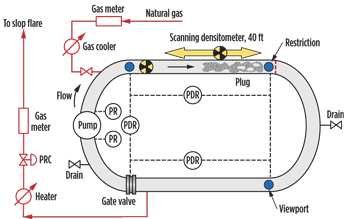 |
| Fig. 2. Hydrate equilibrium curve for Tulsa City gas experiment. |
|
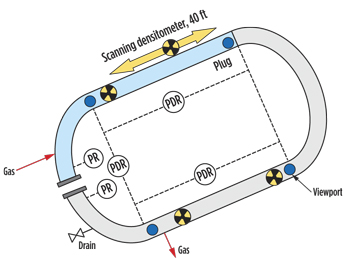 |
| Fig. 3. Loop configuration for plug generation in low spot. |
|
Using these observations as bases for hypotheses, the team produced hydrate plugs and characterized their physical properties (porosities, permeabilities and flow characteristics) for pumping tests and low spot tests. The pumping test samples used heating for dissociation. The low spot test samples were dissociated using monoethylene glycol (MEG), depressurization and heating. Tests were conducted in an instrumented flow loop at the University of Tulsa, Figs. 2 and 3. The experimental results were then compared to flow (software) model simulations that used the same parameters.
Hydrate plugs did not form, where the blocking plug was located. Therefore there were large uncertainties regarding hydrate permeabilities in the pumping tests, because of a lack of knowledge about plug lengths or precise locations in the loop. A second set of experiments was conducted for low spots, producing hydrate plugs of known length under a gamma scanning zone.
The following experimental conclusions regarding hydrate characterization and dissociation, were reached:
Lugs for the pumping experiments were formed after hydrate slurries stopped flowing, due primarily to friction, and were not formed by agglomeration. Furthermore, at low water cuts, no hydrate plugs were formed, presumably because there was no jamming of hydrates at the plate.
Porosity measurements using density scans were not feasible for the pumping tests, because liquids could not be drained from the hydrate slurries.
The water remained trapped in the hydrate phase in pumping tests, because no liquid could be recovered.
Pumping experiment permeability measurements were unreliable for several reasons—permeabilities along each plug varied; calculated permeabilities were average values; many tests formed plugs that had little to no pressure drop, and therefore did not bridge; some samples that bridged had gas channels with pressure drops too small to calculate reliable permeabilities; and plug lengths were difficult to estimate.
The CSM-plug model compared well with pumping test experimental data for two-sided depressurization.
The driving force for pumping dissociation tests resulted in hydrate plug collapses, when temperature was increased. This resulted in the end of useful test data collection.
Low spot hydrate plug permeabilities declined continually, as more water saturated gas flowed through them. It was suspected that the plugs would have eventually become impermeable to gas, had gas flow been continued over more time.
Plug formation for low spots was reproducible, in a consistent manner, using the experimental procedure.
Plug porosities were also reproducible in the spot tests.
Low spot plugs dissociated uniformly, as the models predicted, when external heat was applied.
Low spot depressurization tests resulted in non-uniform dissociation, or no dissociation at all. The variable results could have been due to plug collapse, water accumulation, ice formation, and/or other unknown reasons.
Using variable temperature and pressure inputs in the simulator models, for low spot tests, resulted in better correlations with test results, than using constant input data.
There was good correlation between low spot test results and the CSM-Plug two-sided depressurization model.
The TU model correlated better with the low spot test results. This model accounts for changes in temperature and pressure during the dissociation process.
These results were then incorporated into the second project, which sought to explore plugging risks in subsea jumpers.
FLOW IN JUMPERS
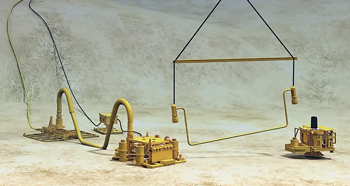 |
| Fig. 4. Vertical jumper installation tie-in. Illustration courtesy of FMC Technologies. |
|
A jumper is a section of pipeline close to the wellhead, which commonly connects the well to the subsea manifold, Fig. 4. It is rarely insulated and contains low spots, where water can accumulate, most often during shutdown. The highest risk of hydrate plugging in jumpers occurs during restart, when fluids are cold, inhibitors may have settled and segregated from produced fluids, and pressures required to commence flow are greatest.
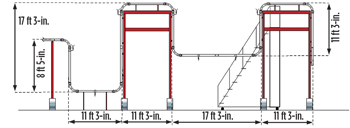
One objective of this investigation was to design and construct a jumper-like facility that operates at atmospheric conditions, so that experiments with oil, gas and water can evaluate different operating parameters. Thus, one gains a better understanding of water displacement during subsea restart to predict conditions that induce hydrate formation. Even though flow loop testing is an adequate alternative to compare and predict field data, it is not feasible to cover every field scenario, especially those with varying geometries. Software packages have been developed to operate in very specific conditions. Project results were compared to the transient simulator OLGA.
 |
| Fig. 5. Test Section Layout. |
|
 |
| Fig. 6. Test section instrumentation. |
|
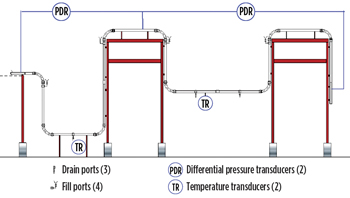
The experimental apparatus was built at the University of Tulsa, see Fig. 5. It was comprised of approximately 100 ft of 3-in. acrylic pipe with two differential transducers, one pressure transducer, and two temperature transducers, see Fig. 6. The electric motor-driven gas restart system was capable of generating velocities of up to 30 ft per second in the line. A Coriolis flow meter measured air (gas) rates, and valves were used for flow control. The pump-driven liquid restart system could generate velocities of up to 6 ft/sec. It included a 300-gal storage system, a positive displacement meter and various control valves. Ports were built into the low spots, so desired fluids could be manually filled. A high-resolution video camera was used to record experiments.
For the gas and liquid restart experiments the system was charged, using measured quantities of the desired fluids. Then low spots were carefully filled with various percentages of fluids to conduct the experiments. Air was used for gas, tap water represented the water phase; and Citgo 19 and Lube 220 model oils, with viscosities of 19 and 20 Centipoise (cP), respectively, represented crude oil. The experiments were run at ambient conditions, and video was taken during the tests. Nearly 100 restart experiments were run.
EXPERIMENTAL CONCLUSIONS—FLOW PHENOMENA IN JUMPERS:
A few conclusions were reached after conducting several categories of experiments. Findings are listed by category.
Single-phase gas restart experiments. Liquid holdup was affected mainly by velocity; for the same fluid at the same velocity, the final liquid holdup was the same, regardless of the initial content, unless the initial content was below the minimum value, below which no liquid is displaced. Because results are affected by velocity, similar results were obtained, whether the low spots were considered individually or together.
The fluid density and viscosity played important roles in liquid carry over. Viscosity offered resistance to flow, and density made it more difficult to flow liquids up the riser sections. Depending on restart velocity and initial liquid loading, different flow behaviors were observed. Lower velocities at lower liquid loadings are considered less risky in terms of hydrate formation because they are of little disturbance to the water phase. If higher liquid loadings and higher flowrates are used, churn flow will result in more mixing, which can be a very risky condition.
Two phase gas restart experiments. The final liquid holdup was affected, not only by the velocity, but also by the water cut. The actual behavior depends on the oil phase properties. Similar to single-phase experiments, density and viscosity played a more complex role. Higher density and viscosity made it easier for the oil to induce momentum on the water phase. However, they also offered more resistance to flow of displacement.
Some conditions promoted oil/water separation. This was observed while running experiments at low-to-medium velocities with the 19 cP oil and at high velocities, with the 220 cP oil.
Liquid restart experiments.
Even a jumper full of water flushed with one jumper volume, using the lowest velocity tested (0.48 ft/s) removed at least 70% of the water from the jumper. Higher liquid restart rates were more effective at forcing all of the water out of the jumper, but lower restart rates promoted more mixing.
If pushing all the water out of the jumper is needed, it is best to use higher flowrates. If the goal is to mix the water with hydrate inhibitor, the recommended practice is to flow at lower flowrates (less than 0.5 ft/s), because more mixing was observed. More displacement can be obtained by displacing additional jumper volumes. However, each additional jumper volume resulted in only an additional 5% removal of water.
General findings. The 19 cP oil took longer to separate than the 220 cP oil. Some 19 cP oil remained as an emulsion (less than 5% of initial content). The most critical section in a jumper was the lower riser elbow because all of the mixing occurred, and most of the water accumulated there during the tests.
OLGA simulations over-predicted carry over; more liquid was left behind in the experiments than predicted. Explanations to this phenomenon include: 1) a possible wall wettability effect, 2) the length of the pipe may be too small; and/or 3) the use of pressures below 100 psia may have had an effect.
The full reports can be found online on the RPSEA website:
Hydrate characterization & dissociation strategies— http://www.rpsea.org/attachments/contentmanagers
/2730/07121-1603b-FR-Hydrate_Plug_Characterization_Dissociation_Strategies-04-18-11_P.pdf and
Flow phenomena in jumpers-relation to hydrate
plugging risk— http://www.rpsea.org/attachments/contentmanagers/3531/07121-1603a_Final_Report_P.pdf 
ACKNOWLEDGEMENT
The author thanks the University of Tulsa and researchers Michael Volk, Emmanuel Delle-Case and Angelina Coletta, as well as TUHFP (University of Tulsa Hydrates Flow Performance Project), BP Americas, Chevron and SPT Group (now part of Schlumberger). RPSEA is a 501(c)(3) organization that is entrusted with managing R & D projects for the U.S. Department of Energy’s National Energy Technology Laboratory.
|
The author
JAMES PAPPAS is Vice President of Ultra-Deepwater Programs for RPSEA, the Research Partnership to Secure Energy for America, in Sugar Land, Texas. James has authored over 80 papers and spoken at many conferences. He has also held various positions at Fina, UPRC, Amoco, and Devon Energy. He has been an SPE member for 34 years. |
|


