CLARA ANDREOLETTI, JACOPO PANIZZARDI, NICOLA BIENATI, Eni E&P
 |
| In challenging plays, advanced interpretation must rely on the most accurate and reliable seismic volumes. This support can be assured only by a proper integration of imaging technologies, computing technologies, and hard and soft data. |
|
Exploration for hydrocarbons is moving toward increasingly challenging areas (e.g., ultra-deep water in subsalt environment), where current seismic imaging methods are reaching their limits. In complex geology, the conventional seismic imaging approaches may fail and result in non-negligible mistakes in the interpretation and construction of the geological model. Wrong depths, wrong structures, wrong salt geometries and “ghost” reflectors are some of the most common a posteriori explanations for the failure of an explorative well where, besides the costs, HS&E issues are at stake. A potential solution is e-DVA (Depth Velocity Analysis), a proprietary tool developed by Eni. This tool exploits the huge amount of computing power available through relatively inexpensive hardware, such as Linux clusters.
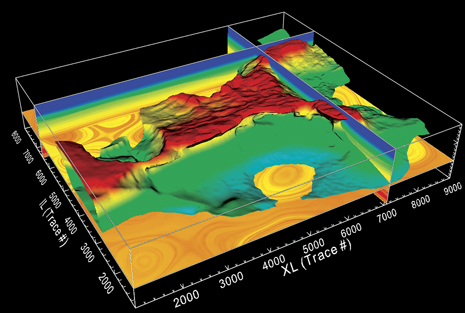
VELOCITY ANALYSIS BACKGROUND
In reflection seismology, information about the shape of the geological structures is encoded, mainly in the traveltime of seismic wave reflections recorded in the data. Seismic migration provides a means to decode such information into an image of the structures. Since traveltime is converted into distance by using velocity, it is obvious that knowledge of seismic rock velocities is a key ingredient for seismic imaging. We can think of migration as the analog of an adaptive system of lenses that, once an estimate of the sound velocity in the subsurface is provided, focuses seismic data into an image of the subsurface. Figure 1 provides a comparison between images obtained without, and with, a correct estimate of velocity.
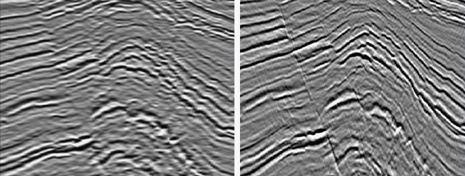 |
| Fig. 1. An unfocused and distorted image (left) is the consequence of incorrect estimation of velocity variabilities. |
|
Velocity analysis combines the mathematical laws that describe seismic wave propagation and the sensitivity of imaging to velocity. The continuous interplay between migration and velocity analysis, where one feeds the other, is so fundamental that the entire procedure that leads to the subsurface image (and the subsurface velocity model) is designated by the name Migration Velocity Analysis (MVA). The practical consequence is that software for seismic migration and velocity analysis must be strictly integrated. This integration is one of the topics discussed here.
Another very important aspect is that seismic datasets do not usually contain all the information needed to unambiguously estimate velocity.1 A qualitative explanation for this lack of information is that during seismic acquisition, both sources and detectors lie on the Earth’s surface, at reciprocal distances smaller, or at most, comparable to the depth of the targets. This geometry biases the acquisition to record waves that have travelled mainly along, or very close to, the vertical direction. Consequently, seismic data contain enough information to determine how velocity changes laterally, but far less information about vertical variations. Moreover, to complicate the picture even more, and introduce further ambiguity in the problem, there is the anisotropic behavior of seismic velocity as discussed below. To remove such ambiguities, it is necessary to inject additional information in the process.
There are essentially two sources of additional information: 1) hard data provided by wells; and 2) structural information that can be obtained directly from the images. This article discusses how structural information is integrated into the e-DVA process.
MIGRATION VELOCITY ANALYSIS
The MVA goal is to construct a subsurface velocity model that explains the picked traveltimes of the recorded data. This means that reflection traveltimes simulated in the model via ray tracing must match observed traveltimes. Accordingly, we can derive the velocity model by solving a non-linear optimization problem that updates velocity according to traveltime misfit until the misfit itself is minimized.
In practice, picking traveltime from pre-stack seismic data is not straightforward; therefore, it is common to adopt an alternative, but equivalent and more practical, criterion. After splitting input data into subsets according to source-receiver distance (offset), we migrate the subsets separately, and then any mismatch among the subset migrated images (also called residual moveout) implies velocity needs to be updated. Again, the velocity is obtained by solving an optimization problem, where now the cost function is the mismatch of the images. For both approaches, the optimization has a very peculiar mathematical formulation called tomography.
The high volume of current seismic surveys implies that the size of the corresponding tomographic problem is also huge. Moreover, due to the iterative nature of the problem, it is crucial to be able to solve this optimization as fast as possible. Each iteration requires us to invert matrices, whose size can be on the order of hundreds to thousands of gigabytes. In the e-DVA process, we addressed such requirements by implementing a parallel, scalable optimization software that can leverage the computational power provided by Linux clusters. The scalability of the software is a key aspect to cope with the ever-increasing size of the processing problem, while providing solutions in reasonable time (without compromising resolution) by simply increasing the number of cluster nodes used in the computation.
Besides optimization, another MVA task that leverages computing power is the estimation of the mismatch among migrated images. This task is equivalent to, but less complex than, picking traveltimes. Nonetheless, it is a time-consuming phase, due to the size of the projects. The e-DVA process employs a parallel, semiautomatic (it requires some guidance from the user) tool to pick residual moveout that allows very dense, reliable picking of an image mismatch. The density of the information extracted is crucial for the quality of the final result.
The estimation of seismic velocity does not have a unique solution. The reason is that in seismic tomography, there are usually more degrees of freedom than constraints, or, stated otherwise, many different velocity models match the data equally well. Standard optimization theory provides simple means to compensate for this lack of constraints. One possibility is to force the solution of the optimization (that is the update of the current velocity model) to both explain the traveltimes and be spatially smooth. The latter is a generic assumption that does not necessarily fit the characteristics of the velocity we are seeking with seismic tomography (for instance, it is unlikely that velocity can change smoothly at the interface between two different formations). To drive velocity estimation toward realistic models, e-DVA employs more specific constraints that take into account the specific nature of the problem. While the first constraint forces velocity to be consistent with hard data provided by wells, the second constraint forces the spatial structure of the velocity to conform to the geological structure.
INTEGRATION OF HARD DATA
During and after drilling a well, a series of information is acquired (e.g., well logs and core measurements). Among these measurements, the most interesting one for velocity analysis is the direct measurement of rock velocities along the well trajectory. This is valuable information that can be used in the velocity model building procedure. The most straightforward way to exploit this type of information would be to force velocity in the model to match a posteriori (after optimization) the well velocity along the well trajectory. This simple solution has two drawbacks. First, in the presence of anisotropy, well velocity measures velocity only along the direction of the well trajectory (the relationship between anisotropy and direction is explained below). Second, by changing velocity only along the well, we introduce unphysical discontinuities in the model. Since velocity is estimated by optimization, we addressed both issues by exploiting well velocities as additional constraints in the optimization. This choice automatically ensures that the information from the well is spread in the neighborhood of the well trajectory, but does not address the issue of anisotropy.
To handle anisotropy, we decided not to use the velocity read from the well directly as the constraint, but instead we chose to use only the velocity trend. One important detail to be taken into account is the different resolution scale provided by well logs (a few meters or less) with respect to that retrieved by tomography (typically one to a few hundred meters). Since we noticed that this difference may have a negative impact on results, we decided to smooth the well logs before computing the velocity trend to be used as an additional constraint for tomography. Figure 2 shows a comparison between the velocity measured at the well and the seismic velocity estimated by e-DVA, with the well velocity used as an optimization constraint. Here the additional well constraint helped tomography to converge to the correct model, in particular it allowed retrieval of the velocity inversion that occurs at 3,000 m.
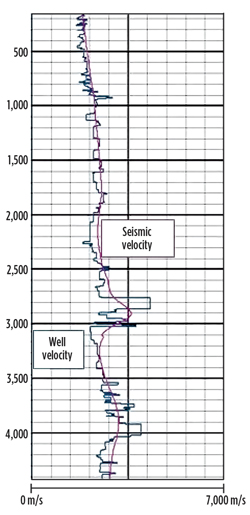 |
| Fig. 2. Integration of hard data. Note how the estimated seismic velocity follows the inversion in the well velocity around 3,000 m. |
|
Another useful source of information becomes available after the geologists’ interpretation of the available well logs of different nature (e.g., gamma ray and density), which provides the exact depth of the main formations at the intersection with the well trajectories. This depth information, called well markers, can be used to validate the imaging, but it can also support the determination of velocity, making it consistent with the measurements, especially in presence of anisotropy. When anisotropy is neglected, we typically obtain a good travel-time match. However, the imaged structures are at the wrong depth. Well markers provide control points to tune anisotropy estimation by restoring the correct ties, although the sparseness of available points makes it difficult to guarantee the correct depth positioning throughout the entire volume.
INTEGRATING STRUCTURAL INFORMATION
Well constraints are usually available at a limited number of locations, while the purpose of MVA is to create a velocity volume extending over the entire survey area. It is reasonable to assume that seismic velocity is a specific, consistent property of rock formations. Therefore, spatial velocity trends should conform to geological structures. Starting from these observations, we devised a way in the e-DVA process to introduce an additional constraint that shapes velocity according to structures. Unlike some other MVA approaches, this is not derived by forcing layered or blocky structures in the model, but it is introduced as a soft constraint, allowing tomography to adapt to it in a flexible way. Moreover, with this approach, horizon interpretation is not required as we extract structural information automatically from migration output by applying image processing techniques.
Figure 3a shows an example of a migration velocity volume, which follows the geological structures of the subsurface. Here, the use of structural information derived from the migrated image allowed tomography to identify the velocity inversion due to shale, without introducing interpreted horizons explicitly.
The use of structural constraints must be conditioned to geological validation. While this type of constraint is devised from sound physical assumptions, there are cases where velocity variations are decoupled from structures. In particular, this occurred in the presence of overpressures that introduce anomalies in the compaction trend, and consequently, in velocity. Figure 3b is an example of the challenges of detection and estimation of low-velocity anomalies, due to the presence of gas.2 The use of structural constraint here was totally detrimental. On the other hand, velocity anomalies retrieved by tomography were accepted only after careful geological scrutiny.
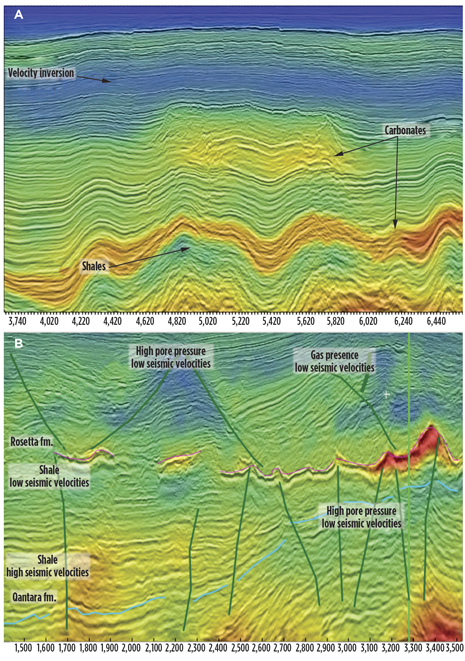 |
| Fig.3. There are some geological settings, where velocity nicely conforms to structure (top), but others where the presence of overpressured zones invalidates such an assumption (bottom). |
|
ACCOUNTING FOR ANISOTROPY
Seismic velocity may change, particularly in shales, according to the propagation direction of seismic waves, as confirmed by measurement on core samples and by comparing well logs from vertical and deviated wells traversing the same formation.3 This phenomenon is characterized as anisotropic behavior, which impacts both migration and velocity analysis. Migration must focus seismic data taking anisotropy into account, and velocity analysis must provide an estimate of the anisotropy strength. These requirements imply the introduction of additional degrees of freedom in the description of velocity. Nonetheless, the new degrees of freedom worsen the underdetermined nature of the velocity estimation problem, making the use of hard and soft constraints strictly mandatory.
Figure 4 highlights the effects of the introduction of anisotropy. The image comes from an offshore West Africa imaging project, where the goal was to carry out an accurate velocity study to 1) perform a pore-pressure prediction study; and 2) obtain the best seismic image in depth domain to evaluate the hydrocarbon potential of the area. After the first two iterations of isotropic tomography, reasonable traveltime match was obtained, but the velocity was still much higher with respect to the trend observed along the only well available in the area. Moreover, there were significant mis-ties at the main available markers, coupled with evidence of anisotropy coming from the behavior of traveltime mismatch at long offsets.
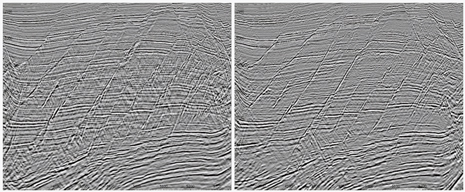 |
| Fig. 4. Depth imaging without anisotropy (left) and with anisotropy (right); notice the remarkable uplift of fault imaging achieved by accounting for anisotropy. |
|
Since one of the goals was pore-pressure prediction, which requires seismic velocity as an input, the velocity mismatch at the well put the velocity model accuracy in question. On the other hand, neglecting anisotropy can lead to an overestimation of velocity. By considering the match between the estimated velocity and sonic log jointly with traveltime match, imaging quality and fault focusing, e-DVA allowed us to finalize a three-layer anisotropic model. This new anisotropic model honored all the information coming from the well (sonic log and markers) and also produced the best imaging, as shown in Fig. 4, that provides an example of the improvement gained in terms of focusing and lateral positioning of faults.
SALT INTERPRETATION
Tomography is based on matching traveltimes, directly or indirectly, through migrated image mismatches. Attributes of ray traveltimes are computed through ray tracing, which is an approximated mathematical model describing seismic wave propagation. Ray theory was developed with the assumption that frequency is extremely high or, more correctly, that the wavelength is much smaller than the size of the objects encountered along the ray path. Accordingly, rays are the right model to describe light propagation (light consists of EM waves at frequencies in the range of hundreds of Tera Hertz and wavelengths in the order of hundreds of nanometers). With seismic waves, such an assumption is weaker. In particular, it breaks down at salt-sediment interfaces. The result is that imaging algorithms based on ray tracing (i.e., Kirchhoff migration) often fails in the presence of salt, and especially, when imaging below salt. This is true not only for imaging, but also for MVA, and explains why salt model building is a challenge.
Fortunately, on the imaging side, there are remedies. In particular, there are imaging algorithms based on more accurate models of seismic wave propagation that can handle salt. An example is Reverse Time Migration (RTM), which is currently the tool of choice for subsalt imaging. However, RTM-improved output quality comes at the price of an increased computational cost. Indeed, RTM known for being much more expansive than Kirchhoff migration. With RTM, parallel and scalable software implementation is compulsory.
In the presence of salt, the challenge for MVA is not the determination of the velocity inside the salt (which is relatively uniform, apart from possible salt inclusions), but the delineation of the shape of the salt bodies. MVA approaches, based on rays, are hopeless for this task. More advanced approaches, based on the same RTM mathematical models, such as Full Waveform Inversion (FWI), have not been able to solve the problem because of some practical limitations (the only noticeable exception is offshore bottom-cable data with very low minimum recorded frequency). At the moment, it is difficult to foresee when, and if ever, such limitations will be overcome. The only feasible solution, therefore, is interpretative. Since RTM can provide good salt and subsalt imaging when the velocity model is correct, the solution is to revise, iteratively, the shape of the salts according to a geologist’s interpretation and reapply RTM. Depending upon the results, a decision can be made whether to proceed with further iterations or to stop.
In the e-DVA process, the need for applying RTM inside the MVA loop was addressed by developing a proprietary implementation of RTM integrated into e-DVA itself. The integration is developed at two levels: 1) MVA workflow; and 2) software, because the RTM implementation shares the same parallel infrastructure of e-DVA based on Linux clusters. Figure 5 shows an example taken from a West Africa offshore 3D project, where a significant improvement of the salt model was obtained by using RTM.4 Here, the original salt model was interpreted, using the migrated volume produced by Wave Equation migration. Despite the apparent good quality of imaging, interpreters were not confident in the delineation of channel systems below various salt drops present in the area. The initial salt model was, therefore, placed under scrutiny, and it was decided to check it by using RTM. The original schedule of the project did not include RTM. To stay on schedule, we ran RTM at 20Hz. This resolution was sufficient to allow revision of the salt model. After several iterations, the new salt model was finalized. The new model was characterized by a generalized reduction of the thickness of the salt bodies, resulting in a significant improvement of the channel system image.
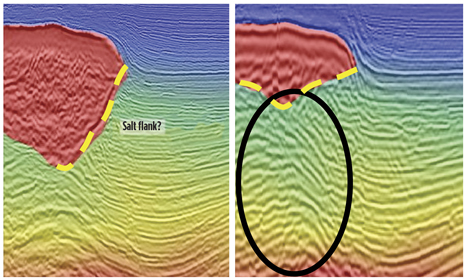 |
| Fig. 5. Initial salt interpretation obtained by using Wave Equation Migration (left) vs. new interpretation after RTM (right). |
|
CONCLUSIONS
Hydrocarbon exploration is moving toward environments, where geological complexity is pushing seismic imaging to its limits. Several key factors will enable seismic imaging to overcome these challenges. Among the most important factors is the use of state-of-the-art geophysical technology, that to meet delivery schedules, must be coupled to parallel, scalable software implementation of geophysical algorithms. Other factors relate less to technology. The first of these factors is the integration and exploitation of all the available data and information, as we did in e-DVA by introducing hard and soft constraints. Then there is the integration of knowledge from different fields—geophysics, geology and, possibly, rock physics. Finally, the human factor is unavoidable, due to the large number of choices and decisions to be taken during the process because of the intrinsic underdetermined nature of seismic imaging. 
ACKNOWLEDGEMENTS
The authors thank Eni E&P for permission to publish this work, and Erika Gentile, Ruggero Bacenetti, Marco Andreolli and Tania Ciaccio, for providing some of the results shown in this article.
REFERENCES
1. Tieman, H. J., “Investigating the velocity-depth ambiguity of reflection traveltimes,” Geophysics 59, pp.1763-1773, 1994.
2. Andreoletti, C; N. Bienati, G. Capponi and N. Bellucci, “Integrated approach to imaging and pore pressure prediction in the Nile Delta,” Extended Abstract, IPTC, 2009.
3. Brevik, I.; G. R. Ahmadi, T. Hatteland and M. A. Rojas, “Documentation and quantification of velocity anisotropy in shales using wireline log measurements,” Leading Edge, p. 272, March 2007.
4. Andreoletti, C.; N. Bienati, R. Brajucha and F. Doniselli, “Migration velocity analysis aided by RTM,” Extended Abstract, 72nd EAGE Conference & Exhibition, 2010.
The authors
|
 |
CLARA ANDREOLETTI is the geophysical acquisition and processing manager at Eni in Milan, Italy. After joining Eni in 2002, Ms. Andreoletti worked as seismic data processing manager and then as exploration manager for Eni Ghana E&P. She received her MSc degree in telecommunications engineering from Politecnico di Milano, Italy. |
|
 |
JACOPO PANIZZARDI works as a R&D geophysicist on seismic imaging at Eni’s geophysical acquisition and processing department. Since joining Eni in 2008, Mr. Panizzardi has been working on seismic velocity analysis and imaging technologies. He holds BSc and MSc degrees in telecommunications engineering from Politecnico di Milano. |
|
 |
NICOLA BIENATI is a research geophysicist for seismic data processing and seismic imaging in Eni’s geophysical acquisition and processing department. After joining Eni in 2002, Dr. Bienati worked as a post-doctoral researcher in the electronic engineering department of Politecnico di Milano. He holds MSc and PhD degrees in telecommunications engineering from Politecnico di Milano. |
|


