ALI DANESHY, Daneshy Consultants International
In-spite of our best efforts, hydraulic fracturing sometimes creates results that are different than our expectations. To analyze the cause of these variations and take corrective steps the industry uses various diagnostic tools that are intended to give us a picture of some aspect of the created fracture. The diagnostic tools used for hydraulic fracturing can be divided into three groups, based on the time of their application.
Before fracturing systems. The key questions before drilling or fracturing a horizontal well in a new field are fracture orientation and its vertical extension and the expected pressure while fracturing. The information is used for selecting well orientation, its vertical location within the pay zone, and for determination of the required casing strength and design of the completion system. The systems presented below can answer one or more of these questions.
Wellbore breakouts. Occasionally the magnitudes of the in-situ principal stresses are large enough to cause partial failure of the borehole wall. This causes directional enlargement of the borehole, which can then be detected by a variety of logging tools. One such example is shown here in Fig. 1, which shows an actual photograph of a borehole breakout in a shale formation. Breakouts are the result of formation compressive failure and their orientation will be perpendicular to the fracture orientation created in the same formation and depth. Breakouts do not provide information regarding vertical fracture growth or pressure required for fracturing.
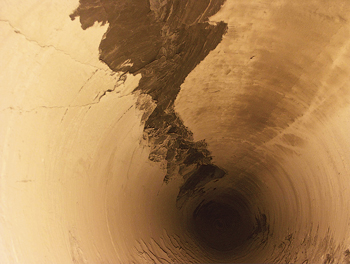 |
| Fig. 1. Wellbore breakouts |
|
Wellbore breakouts are caused by formation failure, not elastic deformation. Although elastic deformation of the wellbore will deform the circular well into an ellipse, the magnitude of this deformation is much smaller than what is caused by formation failure. Furthermore, elastic deformation of the borehole occurs very rapidly and while drilling, which then allows the drill bit to cut and remove the narrowed parts of the ellipse. This reduces the difference between the two axes of the ellipse and brings it closer to being a circle.
Another cause of non-circular borehole shape is bit vibration while drilling. In this case, the bit movement along the borehole depth is similar to that of a screw. Breakouts caused by formation failure will have a consistent orientation with depth.
World stress map. Over the years scientists have made large number of stress measurements for various engineering applications. Regional plots of these data are available on the internet and can be found using any of the popular search engines. Such data is useful as an initial indicator of fracture orientation. However, it should be noted that these maps sometimes represent measurements taken in formations and depths that may not correspond to the conditions of the reservoir.
Mini-fracturing of the vertical pilot hole within the pay zone. In this system, a vertical pilot hole precedes drilling of the eventual horizontal well. The vertical well is drilled and cased to the top of the pay zone. Drilling then continues into the pay zone, but, if possible, not through it. If one wishes to collect formation and reservoir data from the pay zone, this segment can be cored for later testing. The open hole section can now be fractured using drilling mud and at very low rates (as low as only several gallons per minute) while fluid pressure is measured at the surface. After fracturing is completed, one can determine fracture orientation using several methods, including impression packers or any of the borehole imaging logs. One alternative is to cut an oriented core through bottom of the borehole. The retrieved core is likely to show the downward extension of the fracture through the remainder of the pay zone, and maybe also within the underlying formation. This step will provide additional information regarding fracture orientation, and, its propensity to grow into the underlying formation. Use of this system can therefore answer all the three key questions asked earlier. Fig 2. shows a picture of an oriented core with the hydraulic fracture recovered after one such test.
 |
| Fig. 2. Recovered oriented core split by an induced hydraulic fracture |
|
As far as the details of fracturing, one can perform any of the standard fracturing tests currently being used by the industry.
Due to uncertainty regarding the exact depth of the pay zone, an alternative to this test would be to drill into the pay zone (but, if possible, not through it). The pay zone can be isolated using the drill pipe and an open hole packer that is set just above the pay zone. Fracturing is done by pumping through the drill pipe, while also recording the pressure at the annulus which is shut-in at the surface. The advantage of this system is that it also helps determine upward fracture growth. The main concern would be the ability to isolate the borehole with openhole packers.
The open hole can also be used for many other tests, such as a pressure build-up, or collecting samples of the formation fluids. This testing can be done before and/or after fracturing. Once this testing is completed, the drilling of the horizontal well can proceed by setting a whipstock at the desired depth and side-tracking the horizontal well.
Recovered cores can also be used for measurement of the physical (permeability, porosity, etc.) and mechanical properties (elastic constants, compressive and tensile strengths, etc.) of the cored formation. Such data is very useful during the development phase of the field.
More information on this system can be found in reference 1.
Real-time Systems. These tests are conducted while the well is being fractured. The two commercial options are microseismic and tiltmeter mapping. In microseismic mapping, a string of downhole sensors is anchored in an adjacent well and are used to record the very low intensity microseisms created by the extending hydraulic fracture. As the fracture propagates within the formation, these sensors record the arrivals of compressional and shear waves generated by the propagating fracture, Fig. 3. Knowing the wave velocity in the formation (which is determined from log data), one can locate the source of the seismic activity through the difference in the arrival time of compressional and shear waves. Other parameters used for increasing data certainty are signal polarity and its consistency within the multiple sensors. Microseismic data has proven very useful for determination of fracture orientation in horizontal wells. Although, theoretically, it can also provide information related to fracture lateral and vertical extents, in practice the large scatter in the recorded signals cast a doubt on the accuracy of such determinations. Microseismic survey service providers have different methods of enhancing the reliability of the data, such as monitoring from multiple wells.
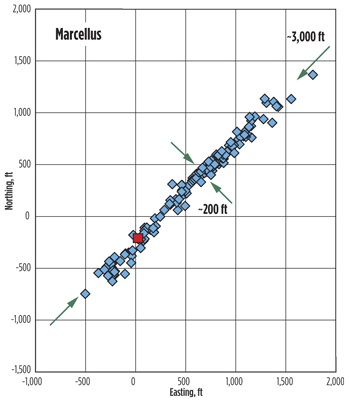 |
| Fig. 3. Microseismic fracture map, courtesy of Pinnacle |
|
Tiltmeter measurements record the ground tilt associated with the opening of the hydraulic fracture. The information collected using this system is very similar to microseismic method and is subject to the same uncertainties.
Fracturing pressure data. Another tool for real-time fracture analysis is the use of surface or bottom-hole pressure data. In some fracturing systems reliable bottom-hole data can be measured directly by recording the surface pressure of a dead string (either tubing or annulus while injecting through the other string) or installing a downhole gage while fracturing. The information that can be obtained from such data is at best qualitative and an indication of the manner of fracture growth. Increasing pressures indicate obstruction to slurry movement inside the fracture; the steeper the pressure rise, the closer the source of obstruction is to the wellbore. Obstructions within the wellbore or at the perforations create a very rapid rise in wellbore pressure, as shown in Fig. 4. Sharp pressure increase and drops indicate presence and removal of a very near wellbore obstruction. Gradual pressure changes are representative of events inside the fracture, often also caused by obstruction to slurry/proppant movement inside the fracture. At times, when proper quality control measures are observed and used during the treatment, even surface pressure variations can be used as a frac diagnostic tool.
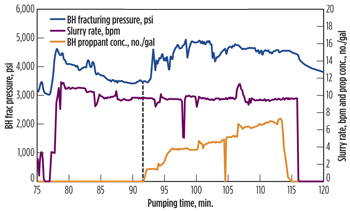 |
| Fig. 4. Fracturing treatment chart |
|
In many fracturing treatments the surface (and sometimes bottom-hole) pressure is the only diagnostic tool available for real-time decision-making. Pressure increases often mandate corrective steps to prevent damage to the wellbore or surface equipment. Learning to interpret this data (in-spite of its short-comings) can be very valuable for improving the operational success of the treatment. Experienced fracturing people know how to use this data to avert expensive fracturing problems.
Post-fracturing systems. These consist mainly of proppant and liquid tracer surveys. In proppant tracer surveys radioactive beads are mixed with the proppant and pumped inside the hydraulic fracture. Three different tracers are used to separate and differentiate the different stages of fracturing. The graphical presentation of these logs can sometime lead to mis-interpretation of the results. The logging tool can detect presence of radioactivity only within very short distances; less than two feet. The depth of investigation is even more limited, to around one foot. Thus, sharp spikes in the plots of these logs simply mean presence of more proppant, and not the fracture depth or type. Because of the very narrow width of transverse fractures (in the order of tenth of an inch) their tracer signal will be a very thin line. In the example presented in Fig. 5, the tracer survey indicates presence of axial (longitudinal) fractures. This does not mean that the final fracture was axial, only that the hydraulic fracture has an axial component near the wellbore. It also shows that three of the created fractures did not propagate within the intended intervals (separated by openhole packers and fractured using a ball-activated completion system).One fracture propagated into the previous interval, while the next three stages extended inside an upstream zone. Thus, the tracer survey has served as an indicator of completion and fracturing efficiency.
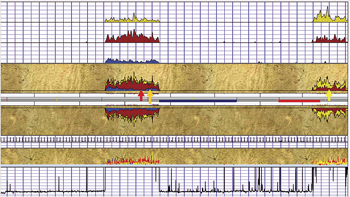 |
| Fig. 5. Fracture tracer survey, courtesy of Protechnics |
|
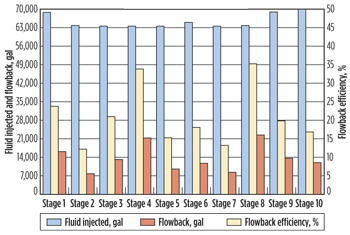
Liquid tracers are used as a means of examining the frac fluid return. In these systems a different liquid tracer is mixed and pumped with each stage of the fracture. Chemical analysis of the returned fluid during clean-up shows the pattern of fluid recovery from different stages. Fig. 6 shows one such survey. Liquid tracers are particularly useful for ensuring frac fluid return from the toe stages of the horizontal wells.
 |
| Fig. 6. Liquid tracer survey, courtesy of Protechnics |
|
Production history matching. These systems are based on production simulation. During these simulations various fracture characteristics (length, type, number, conductivity, etc.) are changed until a reasonable match is obtained with the actual well production. The main disadvantage of this system is lack of uniqueness. In reality, we know very little about various fracturing parameters to be able to do a representative simulation. This is particularly true for fractured horizontal wells where we often do not know the answer to a simple question like the number of induced fractures.
Inter-well communication. The intentional strategy of creating transverse hydraulic fractures in horizontal wells has resulted in unusual occurrence of inter-well communication between hydraulically fractured wells, to the extent that many Operators systematically shut-in the offset wells while fracturing. Fracturing fluid and even proppant is known to have been recovered from the offset wells, sometimes even causing production damage that requires a clean-up service. Recent publications on the subject highlight ability to determine several very useful fracturing parameters, such as orientation, growth pattern, fracture length, height, etc. This type of analysis is in its infancy at the present time, but has shown great potential to shed light on several key questions often raised for more successful fracturing. Given the operational necessity to shut-in the offset wells, it costs very little to record the pressure in these wells while fracturing.
Distributed temperature and acoustic surveys. In these systems permanent downhole sensors measure the variations of pressure, temperature, and acoustic activity during the life of the well (including while fracturing). At the present time, the techniques for analyzing this type of data are in their development stage. The few case histories available in the literature indicate that they have the potential and promise of forming the basis for next generation of fracturing knowledge and technology. In fact it is not unreasonable to expect this type of data to become the foundation for fully automated and controlled fractures of the future.
General Remarks. The reliability of any system of measurement is related to the distance between the measurement sensor and the source of the signal. Thus, while borehole measurements can provide accurate representation of the fracture near the wellbore, they do not provide reliable information about fracture behavior within the formation. The systems measuring fracture behavior within the formation (such as microseismic) can provide a reasonable representation of the overall fracture behavior, but the large scatter in the data limits the reliability of individual recorded signals. Thus, a sensible approach to use of various fracture diagnostic tools is integrating all the available data. In doing so, one often encounters contradictions between the various results, which leads to subconscious data prioritization. A good rule to follow in such situations is to prioritize based on the distance between the source of signal and the sensor; the shorter this distance, the more reliable the data.
Another important factor is to review and analyze the totality of the data, and to maintain an open mind. Selective use of the data to fit a preconceived model often leads to misleading conclusions and inadequate results. Too much reliance on theory can have the same effect. My guideline while analyzing data is to accept the observed behavior as the fact. If this fact does not match my theory, then I am applying the wrong theory to explain the observation. 
REFERENCES
1. Daneshy, A. A., G. L. Slusher, P.T. Chisholm and D.A. Magee, “In-situ stress measurement during drilling,” Journal of Petroleum Technology, August 1986, pp 891–89.
|


