Regional Report - Gulf of Mexico: Automated software workflow optimizes Lower Tertiary reservoirs
Producing from Lower Tertiary reservoirs presents significant, costly challenges, but employing a specific workflow to optimize hydraulic fracture design could improve development values.
|
RON DUSTERHOFT, MARSHAL STROBEL and MICHAEL SZATNY; Halliburton
The deepwater Lower Tertiary play is an extension of the established, onshore, Lower Tertiary Wilcox trend that runs along the Gulf Coast in southern Texas and Louisiana. Onshore, it is primarily a gas play, while in the deepwater Gulf of Mexico (GOM), the play targets the subsalt, Paleogene oil formation. This trend is 175 mi offshore and about 80 mi wide by 300 mi long. Most activity takes place in the Alaminos Canyon, Keathley Canyon and Walker Ridge areas. The trend is generally characterized by older sediments with lower porosities, ultra-deep water depths, and high bottomhole pressures (BHPs). For this trend, water depths range from 4,000 to 10,000 ft, and target reservoirs lie in depths between 25,000 and 35,000 ft. The reservoirs are thick, typically exceeding 1,000 ft gross, with high sand content [Halliburton 2011]. Lower Tertiary BHPs routinely exceed 20,000 psi, as bottomhole temperatures (BHTs) are between 230°F and 300°F. Permeability and porosity values generally range from 1 to 50 mD, with an average of 10 mD. Porosity values extend from 14% to 20%, with an average of 17%. There is a wide scope of PVT (pressure, volume, temperature) properties. The oil generally ranges from 22° to 41° API, with a low gas-to-oil ratio (GOR) and variable viscosity [Rains, et al., 2007]. Because of the low permeability and deep depths, it will be challenging to flow oil at rates high enough to pay out project capital investment. The only production data are from Chevron’s Jack 2 well test. The Jack 2 was drilled to a TD of more than 28,000 ft and sustained a flowrate of more than 6,000 bopd [SubseaIQ 2011]. This result indicated that commercial oil rates could flow from the Lower Tertiary. LOWER TERTIARY PROBLEMS Development of the Lower Tertiary trend encounters several technical challenges that affect commerciality. These challenges cover a well’s entire life cycle, including seismic imaging, drilling, well completion and infrastructure needs. Most of the Lower Tertiary reservoirs in Keathley Canyon and Walker Ridge lie under large salt canopies, which inhibit seismic imaging. New seismic technology is being applied to mitigate this issue and to properly plan drilling targets [Close et al. 2008]. However, the quality and interpretation of the seismic image and subsurface structure depend on the quality of specific geophysical algorithms used to interpret the data [Ford et al. 2008]. Wells can be drilled to confirm the seismic image’s reservoir characteristics, but the cost to drill an exploration well to test subsalt reservoirs in the deepwater GOM routinely exceeds $100 million [Weatherl 2010]. Considering these financial risks, good seismic imaging is essential in selecting economical fields before drilling. The unpredictable base of the salt can cause uncertainty with pressure differentials [Close et al. 2008]. Because the Lower Tertiary is associated with salt domes, and tar is associated with salt, tar is also a problem, because in an active mobile zone, it tends to flow into the wellbore. This occurrence decreases hole stability and can lead to expensive downtime, sidetracks, or even loss of the well [Cunha et al. 2009]. In addition, because these wells have high pressure values, any low-pressure zones can cause a massive circulation loss. All of these aspects can lead to delays, sidetracks and hole instability, each of which increases the drilling cost. Several challenges exist during Lower Tertiary completion phases. Deep wellbores extend the time and cost of cleanout and displacement. Due to the intricate completions, debris in the wellbore may cause issues with many different types of mechanical equipment. However, the time needed to drill out cement plugs and adequately clean out wellbore debris can require days and multiple workstring trips. When displacing the well to brine, multiple wellbore volumes are generally necessary, which can require significant time. The deep depths and high hydrostatic pressure from the heavy completion brine used during cased-hole completions eliminate the use of the typical explosive set, wireline setting tools, because available setting force decreases with hydrostatic pressure. Sump packers that are typically set on wireline might be forced to be set on workstring in this scenario, which can add a day to this normally routine process. The play’s reservoir thickness requires multiple perforated intervals that need stimulation, which presents challenges to deepwater frac packing. Conventional GOM stack pack sand control completions may require several days between zones, with one source citing a p50 value of 14 days between zones [Cunha et al. 2009]. Single-trip completion technology is implemented to complete these reservoirs more economically, the goal of which is to sequentially pack zones and reduce the time between each interval to a day or less. These single-trip systems must be capable of withstanding a high amount of proppant, pressure and pump-rate ratings to complete stimulation jobs of the Lower Tertiary [Burger. et al. 2010]. Single-trip completions also require shooting the entire perforation interval at one time. New perforating equipment may need to be rated to 30,000 psi to handle reservoirs near or above 25,000 psi [Addison et al. 2010]. Single-trip perforating shock loads can be substantial and require detailed analyses to prevent assembly failure [Sanders et al. 2011; Burman et al. 2011; Schatz et al. 2004]. The high BHPs cause high fracture gradients. Pump rates greater than 40 bbl/min are often required to treat long reservoir intervals. Moreover, the well depths will cause high friction pressures in wellbore tubulars. Under these conditions, pumping conventional 1.04 specific gravity fluid may generate surface treating pressures greater than 15,000 psi, which is the limit of nearly all surface treatment lines between the treatment vessel and the wellhead. High potential drawdowns (greater than 6,000 psi) will cause reduced proppant permeability and potential proppant fines due to crushing. Combined, all of these factors cause the completion intensity to be much more significant than previous deepwater wells. The size and remoteness of Lower Tertiary discoveries generally require a stand-alone development, in an area with little infrastructure development. High investment risk exists for pipeline companies, because of the play’s largely unproven nature [Ford et al. 2008]. Another option explored by some operators has been the use of FPSO vessels [Ribeiro et al. 2007], but FPSOs are new in the U.S. GOM, so a significant learning curve still exists. One operator, who developed a project with a deepwater production platform, had to plan for a 136-mi pipeline originating in nearly 7,000 ft of water, and had to compensate for numerous challenges [Rigzone 2011]. Overall cost of the entire development was $7.5 billion [SubseaIQ 2011]. Rising upstream capital and operating costs can make Lower Tertiary investment more prohibitive. After a brief lull, due to the recession, both the upstream capital cost and operating cost indices have increased steadily and are nearing all-time highs [IHS 2011]. These rising costs limit the rate of return on investment. In a recent report of 25 known and undeveloped GOM prospects, the internal rate of return (IRR) for several projects was calculated. For 17 typical deepwater well projects, IRR values ranged from 8% to 34%, with 11 fields above 15%. For eight Lower Tertiary projects, IRR values ranged from 7 to 11%, with four fields above 8% [American Petroleum Institute 2011]. From all of the previous economic details, it is apparent that the deepwater GOM requires significant operator investment in the play, and that Lower Tertiary projects have significantly lower projected rates of return in relation to other deepwater projects. Although seismic, drilling and facilities design issues are beyond this article’s scope, a completion evaluation process is presented to help maximize the net present value (NPV) in light of operational and equipment constraints, and some production uncertainty. COMPLETION WORKFLOW SOLUTION Because Lower Tertiary GOM reservoirs possess major technical completion challenges and have lower potential rates of return, any optimized completion process must include system-wide integration across multiple domains. The candidate evaluation process selected to perform this task is the automated software workflow, the framework for which is described by Szatny [2007]. According to Carvajal, et al. [2010], some benefits of the automated software workflow include optimization of engineering and economic parameters for the oil field; more efficient use of time to analyze results, rather than set up models; consistent project methodology when approaching issues; and reduced probability of data entry errors. Commercial workflow automation software was selected as the basis for the workflow design, because it could connect virtually any software component with both optimization techniques and other software components. The workflow consists of the following components:
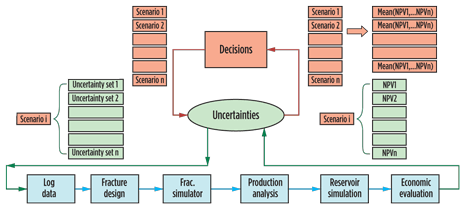
Model introduction snapshot. This workflow optimizes a stimulation design for the completion by enabling the engineer to automatically try several combinations of multiple decision and uncertainty parameters. By implementing various parameters, the workflow suggests the stimulation designs that are technically feasible within the completion constraints and maximizes the objective function over a given time period. Completion constraints include factors that render a stimulation design unfeasible, such as unacceptable levels of workstring movement during stimulation, forces on the workstring due to the stimulation design that may cause pipe failure, and exceeding surface treating pressure limits. Other constraints include those related to boat volume, so that only stimulation jobs that can be pumped under currently available vessels, as affects fluid volume, proppant volume and hydraulic horsepower, are considered. The objective function may be simply the cumulative hydrocarbon production or some economic indicator, such as NPV. This enables engineers to make sound decisions in an organized, automatic fashion. Next, engineers may try these decisions in light of uncertainties beyond their immediate control. Engineers can examine two sets of parameters. First are the decision parameters, which are aspects that engineers can directly control, including the type, amount and concentration of proppant; number of zones to be perforated; perforating system; fracture fluid rate and density; completion type; and configuration of the production tubing and casing. Second are the uncertainty parameters—aspects that engineers do not directly control—including perforation effectiveness; gravel pack, fracture and reservoir permeability and porosity; cost of drilling and later abandoning a well; the price of oil and gas; and tax rates. THE WORKFLOW Fig. 1 presents the schematic for the suggested workflow. First, a combination of decision parameters (a scenario) is selected, called the outer loop. Next, the scenario is evaluated for the full range of uncertainty parameters, known as the inner loop. Each scenario generates multiple values of objective functions, corresponding to each set of uncertainty variables. These values can then be analyzed to obtain statistical parameters that describe characteristics of the distribution. When the optimization is achieved, or when all possible scenarios have been exhausted, the results of various scenarios are compared and ranked, based on the objective function values and the risks associated with them.
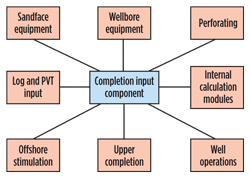
For each scenario, the mean and standard deviation of objective functions (NPV, IRR or any other desired indicator) are calculated, which measures the risk inherited from the uncertainties. The purpose of this analysis is to select scenarios, based on the value that they add (NPV) and the risk associated with attaining that value. For this article’s purpose, the decision and uncertainty factors are implemented by means of full factorial sampling. Software framework. The workflow framework software hosted all of the other components and fostered the holistic analysis. The workflow consists of multiple components, specifically software framework, completion input, fracture simulator, tubing mechanics, production systems (VLP/IPR) analysis, reservoir simulator and economic analysis. This software environment simplifies the creation of multi-domain workflows with an easy-to-use, drag-and-drop interface. The output from one application automatically becomes the input for another. This framework also introduced additional functionality by providing the workflow platform with a design-of-experiments function that enabled implementation of the decisions and uncertainties loops. Well completion input component. The completion input component consists of several individual modules (Fig. 2) that serve three primary functions. The first function enables the entry of the completion equipment used in the wellbore. The input sections compile equipment data and price specifications for use in economic calculations. The second function is to perform intermediate calculations to transform the raw input data to a form that can be transferred to other components. The third function is to compile the input data and perform calculations on completion limitations.
Fracture simulator. The fracture simulator component uses the analytical schedule and formation components from the input component to generate 3D fracture geometry, which follows the practice of many completion engineers to use an analytical schedule with 3D software. This component also provides final fracture length, hydraulic width, propped width, net pressure and net pressure gain. The fracture geometry, volume and pressures are then passed to the tubing mechanics, production systems analysis and reservoir simulator components for all intervals to be perforated. Tubing mechanics. For the sand-control stack pack and single-trip, multi-zone completions being planned, the stimulation treatment is pumped through a sand control service tool, around the gravel pack assembly, and out into the perforations. This process generates a barrier-to-fracture stimulation optimization, because deepwater tubing movement may be significant [Ross 2003]. Therefore, any stimulation treatment must pass the following constraints for multiple stages, including initial conditions and the deepwater stimulation treatment:
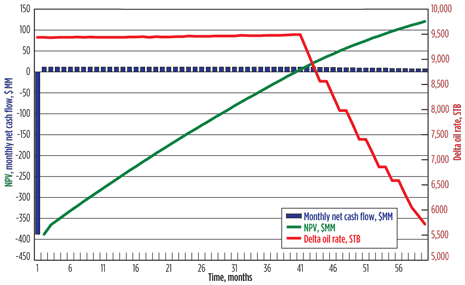
Production systems/VLP/IPR analysis. The VLP/IPR analysis is run by commercial production systems analysis software. After the wellbore, reservoir fluid properties and formation properties are constructed in this software, and the workflow data entries are used to run the analysis. The workflow will enter the fracture length and conductivity, perforation tunnel length, perforation tunnel permeability, annulus gravel permeability, effective flowing shots per foot and drawdown information. The inflow analysis software will generate a liquid rate for a given drawdown, which is then imported into the reservoir simulator, and enables information about VLP, pipe/tubing optimization and perforation optimization to be included in the engineer’s portfolio. Reservoir simulator. The workflow evaluates production over a five-year period. After the drainage volume, PVT, reservoir properties, fracture, gridding and time details data are entered, this component can export the production profile and changes in the rate over time as a result of depletion and damage to the fracture conductivity. Economic analysis. The workflow compiles all costs incurred that are attributable to completion, drilling and facilities cost per well. Then, the workflow combines the information about oil rate and production over time with oilfield economic indicators, such as oil and gas prices and tax rates, to generate a total income. It then generates the NPV of the proposed completion after five years, Fig. 3. Related calculations performed include IRR and payback time. This component also calculates original oil-in-place, total cumulative oil produced and the recovery factor after five years.
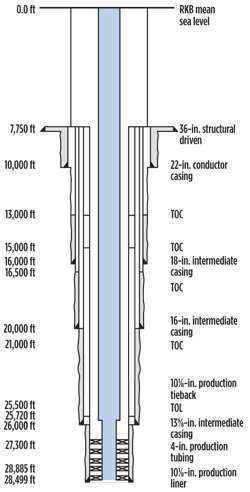
CASE STUDY To display the benefits of this optimization process, the workflow was run for a hypothetical Lower Tertiary reservoir. Although this log does not represent an actual well in the trend, it does display the hallmarks of a deepwater Lower Tertiary well: thick, laminated pay intervals of more than 1,000 ft, higher Young’s modulus values than typical GOM deepwater wells, and lower permeability and porosity values on the order of 5 to 8 mD and 16% to 18%, respectively. Reservoir description. In 7,500 ft of water, there is an interval from 27,500 to 29,300 ft MD with 1,800 ft of gross pay. The vertical well in a square reservoir will have a 12.25 in. OD. The reservoir pressure, top to bottom, ranges from 20,789 psi to 21,843 psi, while the bottomhole static temperature ranges from 232.5°F to 248°F. The PVT consists of 21° API, 200 GOR scf/bbl, 1.1 RB/STB formation volume factor, and 6.0 cp µ. Five pay intervals are intersected across the frac pack completion, with 1,684 ft of gross pay height contact and 1,285 ft of total perforations. Other factors include permeability ranging from 5.3 mD to 8.1 mD, porosity ranging from 16% to 18% Φ, and Swirr ranging from 25% to 30%, culminating in 7,000 mD/ft. The rock formation properties include an overburden gradient of 0.855 psi/ft to 0.862 psi/ft, a minimum horizontal stress gradient of 0.795 psi/ft to 0.80 psi/ft, and Young’s modulusPlaneStrain of 2.1 million to 2.9 million psi. Total compressibility of the oil, rock and water is 7.7×10⁻⁶ psi-1. Wellbore description. The wellbore has a five-zone, single-trip, sand control completion [Burger et al. 2010], with 10.75×10.125 in. (8.5-in. ID) production casing and a 5.875×4 in. workstring, Fig. 4. Company-specific wellbore cleanout tools, completion fluid service technology and cased-hole wireline technology were used. The tubing-conveyed perforating completion system was comprised of a 30,000-psi-rated high pressure gun system and 15-SPF, 0.85-in nominal EHD, 120° phasing. To enhance production, 11.0-ppg, cross-linked fracture fluid was used, as was an 8-ppa maximum proppant concentration, and company-specific fluid additives and stimulation vessels. Completion and production operations included 5.5-in. subsea production tubing and company-specific upper completion technology. The rig day rate was $500,000/day.
Decisions and uncertainties. Some decisions the engineers made to affect the production rate and NPV included drawdowns of 5,000 and 7,500 psi, design fluid efficiencies of 25% and 45%, a tool surface set-down weight of 115,000 lbf, and the use of three types of high-strength proppant, 16/30, 20/40 and 30/60, with 750,000 lb, 1.5 million lb and 2.5 million lb used, respectively, over the five zones. However, a greater number of values used single uncertainties to make the simulation time more manageable. Several multiplier inputs were set to 1.0, specifically for producing reservoir porosity, perforation effective EHD and completion costs. Other multiplier inputs include perforation-effective SPF (a fraction of 0.175), gravel pack/perforation permeability (a fraction of 0.25) and producing proppant permeability (a fraction of 0.45). The nominal entry-hole diameter was 0.85 in., and the effective SPF was 2.625. As for financial factors, the gas price was set to $4/MMscf, the CAPEX per well (excluding drilling, completion and abandonment) was set to $250 million, the cost of drilling the well was set to $120 million, the well abandonment cost was set to $25 million, the discount rate was set to a fraction of 0.1, and the effective tax rate was set to a fraction of 0.40 [GAO 2007]. Overall results. Thirty-six scenarios were generated. Under the conditions evaluated, the decision and uncertainties selected for the case study can produce a range of positive to negative NPVs. This is a positive result, indicating that completion and production engineers do have the means within the decisions they control to positively affect production. The maximum NPV scenario indicated a mean NPV of $193 million, with a standard deviation of $110 million. This corresponds to the maximum IRR of 26.3%, with a standard deviation of 9.9%. The increased drawdown, proppant amount and proppant size resulted in an increasing NPV. The two sets of data correspond to the different drawdown values of 5,000 psi and 7,500 psi. Even at a drawdown value of 5,000 psi, the maximum proppant scenario generates only a minimal positive NPV ($28 million). The higher drawdown value of 7,500 psi was required to provide more economically viable results under the given conditions. Moreover, larger volumes of proppant and higher mesh size proppant also lead to a greater NPV under the conditions presented. Results of particular interest. Simulation details indicate that all workstring forces were within safety limits, and there was no workstring movement during all of the modeled scenarios. The collapse-pressure ratings on the lowest-rated component on the gravel pack were not exceeded, nor were proppant and pump rate limitations for the sand control tool system. The vessel feasibility limit, which includes HHP demand, fluid volume and proppant volume, was not violated. The 7,500-psi safety limit imposed on the subsea annular blowout preventer, and the wellhead treating pressure limit of 15,000 psi, were also not exceeded. Payback times, which directly correlate with NPV and IRR, range from a low of 39.9 months to a high of 60 months. The highest completion and well costs were also directly correlated to the highest NPV, because larger fracture treatments cost more than smaller treatments. Ultimate cumulative production over the five-year period ranged from 11.8 million bbl (4.5% recovery factor) to 21.1 million bbl (8.0% recovery factor). The related maximum oil rates ranged from 6,527 to 12,210 bpd. The low GOR and 21° API gravity of the oil resulted in a maximum gas production rate of 2.4 MMcfd. It is also important to note the large differences in the gravel pack and perforation tunnel skin in the Lower Tertiary completions vs. conventional high-permeability GOM wells. Although certain sources show that high skin from gravel- and perforation-induced effects may mask the fracture [Welling 1998; Chitale et al. 2009], the maximum skin factor on any rate was less than 0.1, even with gravel pack tunnel permeabilities of less than 10 Darcy and effective perforation of 2.625 flowing SPF. The hydraulic fracture half-lengths ranged from 94 ft for the smallest amount of low-permeability proppant to 354 ft for the largest amount of high-permeability proppant. Pad net pressure ranged from 239 to 298 psi. Because all of the treatments used the tip screen-out techniques to achieve desired fracture half lengths, the net pressure gains were measured and ranged from 337 to 924 psi. CONCLUSIONS Several conclusions may be determined from the workflow. First, it is extremely important to maximize interaction between multiple applications to obtain a complete picture of how the completion design process affects production in the reservoirs. Second, the combination of certain decisions with the appropriate uncertainties can deliver meaningful results and direction about how achieve maximum NPV. Third, maximizing drawdown, proppant in pay and proppant permeability is a first-order method to increase NPV for the low-permeability, high-pressure reservoirs of the Lower Tertiary. Finally, differences exist between the production behavior of lower-permeability, deepwater Wilcox sand reservoirs and typical, high-permeability, deepwater GOM reservoirs. The Lower Tertiary wells will require very high drawdowns to produce economically, which contrasts with the lower drawdown requirement of high permeability GOM wells. Moreover, the perforation tunnels and annulus gravel skin effects have less of an effect on total completion skin compared to deepwater, high-permeability reservoirs. As the Lower Tertiary fields begin to come online, automated workflows will assist engineers in capturing and implementing those decisions that affect production most dramatically in a much faster, efficient manner. Bottlenecks in NPV maximization can be identified, and overall field development can be improved. ACKNOWLEDGEMENTS LITERATURECITED
|
- Prices and governmental policies combine to stymie Canadian upstream growth (February 2024)
- U.S. producing gas wells increase despite low prices (February 2024)
- U.S. drilling: More of the same expected (February 2024)
- U.S. oil and natural gas production hits record highs (February 2024)
- X80 heavy wall pipe solutions for deep/ultra-deepwater field developments in mild sour environment (November 2023)
- Wellbore seal control and monitoring enhance deepwater MPD operations (October 2023)
- Applying ultra-deep LWD resistivity technology successfully in a SAGD operation (May 2019)
- Adoption of wireless intelligent completions advances (May 2019)
- Majors double down as takeaway crunch eases (April 2019)
- What’s new in well logging and formation evaluation (April 2019)
- Qualification of a 20,000-psi subsea BOP: A collaborative approach (February 2019)
- ConocoPhillips’ Greg Leveille sees rapid trajectory of technical advancement continuing (February 2019)


