JONATHAN J. WYLDE, JUBAL L. SLAYER and KEITH ALLAN, Clariant; and TOMMY LOVELL, Tana Exploration
Root-cause failure analysis on the problematic tiebacks and experimental testing of chemicals resulted in an effective flow assurance program.
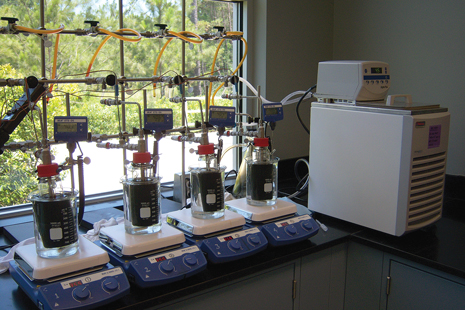 |
| Cold-finger testing of paraffin inhibitors on Satellite 4 condensate. |
|
A subsea development in the Gulf of Mexico was experiencing flow assurance challenges due to both hydrate and paraffin formation. The basic field architecture comprised three satellite dry-tree wells (Satellites 1, 2 and 4) that were flowed via relatively shallow subsea flowlines to a host processing facility, where production was commingled with that of platform wells. The incumbent chemical treatment comprised injection of 20 gal/day of a thermodynamic hydrate inhibitor at Satellite 1, 275 gal/day of an aliphatic paraffin solvent at Satellite 4 and an additional 20 gal/day of paraffin solvent at the production facility. Even with these incumbent treatments, hydrate plugging occurred in the Satellite 1 subsea flowline, and the Satellite 4 flowline experienced precipitation of mixed paraffin and hydrates.
The Satellite 1 flowline required daily depressurization to remove the hydrate. The blockage was observed closer to the main platform than to the satellite, presumably because bleed-down was faster on the platform side. In the Satellite 4 flowline, fluids sampled upstream of chemical injection were found to be frozen solid, with a measured temperature of 15°F; however, this was considered unrepresentative because the sample would have experienced significant Joule-Thompson cooling upon removal from the system. Solvent treatment had little effect, as the solids were still isolated from the production separator on the main processing platform. A significant pressure drop was observed across the choke on the Satellite 4 well, which caused a sharp temperature drop and was the likely root cause of paraffinic solid deposition along with some hydrate components.
The challenge was to perform root-cause failure analysis by designing a series of experiments to replicate the conditions offshore and then determine a suitable mitigation strategy that could be implemented in the field. At Satellite 1, modeling and process compatibility testing led to the recommendation to inject a new kinetic hydrate inhibitor (KHI) via the existing injection point, which eliminated the daily shut-ins and associated flowline depressurization operations. A range of testing yielded a treatment recommendation for Satellite 4 that prevented wax deposition in the flowline and eliminated the process separation issues at the platform.
The correct chemical formulation and optimization created significant cost savings in reduced operations and chemical overhead for the operator. Additionally, shutdowns that had previously resulted in lost production were no longer necessary, yielding significant value savings.
HYDRATE TESTING AND RESULTS
A hydrate evaluation was performed using Multiflash modeling, complemented by subsequent autoclave tests to ensure the performance of the chemical treatments. The paraffin evaluation included pour-point, cold-finger, solvency and precipitation testing. Once chemical treatments had been selected, further test work was performed to evaluate their foaming and emulsion tendencies, in order to ensure that the treatment chemicals did not result in secondary problems on the host production facility.
Hydrate modeling. The modeling software predicts hydrate behavior using multiphase equilibrium coupled with an equation-of-state activity coefficient incorporating transport property models. It provides a quick and effective approach for evaluating hydrate subcooling and mitigation requirements.
The phase boundary diagrams derived from the results of hydrate modeling for Satellites 4 and 1 are plotted in Figs. 1 and 2, respectively. These plots show the hydrate dissociation and formation temperature and pressure conditions. To the right of the dissociation curve, hydrates are unlikely to form. To the left of the formation curve, hydrates are likely to form and the system can be stated as operating within the hydrate formation window. When operating between these two curves, the system is termed meta-stable and hydrates may or may not form, largely depending on the thermodynamics and kinetics of the system.
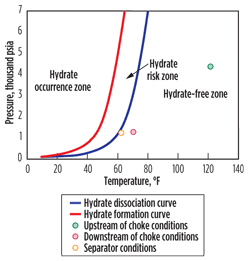 |
| Fig. 1. Modeling output for Satellite 4 showing operation outside of the hydrate occurrence and hydrate risk zones. |
|
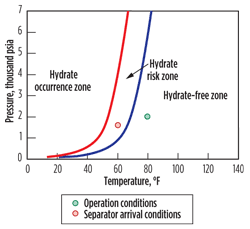 |
| Fig. 2. Modeling output for Satellite 1 showing operation in the hydrate risk zone. |
|
It can be seen that under any of the current operating conditions, there is no hydrate risk for the Satellite 4 well or flowline. Even under the high pressure upstream of the choke, the temperature is sufficiently high to be well outside the hydrate risk zone. Moving further downstream past the choke the system cools, but the pressure also decreases, keeping operation outside the hydrate risk zone. This substantiates the earlier conclusion that the ice formation observed while sampling fluids upstream of the choke was caused by large-scale Joule-Thompson cooling across the needle valve, rather than conditions in the flowline.
In contrast, as the Satellite 1 fluids cool from the departing subsea flowline toward the host platform, conditions move into the hydrate risk zone. There is not a high degree of subcooling (maximum of 5°F), so this hydrate risk should easily be controlled using the correct chemistry. Furthermore, these conditions are within the operating limits of a KHI.
Hydrate autoclave tests. Due to the strict time constraints placed on this project, there was insufficient time to run hydrate tests under the specific field conditions. Therefore, analogous testing that had been performed previously was used instead. High-pressure autoclaves containing deionized water (67 ml) and condensate (133 ml) were dosed with KHI and pressurized with a standard gas. Flow conditions were replicated by a magnetic stirrer at a mixing rate of 500 rpm. The test temperature was regulated by a digital recirculating cooling bath. During the course of the tests, cell pressure and fluid temperature were monitored via digital pressure transducer and thermocouple outputs, respectively. Pressure and temperature readings were logged throughout the test.
Results from hydrate autoclave tests that had been performed with a similar paraffinic condensate were used to select the candidate hydrate inhibitor for treating the Satellite 1 flowline. The pressure and temperature plots for the blank test showed immediate and catastrophic hydrate formation as the temperature fell beneath the hydrate formation temperature. This is manifested as continuous pressure decline as gas is consumed into the clathrate structure of the hydrates, Fig. 3a. In the inhibited test with 2% KHI, no hydrates formed over the entire 68-hr test period, Fig. 3b. The inhibitor tested was a relatively low-activity, classic chemistry that was blended with an alcohol and glycol matrix and had a synergistic alkoxylated glycol.
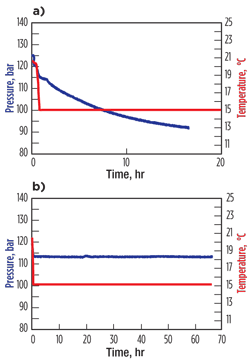 |
| Fig. 3. Comparative hydrate autoclave results for a) the blank test and b) the 2% hydrate inhibitor test. |
|
PARAFFIN TESTING AND RESULTS
Along with incumbent aliphatic solvent treatment, three paraffin inhibitors were selected for testing based on previous inhibition experience in the same geographic area, as well as the properties of the field condensate. Inhibitor A was a blend of ethylene vinyl acetate (EVA) and polyacrylate in a hydrocarbon solvent, while Inhibitors B and C were different blends of EVA, polyacrylate and dispersant in a hydrocarbon solvent.
Two condensate samples were used: 1 gal of untreated condensate from Satellite 4 (sampled upstream of the choke) and 2 gal of treated condensate (sampled from the production separator on the platform). All methods described below were performed on the untreated Satellite 4 sample except foam and emulsion tendency testing, where the treated sample was used due to consumption of the untreated sample in previous tests. Prior to sub-sampling, the condensate was homogenized in a water bath at 160°F for 6 hr, with regular agitation, in order to dissolve any paraffin that may have crystallized.
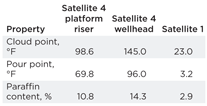
The physical properties measured on the condensate samples relating to paraffin formation are listed in Table 1. The most significant observation is that the Satellite 4 platform riser sample had a lower cloud point, pour point and paraffin content when compared with the untreated wellhead sample. This suggested that paraffin deposition is occurring in the flowline. Satellite 1 condensate analysis showed that the cloud point was below the flowline temperature; therefore, it was determined that paraffin deposition potential was very low and any blockage was most likely associated with hydrate formation.
| Table 1. Condensate physical properties relevant to paraffin deposition |
 |
Pour-point determination. When the temperature of crude oil falls below the cloud point (or wax appearance temperature), paraffin crystals form. Further cooling leads to crystal growth and the formation of a semi-solid or solid gel consisting of interlocked paraffin crystals, asphaltenes, oil and water. The lowest temperature at which fluid movement of the crude oil occurs is called the pour point. The ASTM D97–96a method was used to test the condensate samples.
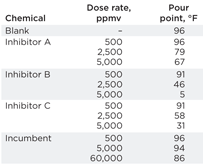
Due to the small volume of untreated condensate, pour-point depression tests were performed as a pre-screening tool. Various concentrations of paraffin treatment chemicals were tested in order to gauge their suitability and potential dosage rates. The results showed many important trends, Table 2. Firstly, the typical Gulf of Mexico injection rate of 500 ppmv was wholly inadequate for this highly paraffinic condensate and had little or no effect on the pour point. The incumbent chemical had next to no effect on the pour point, even when used at the field application rate of 60,000 ppmv—demonstrating that solvent-based diluents were not suitable for such highly paraffinic condensate. Finally, 2,500–5,000 ppmv of all three test chemical inhibitors produced a large reduction in the pour point. The best-performing product was Inhibitor B, as it reduced the pour point to just 5°F when applied at 5,000 ppmv.
| Table 2. Summary of pour point experimentation on Satellite 4 condensate |
 |
Cold-finger paraffin deposition tests. Cold finger testing efficiently evaluates the performance of paraffin dispersants and crystal growth modifiers. The protocol is founded on the fact that the paraffin in crude oil will deposit on a cold surface whose temperature is less than the cloud point. Crude temperature is maintained by being immersed in a water bath. Into this water bath are placed the cold fingers, which are connected to a chiller bath. Efficient paraffin dispersants will prevent deposition of paraffin crystals on the surface of the cold finger. Comparative determination of the mass of paraffin gained from treated and untreated crude allows assessment of inhibition efficacy.
A 200-ml sample of condensate was carefully poured into each of the pre-heated cold-finger flasks, which were then immediately placed into the water bath at 150°F (above the cloud point) to ensure that no paraffin deposition occurred on the walls of the flasks. One of the four cells was always uninhibited (blank) and the other three cells contained inhibitor. The cold fingers were then immersed into the crude oil and set to 50°F (the worst-case shallow seabed temperature). The test was run for 3 hr (the calculated residency time in the Satellite 4 subsea flowline), after which the cold fingers were removed from the flasks and left to stand for 10 min. to allow any liquid crude oil to drop from them. The deposition on the cold fingers could be determined without the need for scraping or use of solvent because deposition occurred on pre-weighed removable sleeves.
Excellent inhibition (91%) was observed using 5,000-ppmv Inhibitor B. Although this was a high dose rate, it was a fair reflection of the high paraffin content of the condensate. During the test, the dispersion properties exhibited by Inhibitor B could clearly be seen, as the paraffin crystals that formed on the finger broke off immediately and remained dispersed in the bulk hydrocarbon phase. The incumbent chemical, on the other hand, performed poorly, delivering only 13% inhibition when dosed at field injection rates of 60,000 ppmv. Furthermore, even that level of efficacy could largely be attributed to a dilution effect rather than any inhibition or dispersion.
EFFECTS ON PROCESSING
Due to the very high concentration of chemical required for the control of hydrate and paraffin, it was important to ensure that the chemicals added did not create adverse foaming effects in the produced fluids. The addition of any production chemical in high concentration has the potential to induce foam formation due to the surfactancy properties exhibited by many chemicals.
A 100-ml fluid sample was placed in a 250-ml graduated cylinder at 150°F, and the sample was sparged with nitrogen at 0.2 ml/min. for 2 min. The initial foam height and the time to collapse of the foam after cessation of gas flow were recorded. The various paraffin and hydrate inhibitors were added to the solution, and sparging of gas continued. Again, both the initial foam height and the time to collapse were recorded. Tests were performed for two fluids: pure condensate and a 50:50 mixture of produced water and condensate.
Tests were performed using 2,500-ppmv Inhibitor B, 5,000-ppmv Inhibitor B and 2% KHI (based on total fluids, the worst-case concentration).
The paraffin inhibitor induced no additional foam formation at either concentration when compared with the blank sample. The addition of KHI resulted in a small volume of additional foam when compared with the blank sample, but as soon as the gas flow ceased, the foam broke very quickly. In summary, none of the tests indicated that a foam problem would affect the process upon application of any of the recommended chemical treatments. Pure condensate was observed to foam more than the condensate-water mixture.
The application of any production chemical can potentially lead to increased emulsion formation and process upsets due to the presence of surfactant and/or surface-active components. Given the importance of efficient oil-water separation, the influence of the recommended products on this process had to be investigated.
Field condensate was used in combination with produced water. The tests were performed at 150°F to prevent paraffin precipitation; this was higher than the process temperatures, but would not affect the experiment’s validity with regard to whether an emulsion problem would be worsened by the presence of inhibitor.
Appropriate volumes of oil and water were dosed with the appropriate test chemical and then shaken hard 200 times. Immediately after shaking, time-lapse photography was used to record water separation volume and speed. All tests were performed with a 50:50 water-condensate mixture. Four tests were performed; a blank and individual tests with addition of 2,500-ppmv Inhibitor B, 5,000-ppmv Inhibitor B and 2% KHI. All three chemicals were observed to induce a slight effect on fluid separation, but not a significant one, as all tests fully separated in under 30 s. This was well within the fluid residence time in the platform separators.
FIELD APPLICATION
Combining the lab results and analysis of field data, it was clear that there was a severe paraffin deposition challenge in the Satellite 4 well subsea flowline. In order to ensure the maximum benefit of any implemented paraffin inhibition program, it was proposed that an initial solvent treatment be performed to remove existing deposition. The 4-in., 2-mi flowline had a volume of about 5,277 gal (125 bbl). At a liquid production rate of 36 bbl/hr, therefore, the residency time was about 3 hr (taking into account the gas rate). The operator decided to perform a solvent batch treatment prior to injection of paraffin inhibitor. A slug of 1,750 gal (42 bbl) of a mixed aromatic and aliphatic solvent was pumped into the flowline. Production was brought back online at a reduced choke to displace the solvent through the flowline.
Following the solvent treatment, 5,000-ppmv (based on condensate production) Inhibitor B was injected immediately upstream of the Satellite 4 platform well choke to prevent further wax deposition in the flowline. The success of this treatment was evaluated through regular monitoring of flowline pressures and analysis of fluid samples that ensured that the physical properties of the condensate samples were unchanged across the flowline.
Simultaneously, an injection of the recommended KHI began at the existing injection point upstream of the Satellite 1 choke. Injection began at 2% based on water production (6.25 gal/day). This rate was optimized based on pressurization of the flowline during application.
Implementation of the dual chemical treatment program resulted in a clear step change in performance. Field measurement of pour point and paraffin content showed that deposition was unlikely to occur in the flowline, as evidenced by the fact that paraffin content was identical upstream of the injection point and at the host facility. The pour point was also greatly suppressed, as evidenced by the lower viscosity of the condensate on the platform, and paraffin solids in separator samples were no longer apparent. This latter observation helped to alleviate separation problems experienced in the separators with respect to interface level control problems, which would periodically cause field shut-in.
The efficacy of the hydrate control strategy was even more impressive. Under the incumbent treatment, the Satellite 1 flowline suffered almost daily hydrate formation incidents and required total tieback shutdown and flowline depressurization. As the field is essentially unmanned, this required daily trips to the field by operator personnel and significantly added to the operating costs. When the new KHI was introduced to the field, these incidents were completely eliminated. The injection of both chemicals was shown to have no detrimental effect on the platform processing operation with respect to foaming or emulsion stability.
Based on the first three months of treatment, and taking into account the additional production time available due to the elimination of shutdowns, it was estimated that the additional revenue to the operator was on the order of $800,000, along with an operational cost savings of $100,000 (e.g., helicopter charter costs). The chemical treatment cost for the same period was $50,000, so the net benefit to the operator was about $280,000 per month. 
ACKNOWLEDGMENT
This article was prepared from the paper “Implementing a combined LDHI and paraffin inhibitor program providing complete flow assurance management,” presented at the Southwestern Petroleum Short Course held in Lubbock, Texas, April 20–21, 2011.
THE AUTHORS
|
|
JONATHAN WYLDE is the Business Manager for Clariant Oil Services in the UK. He joined Clariant in 2002, initially working in the scale team of the R&D center in Aberdeen, UK. He moved to Houston in 2007 to become Technical Manager for North America, and then to Calgary in 2009 as Canada Business Manager. Dr. Wylde earned a BSc with honors in geology and a PhD at the University of Bristol in the UK.
|
JUBAL L. SLAYER is a Wax and Asphaltenes Development Chemist and Technical Coordinator for Clariant in Canada. He joined Clariant in 2010, having previously managed major assets in the Gulf of Mexico and the North Sea. Mr. Slayer spent eight years in the US Marine Corps and holds a BSc degree with honors in biological science from Holy Names University in Oakland, California. |
KEITH ALLAN is the Head of Application Development for Clariant Oil Services in North America, based in The Woodlands, Texas. He has over 24 years’ international experience in oilfield chemical applications, and holds a BSc degree with honors in applied chemistry from the University of Leicester in the UK. |
TOMMY LOVELL is a Production Superintendent for Tana Exploration, a Gulf of Mexico-focused independent with headquarters in The Woodlands, Texas. |
|


