Industry Report: Research efforts aim to improve Arctic transport for E&P operations
Optimizing ice road networks through better understanding of water availability and environmentally sensitive areas will expedite the development of oil and gas reserves on Alaska’s North Slope.
 |
|
|
 |
|
|
The research site was selected, and land-use permits authorizing installation of a snow barrier and equipment to collect snow and hydrology data were obtained from the Alaska Department of Natural Resources and the Fairbanks North Star Borough. Permission for land use was obtained from the Alyeska Pipeline Service Company (the consortium that operates the Trans-Alaska Pipeline System) and the Alaska Department of Transportation. Weather data analysis indicated that the snow accumulation season extends from September to June, the prevailing wind direction and snow drift orientation are northeast, the mean winter precipitation is 4.13 in. (105 mm). Based on the weather data, it was estimated that snow barrier height should be 10.5 ft (3.2 m) and snow barrier length should be at least 427 ft (130 m).
The automated snow accumulation data collection was initiated at three locations: the Franklin Bluffs meteorological station, a hydrological site at the gravel pit (i.e., the experimental reservoir), and a hydrological site at the control lake. Snow water equivalent (SWE) at Franklin Bluffs was measured as 6.3 in. (160 mm) on April 29, 2009. In comparison with previous years, snow depth and SWE were above average. Data from different projects in 2000–2008 were collected by WERC researchers. The SWE measured in 2009 was 33% greater than the 10-year average. In addition to a historical snow survey, snow depths were measured at the gravel pit and control pond. The barrier was installed at the end of August 2009 following the Tabler & Associates snow fence guide published by the National Research Council’s Strategic Highway Research Program. In September 2009, the barrier was reinforced and re-anchored into the permafrost.
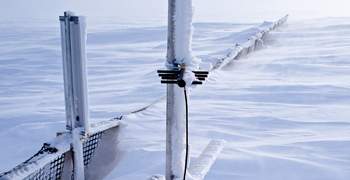
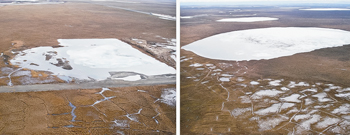
Major water sources and sinks were measured at the experimental and control lakes. Research included a bathymetric survey, water level records and measurements of the lake outflow, rain precipitation, evaporation and water withdrawal from the gravel pit. A tower near the snow barrier was equipped with a data logger, power, a solar panel, a camera, an antenna, a radio, and relative humidity and air temperature sensors to monitor snow drift growth and melt. The radio transmited all the data and camera images from the snow barrier site to the WERC server in real time.
Snow drift elevation was measured twice in the summer of 2010 using high-precision GPS instruments. Snow drift volume was calculated in ArcGIS 3D Analyst software using drift snow density averages. The estimated drift volume on June 21, 2010, was 209,900 cu ft (5,943 cu m). SWE was estimated with the field data, and a model was developed to estimate snow drift melt based on the continuous snow depth data obtained from three sonic depth sensors. The snow drift lost about 75% of its volume during the first three weeks of melt.
Pretreatment water balance analysis for 2009 indicated that the majority of water loss was due to evaporation from the lake surface, with only half of the water loss being replaced through summer rainfall. The cumulative rainfall in 2010 was below average and equaled only half the rainfall total for 2009. However, water balance calculations indicated that there was additional inflow into the man-made lake in 2010.
Research has shown that the installation of the snow barrier reduced reservoir water loss due to snow sublimation. The resultant snow drift added an additional month of water to the lake supply that can be utilized for ice road construction. Water levels in the lake near the snow barrier were elevated during the entire 2010 open-water season. Water levels in the control lake declined during the same period. Costs for generating the additional water through snow barrier installation were one-tenth of the cost of trucking in water from other nearby sources. Data collection will continue on this project through the end of 2011 to acquire additional information on added snow amounts and cost estimates that can be used to refine recommendations for implementing similar installations.
ROUTE PLANNING AND PERMITTING
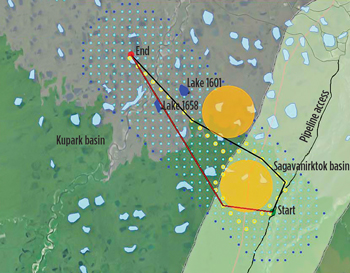
Adding to the challenge of limited or variable water availability is the need for coordination in the common use of water resources by many ice road planners. Dr. William Schnabel and his team at UAF’s Institute of Northern Engineering have developed the North Slope Decision Support System (NSDSS), a software application that can be used by both the oil and gas industry when planning ice road routes and the regulators involved in the permitting process. The decision support system is a web-based application (nsdss.net) that helps ice road planners by utilizing user input such as desired start and end points and possible sources of water to produce multiple ice road routes. The optimal road alignment algorithm finds the routes that minimize ice road length, construction time, and construction and operational cost while avoiding endangered species habitat and sensitive tundra. The system displays optional ice road routes and lists road length, construction time, cost and volume of water needed, Fig. 3.
Ice road planning can also be complicated due to a permitting process that can involve up to two dozen regulatory agency departments. The decision support system’s permitting assessment tool can be used by planners to view permit requirements for each regulatory agency. The tool also allows users to retrieve data from public and proprietary databases to prepare permits. An ice road plan developed using the system can be published on the Internet for easy review by stakeholders, facilitating the process of reaching consensus on the plan.
During ice road construction, the decision support system can also be used to track the amount of water that has been withdrawn as well as water quality, in order to determine the risk of insufficient water supply and the impact of water use on lake water quality.
TUNDRA TRAVEL MANAGEMENT
Most Arctic energy exploration and development activities take place in the middle of winter when the fragile tundra surface is most stable. Currently, regulatory agency personnel must visit field sites in order to measure snow and soil temperature conditions to determine when they are adequate to permit tundra travel. Geo-Watersheds is collaborating with UAF’s Geophysical Institute Permafrost Laboratory to model soil temperatures at test data stations in order to aid tundra travel managers. Using such a model to forecast conditions can help prevent delays in field verification of tundra conditions and minimize lost time during this critical window of operation for oil and gas producers. Research efforts also are continuing for snow distribution modeling, which should increase the accuracy of absolute snow measurements and wind-redistribution modeling methods. These methods are being developed primarily to aid in the forecast of short-term conditions, but can also be used by industry and regulatory agencies to predict changes in snow cover, soil temperature and water availability over time. Forecast models can save valuable time by improving the planning and logistical efforts involved in building and operating seasonal ice-road networks and maximizing the available ice road season.
An ice growth simulation tool is also being investigated for use during the ice road season. Early lake-ice formation is being characterized by a research team led by GW Scientific president and hydrologist Michael Lilly (arctic-transportation.org/atn.shtml), and end-of season aerial lake surveys are being carried out during spring snowmelt and lake recharge to provide data for the simulation effort. When changes in ice thickness can be tracked with analytical models, winter water use management can be improved to better predict ice thickness variability and to support adaptive water management permitting and management. More information is available on the ATN website.
OTHER PROJECTS
The US Department of Energy has similar research initiatives underway that focus on other Arctic energy resources. For example, DOE-sponsored projects have resulted in the drilling of the first Alaskan well targeting methane hydrates, which validated a hydrate exploration methodology developed jointly by the DOE, the US Geological Survey, BP, and other industry and academic partners. During the first quarter of 2012, the federal agency plans to implement the first field test of a novel technology for enhancing methane production from subsurface hydrates using carbon dioxide injection, with partner CononcoPhillips. Also underway are projects to develop better ways of producing light oil from frozen reservoirs and heavy oil from extensive, but as yet underdeveloped, North Slope deposits.
For more information on these projects, visit NETL’s Strategic Center for Natural Gas and Oil website (netl.doe.gov/technologies/oil-gas/index.html).
THE AUTHOR |
| SANDRA McSURDY is a Physical Scientist with the US Department of Energy’s National Energy Technology Laboratory in Pittsburgh, Pennsylvania, where she is a Project Manager for the DOE oil and gas program. She has spent the majority of her career researching environmental and energy issues, and has 21 years of experience in federal service, working with both the US Department of Energy and the former US Bureau of Mines. Ms. McSurdy earned a BS degree in chemistry from the University of Pittsburgh in 1990. / sandra.mcsurdy@netl.doe.gov |
CHANDRA NAUTIYAL is a Project Manager in the US Department of Energy’s domestic oil and gas resource assessment group in Houston, Texas, where he oversees research and demonstration projects. After receiving a master’s degree in earth and planetary science from the Massachusetts Institute of Technology in 1972, Mr. Nautiyal worked in the oil and gas industry for 17 years before joining the DOE in 1989. / chandra.nautiyal@netl.doe.gov |
- Advancing offshore decarbonization through electrification of FPSOs (March 2024)
- Subsea technology- Corrosion monitoring: From failure to success (February 2024)
- Prices and governmental policies combine to stymie Canadian upstream growth (February 2024)
- U.S. producing gas wells increase despite low prices (February 2024)
- U.S. drilling: More of the same expected (February 2024)
- U.S. oil and natural gas production hits record highs (February 2024)


