JONATHAN J. WYLDE, Clariant Oil Services UK Ltd.
Much research has focused on scale inhibitor applications at high temperatures, defined here as temperatures up to 180°C (356°F). However, there is scant information pertaining to scale inhibitor applications at ultra-high temperatures—greater than 180°C. Yet, many new field developments require scale inhibitor performance at these ultra-high temperatures as projects get deeper and hotter to maintain oil production. In addition, the development of unconventional projects, such as oil sands and heavy oil, requires large heating requirements for flow assurance.
A review of generic scale inhibitor chemistries reveals:
• Phosphate ester and polyphosphates can be used at temperatures up to 70°C.
• Phosphonate scale inhibitors tend to instability at 150°C.
• Low-molecular-weight polycarboxylate derivatives are used for high-temperature applications because of their thermal threshold up to 260°C.
• Acrylate/acrylamide scale inhibitors can be used at very high temperatures and have been used in geothermal applications up to 370°C (698°F).
This article discusses one heavy oil processing project in Western Canada. As shown in the plant flow diagram (Fig. 1), heavy oil arrived at the process plant and, after initial two-phase separation crude (SCUD), passed through a heat exchanger to a free-water knockout (FWKO) vessel and then to parallel heater treaters for final crude dehydration. Scale deposition was occurring in the FWKO and heater treaters, specifically on the fire tube heating elements within these vessels. These were 12-in.-diameter carbon steel tubes that had a mixture of ignited air and produced gas injected through them, creating a skin temperature of 450–500°C (752–932°F). This created a severe scaling potential where local supersaturation was increased due to evaporation and the kinetics of deposition were enhanced.
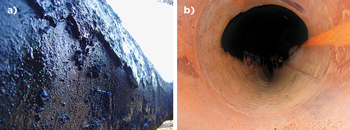
Scale composition varied, but calcite (CaCO3) and siderite (FeCO3) were the most dominant. Others included iron sulfide, iron oxide and halite. Iron sulfide was hexagonal pyrrhotite, which typically forms at very high temperatures. Halite formation also suggested high temperatures, as this would have caused precipitation directly via local evaporation of produced water. Figure 2a shows an example of the deposit buildup on the surfaces of the tubes after removal.
A further issue was tube integrity. Where scale precipitated, local hot spots led to fatigue and catastrophic collapse of the tubes. Figure 2b shows an example of a collapsed fire tube. Change-out of the fire tubes cost about $100,000, and prior to this study there were a total of 10 tube change-outs on the four heater treaters during 2009 (about one per month).
The incumbent treatment used 10 ppm of amino methylene phosphonic acid (AMPA) injected upstream of the FWKO. This was designed based on the highest bulk fluid temperature of 110°C (230°F). Protection was provided for the bulk fluids but not for the fire tubes. This study aimed to identify a new scale-management program targeting protection of the surface of the fire tubes.
LAB TECHNIQUES AND RESULTS
The products evaluated were selected after initial screening for methanol compatibility, an essential requirement, since any product had to be freeze-protected to –40°C to maintain pumpability in the field. The scale inhibitors were:
• Polyacrylate co-polymer (PACo)
• Polymaleic acid co-polymer (PMACo)
• Phosphinocarboxylic acid (PPCA)
• Phosphinocarboxylic acid salt (PPCAS)
• Phosphone carboxylic acid co-polymer (PCACo)
• Polyvinyl sulfonate (PVS)
• 2-Phosphonobutane-1,2,4-tricarboxylic acid (PBTC)
• Acetodiphosphonic acid (ADPA).
.gif) |
|
Fig. 1. Schematic plant flow diagram.
|
|
 |
|
Fig. 2. a) Scale buildup on the fire tube. b) Interior fire tube collapse after a hotspot caused metal fatigue.
|
|
The scale program optimization significantly reduced the mass of scale deposited on the coupons over time. Interestingly, the corrosion rate on the coupons also increased with time due to loss of the protective scale coating.
Four types of tests were performed:
1. Scale precipitation modeling was used, starting at the worst-case bulk fluid temperatures and increasing to the limit of the model in order to see the effect on the scaling tendency.
2. Dynamic scale loop testing (DSL) was performed at bulk fluid temperatures and then in increasing temperature steps. This determined each chemistry’s minimum inhibitor concentrations (MIC) for prevention of scale deposition under dynamic conditions.
3. Differential scanning calorimetry (DSC) was used to measure the thermal stability of the scale inhibitor chemistries. This test closed the gap between the skin temperature of the fire tubes and the maximum working temperature of the DSL equipment.
4. Anoxic static jar tests were then performed on the most successful products from previous testing to determine their efficacy for FeCO3 inhibition.
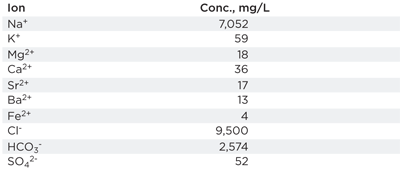
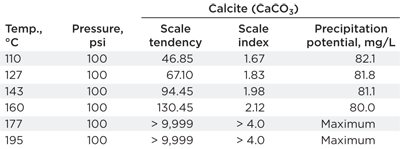
Modeling results. Table 1 shows the water chemistry composition used throughout testing (pH was 7.4), and Table 2 shows the results of the scale modeling. Modeling could not occur above 195°C (383°F) due to a lack of thermodynamic data. It can be concluded that, as temperature increased, the kinetics of precipitation increased exponentially, while the precipitation potential decreased as the solubility of CaCO3 increased with temperature.
At 450°C, water evaporation will be intense but cannot be accounted for by the model. It is likely that this phenomenon would increase scaling tendency and scale index; therefore, the model data is a least severe case.
| TABLE1. Produced water composition used throughout the study |
 |
| TABLE 2. Modeling calcite in the heater treater brine |
 |
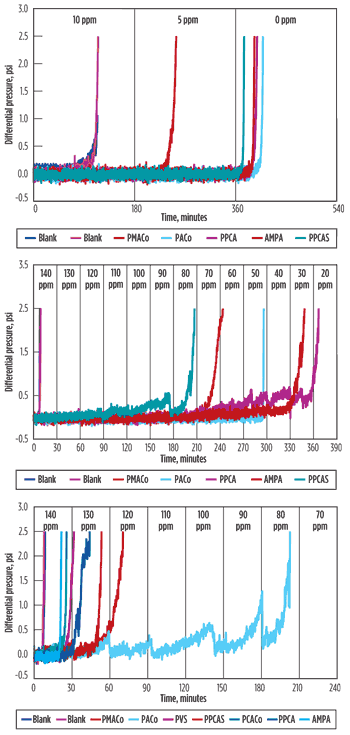
DSL testing. This industry-standard test measured scale formation and inhibition under dynamic flowing conditions. Samples were evaluated at three temperatures—110°C, 150°C and 177°C. Repeatable scaling blanks of 90 min. were obtained for 110°C and less than 10 min. for the 150°C and 177°C tests. Figure 3 shows test results.
At 110°C, all products showed better than 10-ppm MIC—the incumbent AMPA results confirm that protection could be provided to bulk scaling at 10 ppm. At 150°C, product differentiation occurred, with the best results shown by PACo, AMPA and PPCA. It should be noted that the PACo product showed scale dispersency as well as inhibition. At 177°C, all products had an MIC of 140 ppm or greater. PACo showed repeatable dispersion properties, with PMACo being the next-best-performing product. PVS and PCACo were eliminated from further testing after poor performance.
 |
|
Fig. 3. DSL testing results.
|
|
DSC testing. All samples were stable to at least the temperature at which the rupture discs blew (2,200 psi)—a safety feature of the device. Therefore, the results were inconclusive in terms of stability up to the operating skin temperature. However, some results did come close, so the DSC data was useful as a relative guide for thermal stability.
It is well understood that very few molecules are stable up to 450°C for an extended period of time. There are reports showing that polymers undergo degradations either in solid state or solution, dependent on exposure time, brine composition, pH and oxygen level. Degradation mechanisms include backbone scission and functional group degradation by hydrolysis and free radical attack. It is hypothesized that for PACo (2,000 daltons), molecular scission at high temperature occurred in the tests, resulting in an increased scale inhibitor efficacy. In this case acrylic and other co-polymeric components provided better inhibition and the dispersion effect seen in the DSL testing.
Anoxic jar testing. This focused on siderite scale inhibition due to the observed co-precipitation with calcite scale and the well-reported effect that many scale inhibitors are poisoned or ineffective against this form of scale. Oxygen was removed from the tests using nitrogen-sparged brine and cationic and anionic brines mixed in the presence of scale inhibitor. Sub-samples were taken over time to determine the scale inhibitor efficacy at 50–75°C.
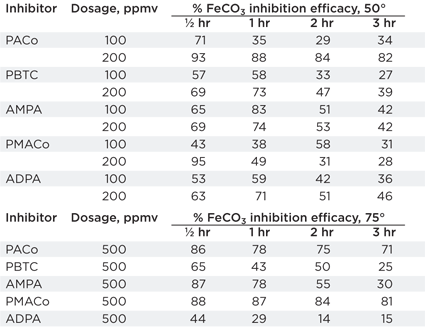
The results, summarized in Table 3, suggest that at 100-ppm dosage none of the inhibitors were able to totally prevent siderite scale at 50°C. Precipitation of gray-green siderite appeared very soon after mixing. At 200 ppm, PACo could delay scale precipitation for more than 1 hr while PMACo could delay precipitation for more than 30 min.; no other inhibitors prevented scale precipitation. At 75°C, the results showed that at 500 ppm, both PACo and PMACo could inhibit siderite for 3 hr with no other inhibitors; lower dose rates did not show any inhibition efficacy.
| TABLE 3. Anoxic jar test results |
 |
 |
|
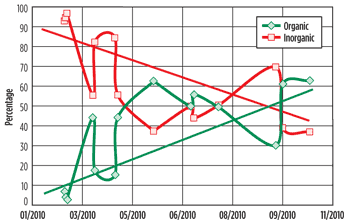
Fig. 4. Changes over time in the relative abundance of the organic and inorganic phases in the solid samples removed from the plant.
|
|
FIELD APPLICATION
Replacement of the incumbent 10 ppm of AMPA occurred with 100 ppm of PACo along with optimization of the injection points. Initially, injection was only occurring upstream of the FWKO, and additional injection was instigated just upstream of each heater treater—about 200 L upstream of the FKWO and 25 L per day upstream of each heater treater.
Additional monitoring was also implemented, including water sampling, scale coupon analysis and deposit analysis.
Solid deposit analysis. The analysis performed on each sample typically included weight loss analysis to determine the relative mass of water, volatiles, and organic and inorganic phases, determined by stepwise heating. Energy dispersive X-ray (EDX) and X-ray diffraction (XRD) analyses were used to quantify the elemental and mineral composition, and Fourier transform infrared spectroscopy (FTIR) analysis was used to determine the organic phase composition.
.gif) |
|
Fig. 5. Development of the relative abundance of carbonate and non-carbonate minerals in the solid samples removed from the plant.
|
|
 |
|
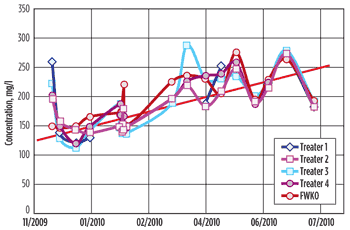
Fig. 6. EOR polymer over time in the process battery.
|
|
.gif) |
|
Fig. 7. Treater 3 daily tube skin temperature.
|
|
.gif) |
|
Fig. 8. Treater 4 daily tube skin temperature.
|
|
There is a general trend of increasing organic and decreasing inorganic phase over time, Fig. 4. The low organic content of the early samples was in the infancy of the scale inhibition program before optimization. Relative organic content increased sharply from 10% to 60% and settled at this level after optimization. The increase in organic content has been attributed to the efficacy of the scale inhibition program as well as the increased presence of enhanced oil recovery (EOR) polymer in the samples. The inorganic phase steadily decreases from an initial 95% of the total makeup to the current 40% relative abundance, due to better scale control.
Content analyses. Figure 5 plots the relative abundance of carbonate minerals and all other types—minerals that cannot be inhibited such as silica and iron oxides—against time. The carbonate mineral content decreases with time, suggesting once again the increasing efficacy of the scale inhibitor program.
FTIR analysis was performed on various solvent extractions of the organic phase. A water extraction very clearly showed the presence of high concentrations of EOR polymer. The sample not only had a high water solubility but also strong peaks corresponding to acrylamide and cellulose, which are derived from EOR polymer and associated surfactant.
Scale coupon analysis. The monthly coupon analysis provided considerable evidence on performance of the scale control program. First, weight gain was partly due to silica from the reservoir rather than scale formation. The scale program optimization significantly reduced the mass of scale deposited on the coupons over time. Interestingly, the corrosion rate on the coupons also increased with time due to loss of the protective scale coating. One particular coupon showed no scale deposition at all, and it was noted that during this time there was a turnaround on the FWKO into which the coupon was inserted. Subsequently, the FWKO was operated at much lower temperature than normal, resulting in a lower scaling tendency.
Finally, after scale inhibitor optimization, siderite became the dominant form of scale instead of calcite. Unfortunately, the scale inhibitor pumps struggled to deliver 200 ppm of PACo to the plant for extended periods of time, but control of the calcite scale made a significant difference in the frequency of fire tube change-outs.
Process trend analysis. The most revealing plots (Figs. 6–8) show the interaction between EOR polymer breakthrough, increased skin temperature and shorter tube lifetimes. Figure 6 shows the increase of EOR polymer breakthrough entering the process battery. Since November 2009, polymer concentration had increased from 150 mg/L to 250 mg/L.
Figures 7 and 8 show the skin temperature of Treater 3 and Treater 4, respectively. A direct relationship between the rate of fire tube temperature increase and polymer concentration can be discerned. For many months, no change-outs of the tubes occurred on either Treater 3 or 4. At the beginning of 2010, the tube lifetime decreased dramatically as the average skin temperature increased. (Higher skin temperatures were required to maintain the same bulk fluid temperature in the treaters.)
It is likely that, with the increased polymer breakthrough, a skin of polymer was deposited quickly on the fresh fire tube surface, raising skin temperatures. This caused a higher supersaturation of scaling ions and a large increase in scale severity. Several strategies were employed without success to control EOR polymer, including hypochlorite injection, organic solvents and dispersants.
CONCLUSION
At 110°C, tests confirmed that 10 ppm of AMPA was sufficient to inhibit calcite scale. With higher temperatures approaching the skin temperature of the fire tubes, this basic treatment was inadequate. PMACo and PACo showed the best scale inhibition against calcite at the highest temperature tested. None of the chemicals tested by DSC showed thermal decomposition before the upper pressure limits of the apparatus were exceeded. The static anoxic jar tests showed that 200 ppm of PACo was the most effective treatment.
Under the new scale management program including 100 ppm of PACo, the fire tube solids deposits have shown less inorganic scale. The inorganic content also contained less carbonate scale and more evaporate and siliceous material. The major organic component was shown to originate from the EOR polymer injection. This was supported by process trends, which showed a direct correlation between the concentration of EOR polymer breakthrough and the failure frequency of the fire tubes. 
|
THE AUTHORS
|
 JONATHAN WYLDE is the UK Business Manager for Clariant Oil Services in Aberdeen. He joined Clariant in 2002, initially working in the scale team of the R&D Center in Aberdeen, UK. Over the next four years, he managed the production chemistry on several major North Sea assets. Dr. Wylde earned a BSc with honors in geology and a PhD at the University of Bristol in the UK. JONATHAN WYLDE is the UK Business Manager for Clariant Oil Services in Aberdeen. He joined Clariant in 2002, initially working in the scale team of the R&D Center in Aberdeen, UK. Over the next four years, he managed the production chemistry on several major North Sea assets. Dr. Wylde earned a BSc with honors in geology and a PhD at the University of Bristol in the UK. |
| |
| |
|

.gif)


.gif)

.gif)
.gif)
 JONATHAN WYLDE is the UK Business Manager for Clariant Oil Services in Aberdeen. He joined Clariant in 2002, initially working in the scale team of the R&D Center in Aberdeen, UK. Over the next four years, he managed the production chemistry on several major North Sea assets. Dr. Wylde earned a BSc with honors in geology and a PhD at the University of Bristol in the UK.
