Improved reserve calculations, flood performance and production predictions enhance oil recovery operations from existing resources.
Wil Culham and Essam Sharaf, Denbury Resources; Richard Chambers
and Jeffrey Yarus, Landmark Software & Services
As the global challenge to find, develop and produce new oil and gas resources continues, the upstream industry’s ability to boost recovery from existing resources has become increasingly essential. In an effort to more efficiently develop these resources, several companies have chosen to specialize in enhanced oil recovery (EOR) operations. Denbury Resources, the largest oil and natural gas operator in Mississippi and Montana, specializes in tertiary EOR using carbon dioxide (CO2 ) flooding in mature onshore US fields. With a natural CO2 source at Jackson Dome in Mississippi and extensive CO2 operations in the Gulf Coast region, the company has recorded an approximate 17% increase in the recovery of original oil in place beyond primary and secondary methods as a result of efficient CO2 flooding. Given these results, the company estimates that in the Gulf Coast region alone—Mississippi, Alabama, Louisiana and southeast Texas—up to 7.5 billion bbl could be recovered from old fields by this method, assuming adequate supplies of CO2.
Despite the tremendous recovery potential, managing a complex CO2 recovery operation presents a unique set of technical challenges. In order to determine how to design, predict and operate an optimal CO2 flood, the company performs numerical simulations on high-resolution geocellular models that capture the depositional facies architecture with considerable precision. Without properly characterizing the geometry of discrete rock bodies at a sufficiently fine scale, it may be difficult or impossible to correctly model and distribute associated petrophysical properties, which control fluid flow, sweep efficiency and, ultimately, long-term production. Thermodynamically, a CO2 flood represents an extremely complex fluid system in which dense gas displaces oil and often becomes miscible. A substantial amount of gravity segregation occurs as well due to the differences in fluid density and mobility. Frequently, 1- or 2-ft gravity-induced tongues of CO2 can extend well beyond the main CO2 front in a reservoir under tertiary recovery. Additionally, thin, discontinuous, nonpermeable shales and cemented zones can act as permeability baffles, altering and diverting fluid movement. In order to understand these potential conditions, the company typically runs full compositional simulations with as many as a dozen components on models with vertical grid layers as thin as 1 ft. To ensure a high level of detail, no upscaling or coarsening of the high-resolution reservoir model is performed.
In the past, Denbury outsourced geocellular model building to experienced consultants who used a variety of modeling packages on the market. As its CO2 EOR business grew, the company decided to identify the appropriate reservoir modeling technology for its particular needs and bring this capability in house. The ideal solution would provide a geologically intuitive, graphical user interface that could streamline complex facies and petrophysical modeling workflows; incorporate advanced geostatistical algorithms that accurately capture the requisite detail; and integrate smoothly with the company’s reservoir simulator. Denbury hired a reservoir modeling specialist and is actively evaluating new commercial modeling software using data from its CO2 EOR operations in diverse onshore fields.
NEW MODELING METHODS
The company currently uses a variety of new reservoir modeling tools and techniques that support its specific reservoir characterization, modeling and simulation requirements. The systems focus primarily on methods that enhance facies modeling—following a typical workflow sequence—from project planning and grid creation through numerical simulation.
Model design and workflow management. While all software packages include some type of workflow manager, many packages require users to follow a predetermined sequence—some from beginning to end, others having steps that can be skipped if desired, but not necessarily modified. When designing its in-house reservoir modeling system, Denbury preferred process management tools that would let users build and drive their own workflows. This would allow expert reservoir modelers to quickly outline a best-practice workflow specific to the organization, project or problem at hand, and create a detailed and repeatable, yet flexible, workflow diagram, Fig. 1.
 |
|
Fig. 1. New project design and management tools enable modelers to capture workflows specific to a company, project or reservoir.
|
|
The new system was therefore designed such that, for example, the company can capture custom workflows focused specifically on modeling and simulation for CO2 flood management in, say, fluvial-deltaic reservoirs of the US Gulf Coast, or the Rocky Mountains. Relevant images, notes and comments, technical papers and other supporting documents can be added to make the entire workflow self-explanatory. Detailed project designs by modeling specialists enable novice users to navigate a complex workflow easily, without prior experience or extensive training. Additionally, each task in the workflow diagram can be made dynamic, directly activating the appropriate software module with a click of a button. At the completion of a user-driven workflow, modelers can automatically write out every step along with selected images to a PowerPoint presentation, which saves valuable cycle time and is useful for reporting and knowledge management.
Defining lithofacies and coarsening well data. High-resolution modeling of lithofacies and reservoir properties begins by creating a properly sealed structural framework, as well as accessing and integrating relevant data from cores, well logs and seismic, if available. Typically, considerable well control data is available. To obtain reliable facies and petrophysical data, an extensive core sampling program is undertaken. Geologists describe distinct facies in the cores; standard porosity and permeability measurements are taken; and special core analyses generate more precise permeabilities, capillary pressures and other critical data, facies by facies.
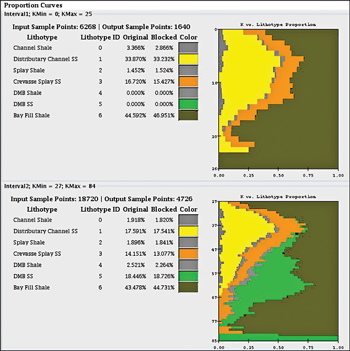
In some fields, micrologs have accurately identified very thin, impermeable shale layers. To build the stratigraphic model or 3D geocellular grid, the company typically creates vertical layers as thin as 1–2 ft. Following thorough data analysis and quality control, the next step in modeling rock geometry and distribution is to define the facies present in each interval, assign them to common lithotypes, and block—or coarsen—input well data to match the resolution of the grid. For CO2 flood applications, it is essential for well blocking to preserve critical heterogeneities. To do so, detailed statistics describing the proportion—or percentage—of each lithotype in the original data can be compared with the proportion calculated from the blocked data—interval by interval. Vivid graphical displays supplement statistical tables, enabling users to instantly validate the quality of their work, Fig. 2. If the user discovers that coarsening the input data has inadvertently eliminated essential geologic information, he or she can immediately adjust the vertical layering and reblock the wells before moving on.
 |
|
Fig. 2. New well blocking tools provide both detailed statistics and a graphic representation of facies proportions per interval.
|
|
Lithotype proportion mapping. Many of the fluvio-deltaic environments in which CO2 floods are conducted require the ability both to control vertical relationships between facies and to apply geologic trends between wells. After well blocking, conventional approaches would use the average global proportion of facies, which implicitly assumes that facies proportions are the same everywhere throughout the interval of interest. The company’s conceptual geologic model, however, suggests that sand and shale proportions typically vary across the reservoir. Based on this assumption, applying a constant lithotype proportion curve to the entire interval would be inaccurate. In order to impose a geologic trend on the data, users would typically have to laboriously build pseudo-wells or apply a very general trend map.
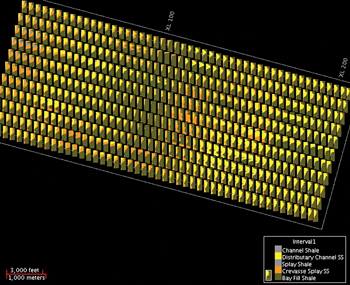
Instead, they can now use a new graphical method that creates individual lithotype proportion curves for each well in the field. In map view, users begin to see the variations in facies, well by well, even before creating the facies model. Dragging and dropping existing proportion curves creates pseudo-wells and invokes a trend, distributing these as needed to honor the conceptual model. Once pseudo-wells have been replicated and edited, the software interpolates between them and automatically fills every blank grid cell with the appropriate distribution of facies proportions, Fig. 3.
 |
|
Fig. 3. A new drag-and-drop lithotype proportion matrix enables modelers to create pseudo-wells and interpolate between them to invoke geologic trends.
|
|
Geologically driven facies modeling. Another challenge in reservoir modeling is how to instruct the software to correctly control relationships, both vertically and laterally, among facies. This requires a set of facies rules based on an understanding of the depositional environment. Few universities worldwide offer formal education in the geostatistical techniques used in most modeling applications to properly distribute facies and reservoir properties throughout an interval of interest.
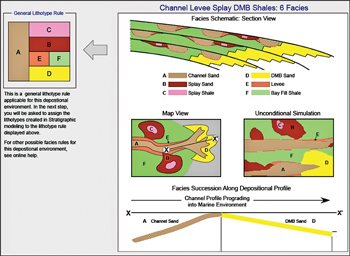
Most geologists, however, gain knowledge in graduate school of standard depositional systems, and naturally recognize what they look like on a map and cross-section. With new technology, they can use a library of familiar depositional system templates that visually illustrate relationships among facies and provide an associated lithotype “rule box” that specifies their mathematical relationships, Fig. 4. By identifying the correct depositional system and facies geometries, users can automatically input intelligent parameter defaults—based on the actual input data—to control a sophisticated facies simulation algorithm, which generates facies models and instant previews of the results.
 |
|
Fig. 4. Familiar depositional systems templates with facies rules allow geologists to control facies simulation algorithms without expert knowledge.
|
|
Another advantage of this geologically driven approach to facies modeling is that it further reduces the overall time and effort required to generate high-quality models. The company typically runs multiple, equally valid realizations of the facies model, and assesses them probabilistically to determine which is more likely.
Interfacing with numerical simulation. After selecting perhaps two or three realizations of the facies model, the company builds a petrophysical property model and generates multiple porosity/permeability realizations for each facies realization. Subsequently, reservoir property realizations are fed into the numerical simulator—without upscaling—to calculate original oil in place (OOIP). Results are compared with first-pass estimates of OOIP, such as volumetrics, to provide a detailed final screening of the porosity/permeability model prior to performing history matching, sensitivity studies of various flood patterns, and long-range production predictions.
It was considered a priority for the output from reservoir modeling to interface as seamlessly as possible with the company’s in-house reservoir simulation technology. If that transition were not handled smoothly, the geocellular model could impose undesirable restrictions on numerical modeling and computing resources. Ultimately, the performance of a CO2 flood depends on both the quality of the high-resolution geological model and dynamic reservoir simulation.
Accessing geostatistical algorithms. Throughout the modeling workflow described above, geostatistical algorithms have played a significant, albeit hidden, role. Not all facies simulation algorithms are equal. Object-based modeling, for example, is capable of defining very sophisticated facies relationships, but its use is limited. In the presence of numerous, closely spaced wells, the algorithm may fail to converge to a satisfactory solution. This is not a viable solution for most of the company’s EOR projects in old fields with extensive well control.
Sequential simulation algorithms are commonly used, though they cannot take advantage of modern parallel processing technology. Running many realizations of very large facies and property models can take much longer than necessary, even when parallel computing resources are readily available. One of the most promising geostatistical algorithms available is known as plurigaussian simulation, originally developed by the Center for Geostatistics at the Paris School of Mines and commercialized by its partner, Geovariances. This facies simulation algorithm produces sophisticated results similar to object models, but proves far more stable in the presence of many wells with tight spacing. In addition, it efficiently utilizes every processor available, rather than just one.
Although this method is not yet commonly used in the industry, it is both mature and proven, having been successfully applied for more than 15 years in petroleum reservoirs around the world. Recently, plurigaussian simulation has been coupled with the graphical depositional systems templates described above. As a result, geologists can use familiar qualitative information to drive advanced quantitative technology without requiring a deep understanding of geostatistical theory.
CASE STUDY
Among the CO2 EOR projects where Denbury first used some of these new modeling tools and techniques, including plurigaussian simulation, is a US onshore field originally developed in the 1950s. While the field had no seismic data, it did have about 150 wells, 120 of which had old log information from the 1940s and ’50s. An extensive core program was initiated to obtain detailed lithofacies descriptions and precise petrophysical measurements. The original operators also ran a series of micrologs, which accurately identified noncontinuous shale layers as thin as 1 ft, which represent significant baffles to vertical fluid flow.
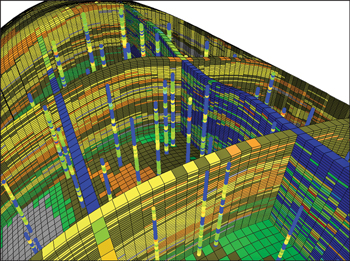
The field was already under CO2 flood when Denbury contracted with Halliburton’s Landmark product and service line to build a high-resolution geocellular model, Fig. 5. To preserve the detailed heterogeneity of the field’s two target intervals, the 3 million-cell model used 1-ft vertical layers. Dominant lithofacies included channel sands, crevasse splays, distributary mouth bars and associated shales.
 |
|
Fig. 5. High-resolution geocellular model of a US onshore field under CO2 flood, showing intermixed facies and porosity information.
|
|
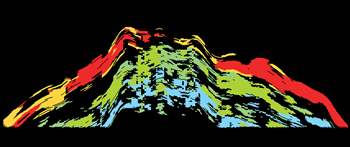
Six sand and six shale facies were identified. Roughly 50% of the model, in fact, was shale. About 10 realizations of the facies model were generated (Fig. 6) along with almost 20 porosity/permeability realizations. These were fed to Denbury’s reservoir simulator to calculate OOIP, which was compared with volumetric estimates to identify the best realization. Full field history matching on the resulting model is ongoing, based on 35 years of production history, which includes primary depletion and waterflooding. A full compositional simulation model with 11 components is being run, given the thermodynamic complexity of the CO2 flood. Subsets of the full field model have been used to examine single flood patterns and various combinations of patterns.
 |
|
Fig. 6. West–east cross-section of a facies model from the dynamic flow simulator, ready for history matching. Colors represent different facies; black is shale.
|
|
While the results of simulation may not alter existing flood patterns, they will certainly enhance both pattern and reservoir interpretation—providing better understanding of why some patterns perform better than others, and why certain wells are not in communication. This should enable the company to optimize pattern controls, determine CO2 utilization requirements over time, and support potential well planning and step-out drilling. Ultimately, the results of highly detailed reservoir modeling and dynamic simulation will be used to calculate reserves more accurately and predict production over the next 20 years with greater certainty.
CONCLUSION
While the need to build very high-resolution facies models varies from field to field, they are certainly appropriate wherever geology is complex and heterogeneity is high. As an experiment, Denbury created petrophysical property models in several fields based on both simple and more detailed facies models, ran them through the simulator and compared the OOIP with volumetrics. In several cases, results were significantly different.
In today’s oil and gas industry, it is possible to oversimplify geology without realizing it, run a dynamic simulator and assume that a reasonable answer has been obtained. In reality, most reservoirs, whether clastic or carbonate, are more complex than we initially imagine. Fine-scale facies modeling pays dividends not only for numerical simulation studies, but also for understanding and managing reservoirs in general. 
|
THE AUTHORS
|
|
W. E. (Wil) Culham is Simulation Manager/Technical Consultant with Denbury Resources Inc., providing technical support in EOR assessment, reservoir simulation and integrated reservoir description and characterization. Prior to Denbury, Dr. Culham spent 17 years as founder, President and CEO of Rega Inc. He also held technical and management positions for BP and Gulf Oil. Dr. Culham holds a PhD in petroleum engineering from The Pennsylvania State University.
|
|
|
| Essam Sharaf is Senior Geoscientist with Denbury Resources Inc., with responsibilities including reservoir description, reservoir modeling, sedimentology and basin analysis. He worked as a consultant geologist for BP in Egypt; as an assistant professor at the University of Mansoura, Egypt; and as a research associate at Florida International University. Dr. Sharaf holds a PhD from the University of Wisconsin–Madison. |
|
|
| Richard L. Chambers is Chief Product Architect with Landmark Software and Services, a Halliburton business line, where he provides technical guidance for the development of earth modeling software. Dr. Chambers has 34 years’ experience in quantitative data analysis and computer modeling in the geosciences. He received his PhD in geology from Michigan State University. |
|
| Jeffrey M. Yarus is Senior Product Manager for Earth Modeling with Landmark Software and Services, a Halliburton business line. Prior to joining Landmark, he and Dr. Chambers started Quantitative Geosciences LLP, a consulting firm specializing in reservoir characterization and geostatistics. Previously, he had been a technical manager and executive for GeoMath, a subsidiary of Beicip-Franlab, Smedvig Technologies (Roxar) and Knowledge Reservoir Inc. He obtained his PhD in geology from the University of South Carolina. |
|


