Mathematical model using machine learning boosts output offshore China
A “black box” simulation of several shallow-water oil wells producing to a single platform revealed that the field’s maximum production rate could be increased by 5%.
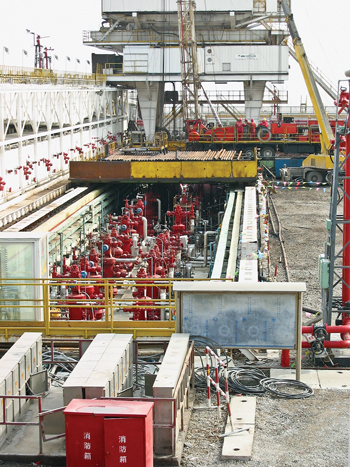
A “black box” simulation of several shallow-water oil wells producing to a single platform revealed that the field’s maximum production rate could be increased by 5%.Chaodong Tan and Jie Zhang, Yadan Petroleum Technology Co., Beijing; Patrick Bangert, Algorithmica Technologies GmbH, Bremen, Germany; and Bailiang Liu, PetroChina Dagang Oilfield Co., Tianjin, China In Dagang oil field, located in the Huanghua depression of China’s Bohai Basin, PetroChina operated five offshore wells with downhole pumps that produced to a single platform, and water injection from the platform was used to maintain reservoir pressure, Fig. 1. The pumps lifted a mixture of oil, water and gas, which were separated on the platform. Sand produced in this mixture caused abrasion to the pumps and other equipment, requiring relatively frequent replacement. Pump failures often occurred without warning, resulting in long delays before replacements could occur—for example, to procure required parts or bring expert personnel to the platform—and, thus, long periods during which the well was out of service.
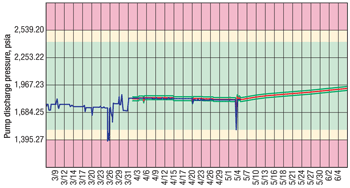
The operator determined that significant time savings could be realized if pump failures could be predicted several weeks in advance and, thus, planned for. To this end, a mathematical model of the pumping operation was created using automated machine-learning methods and historical data, without requiring any engineering changes to the platform. The resulting differential equations represent the process well enough to predict the status of the pumps up to four weeks in advance, allowing preventative maintenance to be performed. They also facilitate computation in real time of the set-points that should be changed to obtain the maximum production rate of the oil field as a whole at any given time, considering the numerous interdependencies and boundary conditions that exist. It is this latter capability that is the subject of this case study. Using the new modeling technique, it was determined that the development’s maximum production rate could be increased by about 5%. This production rate increase is available uniformly over time, effectively increasing the platform’s base output capability. THE PROBLEM Each pump can be influenced via two major control variables: choke diameter and pump frequency. At the platform in Dagang Field, these parameters were controlled manually by operators. Thus, the maximum possible output depended largely on the decisions of operators, defined by the knowledge and experience of the operators as well as the level of difficulty of any particular pump state. However, the employment of continuous and uniform knowledge and experience for the pump operation was not possible, as no one operator controlled the plant over the long term. Observation results showed oscillations of parameters in a rough 8-hr pattern, corresponding to operator shifts, which supports the argument that a fluctuation in the knowledge and experience of human operators may lead to a fluctuation in decision making and, thus, in operation of the platform. While some operators may be better than others, it is often not fully practical and/or possible to extract and structure the experience and knowledge of the best operators in such a fashion as to teach it to the others. Pumps in an oil field are not independent. Demanding a great load from one will cause the local pressure field to change, and will make less oil available for neighboring pumps. Obtaining the maximum production rate, therefore, requires careful balancing of the entire field. In addition, certain external factors also influence the pressure of the oil field, such as the tide. This high degree of complexity presents an overwhelming challenge to the human mind, resulting in suboptimal decisions. METHODOLOGY Sensor equipment installed in all important parts of the facility alerts the operator via the control system about the current state of the facility—in this case, the offshore oilfield development. The numerical values of all sensors can be arranged into a vector. Assuming a total of N measurements on and around the facility, the state of the facility at time t can be represented by an N-dimensional vector, x(t). Via the data historian, a set of such vectors can be obtained for past times. Ordered with respect to time, this set is called the time-series H = (x(−h), x(1−h), x(2−h), … , x(0)), where time t = 0 is the current moment and time t = −h is the most distant moment in the past that we wish to look at. Thus the time-series H is effectively a matrix with h + 1 columns and N rows. This matrix contains all the decisions of the operators and all the reactions of the facility to these decisions. The knowledge and experience of the operators is thus plainly visible in the data. If the history is long and detailed enough, this information is all one needs to know about this facility in order to model it. Modeling a black box. In control theory, we assume that the process connecting input to output is unknown-—i.e., a “black box.” Control theory then aims to discover the relationship between input and output by performing experiments. If we send a particular signal in, then we observe another signal coming out. Given enough such data and some analysis, control theory provides tools for creating a set of differential equations that govern the behavior of the black box—i.e., a mathematical model. A crucial element is the time evolution of the process; i.e., an action at a certain time will have some effects immediately, some effects over a short term and other effects over the long term. This time dependency must be contained in the model for realistic results. The model does not allow us to understand the process inside the black box, but it does allow us to compute the output of the black box given a sample input. Using the results of optimization theory, we can reverse this process and compute the input needed to achieve a given desired output. Control theory is meant to be applied manually, but this is impractical for a process as complex as that of an offshore oilfield development. Therefore, it was suggested to use machine learning to develop the set of equations automatically.1 There are various techniques available to achieve this, such as neural networks.2 For this case study, the technique of recurrent neural networks was selected.3 While neural networks can tell the difference between a finite number of types of objects, recurrent neural networks can represent the evolution of those objects over time. The mathematical methods necessary to efficiently apply recurrent neural networks to large data sets from real industrial facilities were only invented in 2005, so it is only very recently that this type of modeling became possible. In contrast with human-engineered models, models that use machine learning can be produced within a very short time (usually days), are adaptive (i.e., they learn continuously as they experience more data), can change to match new situations, and can model the entire problem rather than a simplified version thereof. In the state vector that describes an industrial facility, there are three different types of measurements. Measurements that can be directly controlled by the operator, such as the amount of coal per hour being put into a particular mill, are called controllable, xc(t). Those that cannot be controlled at all by the operators, and that thus represent a state of the world outside the plant (e.g., external air temperature), are called uncontrollable, xu(t). A third type of measurement defines those that are indirectly controlled via the controllable measurements, such as vibration in the turbine. We call these semi-controllable, xs(t). Uncontrollable measurements provide boundary conditions for the problem, meaning that we really have a set of models depending on the boundary conditions. This poses no problem for machine learning; it is simply included in the model of the black box that is the facility under investigation. The only requirement is that the measurements that belong in each of the three groups must be clearly delineated. Once this is known, the learning may begin. What we obtain is a function f(xc(t); xu(t)) = xs(t), in which the controllable measurements are variables, the uncontrollable measurements are given parameters, and the semi-controllable measurements are functional outputs. The facility’s efficiency is, of course, among the semi-controllable outputs of the function. With this model and given a particular boundary condition xu(t), we may compute the reaction of the plant xs(t) to any particular operator decision xc(t). This is effectively a facility simulation. Such a system may be used for training and practice of the operators. More interestingly, we ask whether the function may be inverted—i.e., whether In particular, we are not necessarily interested in general inversion but rather in a very special form of inversion, namely optimization. Given particular boundary conditions, we wish to know what input variables lead to the optimal state of the facility, defined by some merit function g(xs(t); xu(t)). The simplest such merit function is a single measurement point, but complex merit functions can be formulated, such as for plant efficiency, and can even take into account market prices and other business features. The question, then, becomes: What is xc(t) such that g(xs(t); xu(t)) achieves a global maximum where the relationship between the variable vector and the merit function is contained in the inverted model f−1(xs(t); xu(t)) = xc(t)? As the functions are only known numerically and they are highly non-linear and time-dependent, this is a complicated optimization problem requiring state-of-the-art treatment. Given that the system under question (the offshore wells producing to the platform) is governed by physical laws that do not change over the history and that h is sufficiently large, then it follows that the function f exists: f(H) = H ∏ x(1), where the symbol ∏ indicates concatenation of vector x(1) to the right side of matrix H. This function may be applied recursively so that fn(H) = x(n). In this way, we may compute the nth state of the system—i.e., the state that the system will have in n time steps from the current time. Theoretical limitations. Of course, no measurements made in the real world are ever completely precise. There are random and structured errors associated with the measurement process, and physical sensors drift with age and environmental effects. Thus, every x(t) has an inherent measurement-induced uncertainty ∆x(t) attached to it. This means that the true value of the state vector is somewhere in the range x(t) ± ∆x(t). All likely contributors to error must be taken into account to determine a reasonable ∆x(t). A further limitation is the length of the history. The history must contain a record of the variations that are to be expected in the future so that these variations, correlations and other structures may be included in the model. It is thus desirable that the history be as long as possible, and that the time unit governing the frequency of measurements be as small as possible. Together, these two factors define a history that contains the maximum available knowledge about the system. APPLICATION Initially, the machine-learning algorithm was provided with no data. Then the points measured were presented to the algorithm one by one, starting with the first measured point x(−h). Slowly, the model learned more and more about the system, and the quality of its representation improved. Once even the last measured point x(0) was presented to the algorithm, it was found that the model correctly represents the system, Fig. 2.
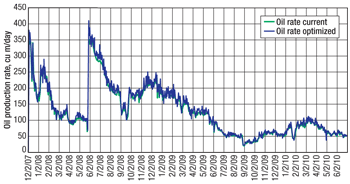
The model was then inverted for optimization of production rate. The computation was done for the entire history available, 2.5 years, and it was found that the optimal point deviated from the actually achieved points by about 5% in absolute terms, Fig. 3.
CONCLUSION The main benefits of the current approach are that it 1) processes all measured parameters from the platform in real time, 2) encompasses all interactions between these parameters and their time evolution, 3) provides a uniform and sustainable operational strategy 24 hours a day, and 4) achieves the optimal operational point, thus smoothing out variations in human operations. Effectively, the model represents a virtual oil platform that acts identically to the real one. The virtual platform can thus act as a proxy on which a variety of strategies can be dry run, which can then be applied to the real platform only if they are good. The novelty in the case study above is that it was demonstrated on a real platform that it is possible to generate a representative and correct model based on machine learning of historical process data. This model is more accurate, all-encompassing, detailed, robust and applicable to the real platform than any human-engineered model could be. The increase of about 5% in production rate is significant in that it will allow the operator to extract more oil in the same amount of time as before and thus represents an economically competitive advantage. LITERATURE CITED 1 Bishop, C. M., Pattern Recognition and Machine Learning, Springer, Heidelberg, Germany, 2006.
|
|||||||||||||||||||||||||||
- Advancing offshore decarbonization through electrification of FPSOs (March 2024)
- What's new in production (February 2024)
- Subsea technology- Corrosion monitoring: From failure to success (February 2024)
- U.S. operators reduce activity as crude prices plunge (February 2024)
- U.S. producing gas wells increase despite low prices (February 2024)
- U.S. oil and natural gas production hits record highs (February 2024)


