While rig utilization rates continue to climb and newbuilds enter the North American market, other census numbers yield mixed results.
Steve Berkman and Tory Stokes, NOV Downhole
The total available rig count was effectively a wash for 2010 despite a dynamic US rig fleet, according to NOV Downhole’s 57th annual rig census (previously known as the ReedHycalog rig census). Newly manufactured and refurbished units were offset by many retiring and dormant rigs over the past year, bringing an end to the last few years’ overall swell in US rigs.
Commodity prices have made a comeback since last year’s dismal showing, causing activity to rebound somewhat and resulting in a tightening of US fleet utilization in 2010. Canada experienced a sizeable drop in availability this year, but did show a considerable jump in active rigs. The global offshore mobile fleet numbers were the reverse, however, with available rigs climbing while activity remained stagnant.
In order to compile a complete picture of the worldwide rig market, NOV Downhole works closely with several companies to pull together industry statistics. RigData and ODS-Petrodata provide detailed information regarding the US land and global offshore mobile rig fleets. The Canadian figures are provided by NOV Downhole personnel in Calgary along with Nickle’s Energy Group. Summarized data regarding the international land rig fleet are collected by NOV Downhole regional managers and submitted annually for this article.
|
|
|
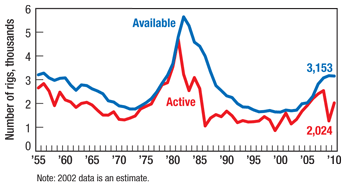
Fig. 1. US available vs. active rigs, 1955–2010.
|
|
CENSUS HIGHLIGHTS
Key statistics from the 2010 census include the following:
• The US rig fleet had a net drop of just 16 rigs this year, declining less than 1%. This net decrease is the result of 243 rig additions and 259 rig deletions, Fig. 1.
• A number of US rigs, 212 units, were retired from active service over the past year.
• Newly manufactured rigs, at 131 units, were the largest addition to the US fleet again in 2010.
• The total number of US rigs meeting the census definition of “active” increased to 2,024, up 60%, from the 1,264 rigs in 2009.
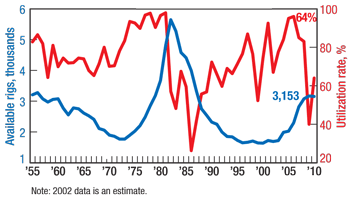
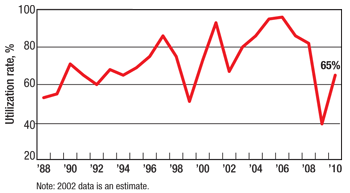
• US rig utilization rose significantly, up to 64% from 40% last year, Fig. 2.
• The number of US rig owners rose by four to 324.
• Drilling contractors continue to own 86% of all drilling rigs, with operators owning the remaining 14%.
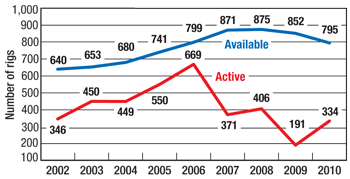
• The Canadian available rig fleet declined to 795 units, down from 852 last year.
• Canadian rig activity increased a dramatic 75%, with active rigs climbing to 334 versus 191 in 2009.
• Canadian utilization climbed to 42% over the past year after being just 22% in 2009.
• The global offshore mobile available fleet expanded by another 6% this year with a net gain of 40 available rigs, primarily due to newbuilds.
• Global offshore mobile activity was stable, with active rigs up a single unit to 572.
• Utilization for the global offshore mobile fleet was down to 77% from 88% previously.
• Most international rig fleets experienced increases in utilization, with the exception of Latin America.
|
|
|
Fig. 2. US available vs. active rigs, 1955–2010.
|
|
U.S. RIG ATTRITION CONTINUES TO INCREASE
Rigs are retired from active service when it is no longer profitable to operate the equipment or when newer units replace them. Units that have been destroyed in accidents are also removed from the census. Rigs can also leave the US market for more lucrative ones. All of these rigs are tracked in the annual census as reductions to the fleet. This year’s deletions numbered 259, about 19% higher than last year’s 218 units. Deletions were reported in three categories, Table 1:
• Rigs removed from service
• Rigs moved out of the country
• Destroyed rigs.
Rigs removed from service continue to be the largest category of deletions, jumping to 212 units this year, versus 164 in 2009. Census rules exclude rigs from the available count that have been stacked for a significant amount of time, require a large capital expenditure to be operable, or have been auctioned for parts or cannibalized to keep other rigs running. The US fleet has been experiencing a building boom for the last several years, which has diminished the demand for many of the older units. Since activity has picked up recently, there are many rigs leaving the fleet in order to be refurbished. Others are simply being stacked until economic conditions warrant their reactivation.
Rigs are tracked in the census each year as they move into and out of the country. In this year’s count, 45 rigs were noted as moving out of the US, a slight decrease from the 49 rigs that moved out last year. The destination of some of these rigs is known, and it appears that a large portion have relocated to Mexico. Rig movement into the US is covered below.
Just two rigs were counted as destroyed for the US in the 2010 census. Much has been published about the recent offshore disaster that affected one offshore unit. A land unit was also reported as damaged beyond repair during the time period since the last census was taken.
U.S. RIG ADDITIONS
Rig-building programs continue to turn out new units that increase the size of the US available fleet. Newbuilds have been the primary way owners have maintained their fleets over the past several years, although there are also refurbished and reactivated units that supplement their businesses as well. The census reports that the US fleet added 243 rigs overall during the past year, down 22% from the 311 units gained in 2009. These 243 rigs added did not completely offset the total reductions of 259 units. Fleet additions fall into one of four categories, Table 1:
| TABLE 1. Changes in the available US fleet |
 |
• Newly manufactured rigs
• Rigs brought back into service
• Rigs moved into the country
• Rigs assembled from parts.
The rapid fleet expansion of the past five years due to newly manufactured units is starting to slow. Newbuilds are still coming online at a brisk pace and remain the primary reason for expansion, but have dropped significantly in 2010. Another 131 units were built from scratch this year, down from 237 last year. The total number of newbuilds added over the past five years is now 1,157, indicating that 37% of the total US fleet is less than five years old. Of the 131 new units, 120 were land rigs, seven were floating and four were bottom supported.
The number of US rigs brought back into service jumped this year to 87 units. This is more than double the 36 units that were reactivated in the 2009 census. Note that each of these reactivations had been counted in previous census tabulations, but had been subsequently removed due to becoming inactive or inoperable. These rigs were refurbished or reactivated over the past year and have now reentered the available fleet. Apparently, the increase in activity, coupled with the slowdown of newly manufactured units, has prompted companies to reactivate rigs in response to current work or future prospects.
Just 16 rigs were moved into the country over the past year, versus 30 in 2009. As is often the case, many of these rigs came from Mexico. Considering that 45 rigs moved out of the US for the 2010 census, while 16 moved in, there was a net decline of 29 units resulting from rig moves. It has been a tendency over the past six years that more rigs are leaving the US than are entering. Furthermore, if offshore permitting remains slow due to new regulations following the end of the deepwater moratorium, this trend is expected to continue.
Just nine rigs assembled from parts were added to the fleet this year. This is similar to the eight units last year. In recent years, many more rigs have been newly constructed in total or refurbished than put together from cannibalized units.
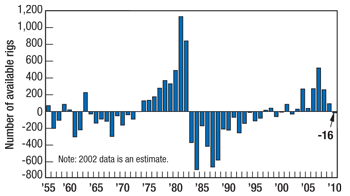
Total rig additions numbered 243, while deletions totaled 259. The net change in the fleet over the past year was just a 16-unit decrease, showing overall fleet stability and a decline of less than 1%, Fig. 3.
|
|
|
Fig. 3. US change in available rigs, 1955–2010.
|
|
CANADIAN FLEET CONTINUES TO SHRINK
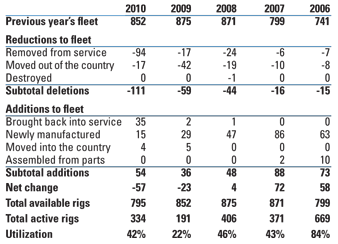
Beginning with the 2009 census, market conditions caused the Canadian fleet to contract in size. A few reactivated and new units do continue to come online in Canada. However, despite increasing demand this year, a significant number of rigs are being removed from service after sitting idle for several years. The overall count of available Canadian rigs fell by 57 this year. Using data supplied by Nickle’s Energy Group and NOV Downhole personnel, we determined that newly manufactured units totaled about half of last year’s 29. Newbuilds are no longer the primary way rigs are added to the fleet. Rigs brought back into service tallied 35 units this year, significantly more than the number seen for the last several years. There were also four units that moved into the country. No rigs were recognized as assembled from parts. Total rig additions came to 54 units overall for Canada.
As mentioned previously, the foremost cause of the decline in the Canadian fleet this year was due to rigs removed from service. A considerable number, 94 units, were taken out of the census based on information gleaned regarding their operational or stacked status. This is more than double the 42 that were retired last year. Furthermore, 17 rigs left Canada over the past year to relocate to other countries. This compares to 42 that moved out last year. Fortunately, no Canadian units were reported as destroyed over the past year. Deletions numbered in total 111 units. Overall, Canada saw a decline of 57 units and an available count of 795, a drop of 7%, Table 2.
| TABLE 2. Changes to the Canadian rig fleet |
 |
GLOBAL OFFSHORE MOBILE FLEET CONTINUES TO EXPAND
The global offshore mobile rig fleet continued to experience growth this year, predominantly due to newly manufactured units. Forty rigs counted as brand new were added to the fleet for 2010. This is similar to the 43 new units included in the 2009 census. Besides these newbuilds, six offshore rigs were also reactivated this year. ODS-Petrodata, which assisted in pulling together census figures, estimates that about 66 brand new units are scheduled for worldwide delivery by the time the 2011 census rolls around next spring, although some inevitably will not meet that timetable. No new offshore rigs entering the fleet this year were described as assembled from parts.
Overall reductions to the global offshore mobile fleet numbered just six this year, a decline from the 14 removed from the census in 2009. Four units were taken out of the census due to being damaged beyond repair, while two were removed from service due to age or inactivity, Table 3. If a rig has not worked for more than five years and does not have upcoming contracts, it is generally not classified as available. This is the case since it would usually take a significant capital expenditure in order to put the rig back into working condition. Therefore, these drilling units cannot be counted as available by census rules, although a few may later be reactivated if market conditions warrant it. Note that since platform and inland barges are particularly difficult to track, they are not included.
| TABLE 3. Changes to the global offshore mobile fleet |
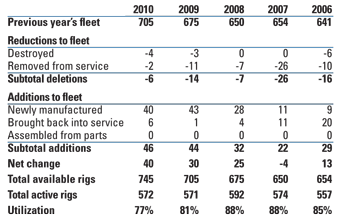 |
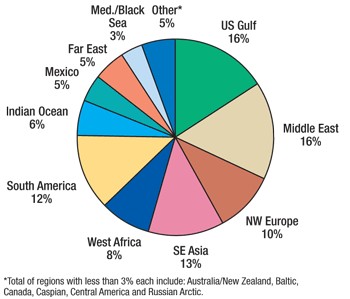
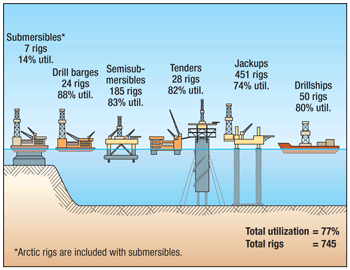
Overall, the available count for global offshore mobile units stands at 745 units, a net increase of 40 rigs, a 6% jump. The fleet is widely distributed with the US and Middle East dominating, followed by Southeast Asia and South America, Fig. 4. The makeup of the fleet by rig type is shown in Fig. 5.
|
|
|
Fig. 4. Global offshore mobile fleet by region in 2010.
|
|
|
|
|
Fig. 5. Makeup of the global offshore mobile fleet in 2010.
|
|
U.S. ACTIVITY REBOUNDS
Dire market conditions due to the US recession caused the rig count to plummet in 2009, marking the second-steepest decline in the 57-year history of the census. Now, a year later, oil and gas prices have recovered somewhat and rigs have been going back to work. The active rig count jumped 60% for 2010 to 2,024 after being at 1,264 a year ago. Although not yet back to 2008 levels, major improvement is being made.
There are several reported active rig counts in the industry, and the methodology used to count active rigs for the NOV Downhole census is different from most. This census counts a rig as active if it has “turned to the right” at any time during a defined 45-day period. For 2010, this was between May 5 and June 18. Therefore, since a longer time period is used to monitor activity, the NOV Downhole statistic will always be higher than other reported weekly rig counts.
Rig utilization, the ratio of active to available rigs, is an often-quoted industry statistic and can indicate the health of the industry. Last year’s depressed activity level pushed US utilization down to just 40%, a level not seen since the late 1980s. This year’s semi-recovery brought utilization up to 64%—not a high number, but a significant improvement.
There were 1,129 available US rigs that were not working during the 2010 census period. Some of these idle rigs may have been under contract and waiting for the start of their projects or being moved to their next drilling locations. Rigs stacked less than one year numbered 345; one to two years, 722; and two to three years, 62. Aging rules of the census state that any rig stacked for longer than three years will be removed from the available fleet. However, most rigs tend to be decommissioned before then. Rigs that fall into this category and are removed from the fleet because they are no longer economically viable fall into the group removed from service.
Full-year utilization, the percentage of available rigs that drilled sometime during the past year, gives a slightly different picture. Adding the 345 rigs stacked less than one year to the 2,024 active units in the census provides the number of rigs that drilled during the past year. This full-year utilization figure indicates that rig owners used 2,369 units, or 75% of available rigs over the past year. This statistic is considerably lower than usual and shows that there is still a lot of oversupply since rig demand is not yet close to what it was two years ago.
| TABLE 4. US regional census results |
 |
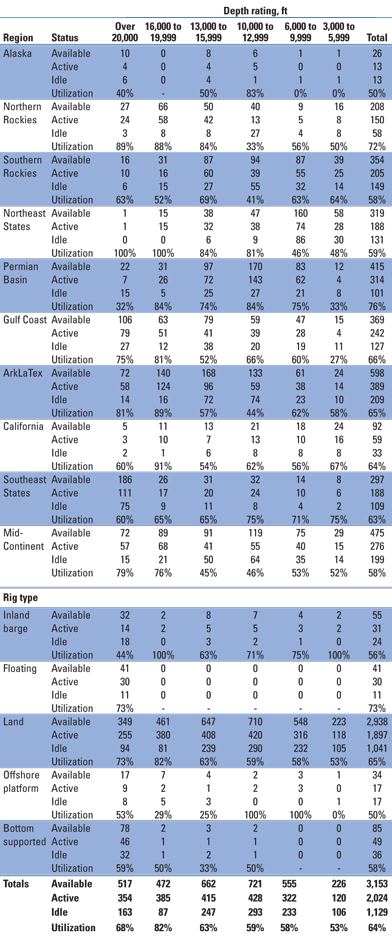
For 2010, every US region except for Alaska experienced a rise in rig activity. The regional breakdown, comparing this year’s numbers to last, is shown in Table 4. The ArkLaTex region continues to show the highest overall number of active rigs with 389, a 132-unit increase from the previous year. Utilization by region shows results consistent with activity levels, with all regions having increases except for Alaska.
| TABLE 5. US land rigs, number and utilization |
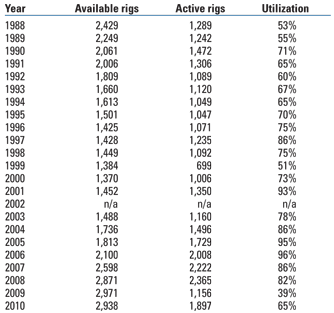 |
Examining US land and offshore rigs independently, gross utilization for land rigs was up by about a quarter to 65% from 39% in 2009, Table 5. The US marine fleet also showed some improvement this year, with offshore utilization climbing to 59% after being 55% last year. Demand does vary by rig type, with floating rigs remaining in greatest demand at 73% utilization. Rigs experiencing the lowest level of utilization are now the offshore platform units, at 50%. The total US rig fleet was also analyzed by depth capacity, revealing a bump in utilization for units in every depth range, Table 6.
| TABLE 6. US rig utilization by depth capacity |
 |
CANADIAN ACTIVITY BEGINS TO REBOUND
Canada experienced a considerable increase in rig activity for 2010. Although there have been several ups and downs since Canada was included in the census in 2005, last year’s activity was the lowest noted, with just 191 active rigs for the spring 45-day window. Market volatility continues, with the active count bouncing back somewhat to 334 rigs, an increase of 75%. With available rigs declining and active rigs increasing, Canadian utilization figures have improved for 2010, rising to 42% from a low of 22% last year, to reach essentially the level of 2007 and 2008, Fig. 6.
|
|
|
Fig. 6. Canada available vs. active rigs, 2002–2010.
|
|
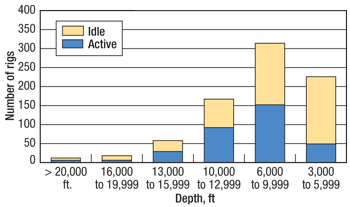
Regarding Canadian drilling capacity, almost 40% of Canada’s rigs lie in the 6,000–9,999-ft range. Fleet availability and activity by depth capacity show that utilization is now highest in the 10,000–12,999-ft range (55%) and lowest in the 3,000–5,999-ft range (22%), Fig. 7.
|
|
|
Fig. 7. Canadian rigs by depth capacity 2010.
|
|
GLOBAL LAND RIG UTILIZATION TIGHTENS
Utilization rates have been tracked for the past four years for the primary international regions. After a decline in 2009, most areas experienced utilization increases for 2010. The overall rate has risen to 88% from 84% in 2009, Table 7.
| TABLE 7. International utilization |
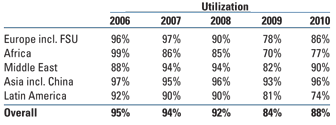 |
Regarding individual regions, Europe’s rise in utilization this year was mostly due to increases in FSU activity. Africa, having had the lowest rate at 70% last year, has shown some recovery and is now at 77%. Libya and Nigeria, which battle with security issues, still have a number of idle rigs and kept this percentage from rising further. Latin America was the only region reporting a utilization drop for 2010. The source of this weakness was Mexico, where Pemex activity has slowed significantly. Note that some international areas have large numbers of available rigs, but these units are typically of older technology and may not be universally mobile or marketable. Also, in some cases, available rigs are actually under contract awaiting a project start, and are realistically unavailable for other work.
GLOBAL OFFSHORE ACTIVITY FLAT
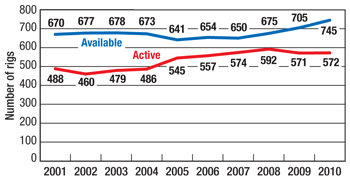
The global offshore mobile fleet was essentially unchanged during the census window for 2010. Total working rigs numbered 572 during the spring 45-day active period (May 5 to June 18), up just one rig from 2009. This count includes all offshore mobile units, with the exception of platform and inland barge rigs. With rig supply increasing while rig demand remains stagnant, utilization dropped to 77% from 88%, Fig. 8.
|
|
|
Fig. 8. Global offshore mobile available vs. active rigs, 2001–2010.
|
|
OTHER U.S. INDUSTRY TRENDS
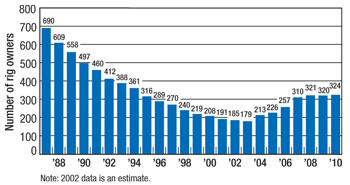
Strong commodity prices in recent years have prompted new drilling companies to form. Since 2004, the net number of new businesses entering the US census has typically increased annually, with the exception of 2009, when the overall total dropped by just one. This year, after all the new companies were added and those ceasing operations were deleted, the total number rose by four to 324, Fig. 9.
|
|
|
Fig. 9. US rig owners, 1987–2010.
|
|
Census statistics also track the ownership of rigs by the type of owner. There have always been many more rigs in the possession of drilling contractors as opposed to operators, although the number of operator-owned rigs has generally risen. This year, however, no change has occurred and operators continue to own about 14% of the overall US fleet, or 451 rigs. Drilling contractors own the remaining 86%, or 2,702 rigs.
Another way to get a sense of US rig ownership is by examining the fleet sizes of companies and looking at the trend over the years. Rig ownership by fleet size has been compared since 1993, when consolidation really began increasing. In more recent years, there have only been slight fluctuations in this area. This year, the largest companies continue to hold about 62% of the total fleet. One difference, though, is that there has been a slight switch in percentages for companies holding two to five rigs and those having six to ten rigs, with the smaller companies gaining rigs overall and the larger companies downsizing, Fig. 10.
|
|
|
Fig. 10. US rig ownership by fleet size, 1993–2010.
|
|
CONTRACTORS WORRY ABOUT RIG RATES
Most US and several Canadian drilling contractors have been surveyed for the past 20 years regarding their business direction and their opinions of the industry. These professionals continue to shed new light on overall industry concerns and future projections. Eighteen contractors participated in this year’s survey, owning a total of 710 rigs. These companies predominately operate in the US, but a few Canadian companies also participated. These companies represented a wide variety in both company size and regional areas.
For the survey, contractors are asked to rank some key issues based on their level of importance and estimate a number of changes to their business, both past and anticipated. Rig rates are often the top concern of contractors, and this year is no different. Although drilling activity has picked up, there is still a wide gap between rig demand and supply. This apparently has kept rig rates from climbing to acceptable levels for many contractors. Another issue brought to light again by the survey is the problem of crew availability. Even though crew concern had dropped to tying with insurance costs as the No. 3 concern last year, it has risen to No. 2 and will probably always be a struggle for companies attempting to man their rigs. Government regulations, the No. 2 concern last year, dropped to No. 3 for 2010. There continues to be apprehension about regulatory changes over the next several years. This was especially pushed to the forefront after the recent Gulf of Mexico rig disaster and subsequent deepwater moratorium, which ended in early October.
According to survey respondents, land rig rates in actual dollars have averaged $13,282/day during May–June 2010. Reflecting the climb in activity, labor rates for contractors have also begun increasing again, and were up 3% on average since last year. Maintenance expenses are up again as well, rising 9% for 2010. Climbing rig maintenance is a logical consequence of more units being refurbished and put back into service.
Contractors responding to our survey indicated that their rig activity has gone up 26% on average for 2010. This is considerably lower than the overall industry increase of 60% for the census this year. However, there has apparently been enough improvement to warrant some optimism, since a greater number of contractors are expecting more promising times ahead for the drilling contracting industry during the next two years. Many foresee technology and specialty rigs making an impact in the near future. Despite some optimism, there is also a lot of uncertainty, and the survey suggests that many have a “wait and see” attitude, especially regarding government regulation. Overall, contractors’ estimates about their future business expectations vary widely, but on the average they expect a modest climb of 5% over the coming year.
Contractors were asked how changes in oil and gas prices would affect their businesses. When asked what prices would cause them to raise their activity from its current level, the average reply was $86.30/bbl for oil and $6.50/Mcf for gas. When asked what prices would cause them to lower their activity level, the average answer was $53.90/bbl for oil and $3.70/Mcf for gas. As of this writing, prices are still hovering within those ranges, so it doesn’t appear that most contractors will be changing their business direction based on commodity prices alone during the near future.
Many contractors are optimistic enough about the market to have expansion strategies for the future. When asked to describe their company’s plans for the next five years, the largest percentage of survey respondents, 44%, said they are preparing to increase their fleets. The second largest group, 43%, tells us that they have no plans for change. Very few companies mentioned that they were planning to downsize, diversify, merge or explore international opportunities.
U.S. FORECAST FOR 2011
Stagnation will again characterize the industry for the 2011 census period. Some new rig rollouts will continue over the next year but will again be countered by retiring units, so large increases in available rigs are not likely. Due to the existing political and economic situation, activity may not climb much higher either. A waiting game seems to be in the cards for the drilling industry’s near future. 
| CENSUS GROUND RULES
• Company sales regions were used for the geographical breakdown in Table 4.
• Contractor-owned rigs are those belonging to companies whose primary business is offering drilling contracting services.
• To be considered active, a rig must be drilling at least one day during the 45-day qualification period.
• Only workable rotary rigs are included; cable tool rigs are not.
• To be considered available, a rig must be able to go to work without requiring a significant capital expenditure.
• Rotary rigs stacked for an extended period of time, typically three years or longer, are not counted as available.
• A rig must be capable of, and normally employed for, drilling deeper than 3,000 ft. Therefore, some shallow drilling rigs (mostly in the US Northeast) are excluded, but this is necessary to ensure that well-servicing rigs are not counted.
• Electric rigs include all those that transmit power from prime movers to electrically driven equipment.
• Inland barges include barge-mounted rigs that may be moved from one location to another via canal, bayou or river and that drill in sheltered inland waters. Offshore rigs include stationary platform units (both self-contained and tender-supported), bottom-supported mobile units and floating rigs (both drillships and semisubmersibles).
|
ACKNOWLEDGMENT
The following are recognized for their contributions to this year’s rig census: Michael Wayne (RigData); Tom Kellock (ODS–Petrodata); Diane Henderson (Nickle’s Energy Group); Leonora Compton, Wade Dannhaus, Amy Dismore and Dave Macneil (NOV Downhole).
|
THE AUTHORS
|
 |
Steve Berkman has been the Director of Strategic Marketing for NOV Downhole since January 2009. Prior to that, he had been Marketing Manager for ReedHycalog since July 2004. He began with ReedHycalog over 27 years ago—starting as a Design Engineer in 1982. Mr. Berkman has been all over the world in various engineering and sales positions. He received a BS degree in mechanical engineering from the University of Texas. |
|
 |
Tory A. Stokes is a consultant for NOV Downhole, having previously been employed by ReedHycalog as Senior Marketing Analyst for eight years. She graduated with a BS degree in applied mathematics from Texas A&M University in 1985, and earned an MBA from the University of Houston in 1993. |
|


