A Permian Basin operator used downhole temperature profiles to maximize the effectiveness of a well stimulation campaign.
Robert Reyes, Gerard Glasbergen and Valerie Yeager, Halliburton;
and Joseph Parrish, Occidental Petroleum
Distributed temperature sensing (DTS) was used by a West Texas operator on 16 wells to determine the effectiveness of acid treatments. The technology uses a fiber optic cable to read temperature along the wellbore in real time. This allowed the service company to validate fluid placement within each zone as well as determine effectiveness of the acid treatment. In the wells observed, effectiveness was determined while pumping the job with DTS rigged up to the well, which allowed the operator to decide during the job if a change to the design should be made.
A basic concern related to acid treatments is that a high percentage of the acid will enter the first least-resistant zone encountered, leaving subsequent zones untreated.
Historically, on acid jobs, surface readings for pressure and rate were the only real-time indicators to judge treatment effectiveness. The legitimacy of this type of interpretation can be questioned because friction pressure encountered can mask what is actually taking place downhole. As the operator in this case study monitored the acid treatments using DTS, it was observed that what is seen at the surface can be misleading.
BACKGROUND
DTS literature indicates that the use of temperature readings to monitor fluid placement was initiated more than 70 years ago.1 When determining fluid flow inside the wellbore, an understanding of geothermal gradient and internal Joule-Thomson effect (JTE) is necessary. Applications where fluid placement and zonal coverage are important include 1) matrix-acidizing treatments, 2) scale-inhibitor squeeze treatments, 3) water-control treatments, 4) water injection for enhanced recovery, and 5) hydraulic fracturing treatments.1 Production profiling is also a candidate for DTS application. The DTS study discussed in this article concentrates on matrix acidizing and production profiling.
At the time of the study, surface-pressure response and production improvement after treatment were being used to determine if the acid treatment was effective. If effectiveness was questioned, design changes—changing the acid rate or concentration or including solid diverter stages—were attempted.
Using surface pressure to determine design changes for the current and next well is not sufficiently accurate to effectively make these determinations. Fluid friction pressures in the tubulars are not always accurately known and are capable of affecting surface pressure, resulting in erroneous bottomhole pressure calculations. Surface indicators could thus falsely predict a downhole phenomenon, such as diversion, because of friction pressure variations.
When pumping during the diverter stage, operators need to have the capability to read what is happening and react to how the well is responding to treatment at the moment by the use of accurate downhole information.
Geothermal gradient. Liquid and gas flow in or out of the wellbore leaves a characteristic temperature signature on the thermal-gradient curve. During production, oil, gas and reservoir fluid are expected to flow from the high-pressure reservoir into the low-pressure wellbore. Liquid recovery will result in a warming trend, and gas recovery will result a cooling effect. These are the basic concepts used to analyze fluid movement from formation to wellbore.
The geothermal gradient is the baseline temperature of the earth per unit of depth below about 650 ft on the continents. It is the gradual warming trend as the Earth’s core is approached. This temperature gradient ranges 0.7–2.5°F per 100 ft.2 A DTS profile will use the well’s specific geothermal temperature profile as a baseline for qualitative analysis.
When fluid flow (liquid or gas) leaves or enters the wellbore, a convectional temperature effect occurs. Transient heat-transfer effects on fluid flow indicate state of fluid and direction. Gas entering the wellbore from the reservoir experiences a sudden expansion, so a cooling effect is observed, while liquid entering the wellbore from the higher-temperature reservoir will yield a fluid warming trend. These anomalies from the geothermal baseline indicate fluid flow, which can then be categorized as completion effects, near-wellbore interferences or other related events.2
Joule-Thomson effect (JTE). The JTE is a key indicator for fluid entry during DTS.3 The phenomenon takes place as the fluid is subjected to a change in pressure and, therefore, temperature. In essence, JTE is the cooling of a gas as it is suddenly expanded (in this case, exiting a perforation).
Because of the JTE, gas wells are excellent profiling candidates, especially when the perforations are spread adequately to see actual production at depth and DTS velocity calculation can be made. A tight-gas well produces with high drawdown-pressure drop, so the JTE can be observed clearly. Depending on the fluid composition and direction, the temperature can experience a positive or negative change from baseline temperature. Hydrogen gas will generally experience a cooling effect of 2°F to more than 20°F per 1,000 psi of pressure differential. Water will warm at 3°F/1,000 psi.2 Other mechanisms associated with DTS include the warming of the near-wellbore region due to production of a liquid that has been exposed to a warm reservoir (heat sink), and cooling of the wellbore from pumping cool surface fluids downhole.
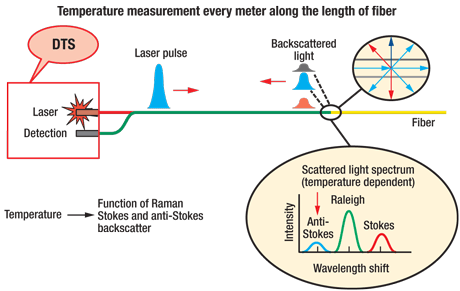
DTS. The temperature distribution along the wellbore is measured through a fiber optic cable from surface to TD. A DTS black box on the surface uses a pulsed-laser source to send a pulse of light down the optical fiber. The return light or “backscatter” is recorded, Fig. 1. The backscatter of absorbed and retransmission of light energy is composed of spectral components: Rayleigh, Brillouin and Raman bands. It is from the Raman band that temperature can be extruded. Two components in this band, anti-Stokes (AS) and Stokes (S), have a great and a weak dependence on temperature, respectively.4 Temperature can be calculated based on the ratio of intensities of backscattered AS and S light.5 Because the velocity of light through glass is known, the depth of the temperature profile is calculated using the arrival time of returned backscatter light.
 |
|
Fig. 1. Raman-based distributed temperature sensing (DTS) concept.
|
|
The DTS profile is a set of temperature sample points spaced equidistant along the fiber cable. The sampling interval is usually 1 m in length, and the measurement time ranges from a few seconds to several minutes and even hours. The larger the measurement time, the more accurate the temperature will be.6
Diversion. Diversion of injected fluids seeks to control the distribution of treating fluids uniformly across a zone or from one zone to another. Without diversion, fluid placement tends to occur in zones of highest permeability, highest acid solubility or lowest pressure. For producing wells, the resultant increase in productivity is very short-lived. Large portions of the reservoir containing much of the reserves are not treated and have poor to no connection with the wellbore.7 For injectors, the fluid often only enters one or a few regions. In these cases, the goal is to divert the acid across the entire zone and to remove damage in other places so that the sweep efficiency can be improved.
While most typically associated with matrix acidizing, diversion can also be used in other treatments, such as conformance, scale squeezes, sand consolidation and hydraulic fracturing. The diversion method best suited for a particular situation depends on many factors, including and not limited to the type of well completion, the perforation density, the type of fluid that is produced or injected after the treatment, casing and cement sheath integrity, bottomhole temperature and bottomhole pressure.
Many examples of diversion materials and methods have been described in the literature.8–13 These include:
• Particulates to build up a filter cake on low-resistance reservoir zones
• Perforation balls that will block off the casing perforation openings that access the low-resistance zones
• Chemical diverters that build up resistance in easily accessible zones
• Relative permeability modifiers (RPMs) that restrict the flow for water
• Foams.
The industry’s challenge is to understand which diverters work under what conditions. In an acid treatment, the fluid diversion design is often based on guidelines, rules-of-thumb and an intuitive idea on how diversion “works.” Models are available to predict diversion effects, but are not always used, and uncertainty on input parameters will affect the results.10,14 Measurements of effective fluid diversion are almost always limited to changes in surface-treating pressure. An increase in treating pressure is an indication that diversion was effective, whereas no treating-pressure response implies ineffectiveness or no diversion.15,16
CASE STUDIES
The effectiveness of the three different diverters was investigated during this study: 1) a soluble particulate, 2) an RPM and 3) a chemical diverter in the form of an in situ cross-linked acid.
The soluble particulate is a graded rock-salt (NaCl) solid that can be used at most temperatures, but is most effective in gelled, water-based solutions at less than 180°F. In this application, it consisted of 60% 2⁄8-mesh and 40% 8⁄12-mesh particle sizes, which is especially helpful in vugular and/or naturally fractured reservoirs. Effects of rock salt will be temporary if subsequent aqueous fluids following the diverter stages are not salt saturated.
The next three treatments used an RPM that was a low-viscosity, hydrophilic polymer with insoluble, hydrophobic modifications that tend to associate with each other. RPM use resulted in adsorption to the rock and a desired reduction in effective water permeability by at least 80%, without a significant reduction in effective oil permeability. When the RPM is placed in the matrix, the water permeability reduction is permanent unless removed with an oxidizer. Multiple demonstrations of this material’s effectiveness in both carbonate and sandstone and in both RPM and diversion applications have been published.17
Finally, the in situ cross-linking capabilities of gelled acid were used. This third diversion mechanism is dependent on the spending of the acid to raise the fluid pH from very low to just below 2.
At this pH range, the polymer cross-links, viscosity increases, and resistance to penetration of the matrix will increase significantly, thus causing fluid to divert to other areas. Acid concentrations of less than 15% are recommended so that spending occurs, and in cool, less-reactive formations, concentrations as low as 3% can help ensure that breaking occurs.18,19
Well candidates. The DTS number is the number of times a temperature anomaly would be shown in the completed interval if the flowrate were constant from the surface to TD. Tracking such a disturbance in the temperature profile across the completed interval is one of the main methods of flow-distribution quantification. Therefore, it is required that the anomaly be visible in at least three temperature profiles over time. A DTS number larger than 2.5 will fulfill this requirement even if all fluid flows to the last perforation.
In the campaign, it was planned to have an inventory of wells to be accessed and ranked by the DTS experts for candidate strength. A well that ranks highly will result in DTS analysis that can quantify fluid placement, whereas analysis of low-ranking wells will have difficulty quantifying flow percentages to different regions. Parameters that affect the candidate grade selection are injection rate of treatment, length of the zone of interest, open hole or perforated zone, and spread of the perforations. A DTS number NDTS was calculated to quickly determine well candidate strength.1
The DTS number equation is:

where ID is the wellbore ID in inches, h is the total measured height in feet, C is a unit conversion of 17.1582, TDTS is the data acquisition rate in seconds, and QBH is the bottomhole fluid rate in bbl/min.
A DTS number of 2.5 or greater indicates a strong candidate. Between 2.5 and 1.25 is questionable to good, if other criteria for success are present. A well with NDTS lower than 1.25 requires examination to determine whether to invest in DTS monitoring.
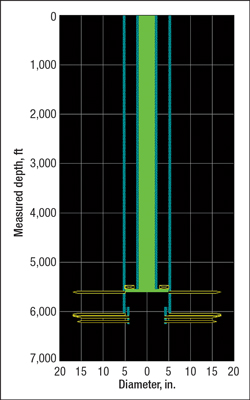
Well GLDU 33. This water injection well in Andrews County, Texas, had two perforated intervals totaling 280 ft. The treatment was a matrix acid process with a polymer diverter. DTS was deployed inside capillary tubing, Fig. 2.
 |
|
Fig. 2. The perforated zones of Well GLDU 33 are marked in yellow. A 5½-in. casing with 23⁄8-in. tubing and packer is set at 5,538 ft, and a 4½-in. liner is set at 5,905–6,249 ft.
|
|
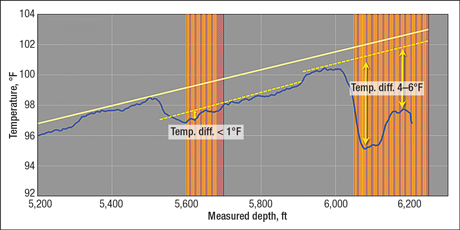
This well had been on long-term water injection. The retrievable DTS system was deployed in the well before the acid treatment. Figure 3 shows the downhole temperature profile compared with the pretreatment baseline after acid was pumped and the well was shut in to observe communication between zones.
The wellbore geometry determines the expected temperature restoration—i.e., the warming effect toward the original baseline temperature that occurs after fluid pumping ceases or the amount of fluid taken by a zone decreases. A slower temperature restoration means sustained fluid movement, whereas faster restoration indicates decreased fluid movement.
As shown in Fig. 3, during shut-in, reservoir fluids are flowing from the bottom zone to the top zone, with crossflow inside the casing. The actual temperature profile (blue line) approaches the baseline (solid yellow line) uphole of the bottom set of perforations (i.e., temperature restoration occurs) and then moves away from the baseline further uphole toward the top set of perforations (less temperature restoration). Thus a quick temperature restoration is observed in the tubing, a slow restoration in the casing (left dotted yellow line, 5,550–5,900 ft) and a moderate restoration in the liner (right dotted yellow line, 5,900–6,249 ft), because the liner shields the inside of the wellbore from the reservoir temperature, slowing temperature restoration.
 |
|
Fig. 3. The pretreatment temperature profile (blue line) shows the injection fluid’s influence on temperature, compared with the geothermal baseline (solid yellow line). Perforations are represented by the vertical orange lines: top perforations at 5,600–5,680 ft and bottom perforations at 6,050–6,250 ft.
|
|
The more delayed temperature restoration at the bottom perforations versus the top perforations implied that most injected water entered the lower region. Limited and delayed temperature restoration was observed at the top perforations after pumping acid.
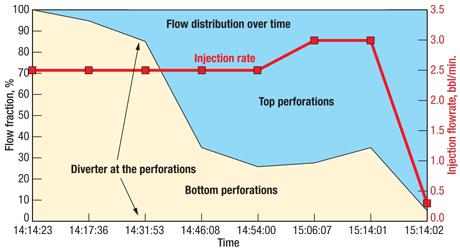
While acid was pumped, it was initially observed by DTS that almost all the acid was bypassing the top set of perforations and flowing into the top of the bottom set of perforations. This could have resulted from heavy damage to the top set of perforations. Over time, the percentage flowing into the top set of perforations slowly increased, as the acid began to clean up some of the damage on the top zone that was preventing treatment from entering more easily. A rapid increase in the percentage of fluid flowing to the top perforations was observed as the diverter, most of which flowed to the less-resistive bottom perforations, began working, blocking flow to the lower zone and forcing treatment fluid to the upper zone.
Thermal tracers were pumped downhole to show the flow distribution over time, Fig. 4. The flow distribution indicated that sustained diversion had occurred, resulting in a dramatic change in the percentages of flow to the top versus bottom perforations.
 |
|
Fig. 4. DTS analysis of thermal traces pumped downhole with the acid treatment shows the change in fluid distribution as the acid and diverter took effect. The rapid increase in fluid percentage to the top versus bottom perforations after 14:31 indicates that this is when the diverter to the bottom perforations began forcing fluid to the top.
|
|
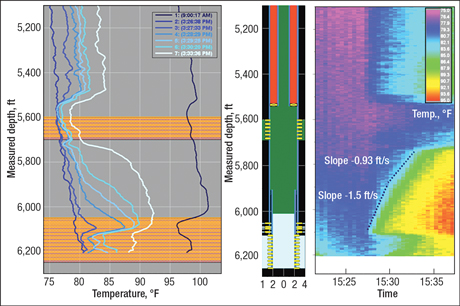
DTS temperature profiles over time indicated crossflow out of the reservoir at the top of the bottom perforations (indicating that this was a high-pressure zone) and up through the wellbore to the lower-pressure part of the formation at the top set of perforations, Fig. 5.
 |
|
Fig. 5. Using DTS analysis over time, crossflow of reservoir fluids at more than 1 bbl/min. was established from the top of the bottom perforations to the top perforations.
|
|
Denver Unit Well 5816. This producer in Wassom Field, 1 mi east of Denver City, Texas, was originally completed in August 1981. The targeted formation is the San Andres, with perforation depths of 4,875–5,125 ft and open hole from 5,135 to 5,226 ft. The well was cased with 7-in., 20-lb/ft and 23-lb/ft casing to 5,135 ft. The treatment was pumped down 2⅞-in. tubing with a packer set at 4,750 ft.
The acid and diverter treatment was designed as 17% HCl acid in 2,000-, 3,000- and 4,000-gal stages, with diversion between each acid stage. The diversion strategy was to use first 1-lb/gal, then 1.5-lb/gal course rock salt pumped in gelled saturated brine. DTS data would be used to determine if diversion occurred. If no diversion occurred, the operator would proceed to a polymer diverter and then back to acid. This was repeated in three acid stages.
DTS data indicated that acid was placed in the region above 5,000 ft with ease, but significant acid flow was not observed below this depth. Based on this information, the rock salt diverter was pumped, but did not divert acid to the lower zone. The second, polymer diverter, however, did result in as much as 20% of the fluid placement, or 1.35 bbl/min., being placed below 5,000 ft for a short period, according to the DTS data. Acid did not get all the way to the bottom perforations.
A 22-month production survey observed a change in average production from 14 bpd of oil, 193 bpd of water and 267 Mcfd of gas to 26 bopd, 299 bwpd and 267 Mcfd—an oil output increase of more than 80%.
It was assumed that all previous acid treatments (before DTS was installed) had treated the region above 5,000 ft, observed to be the least resistive region. For future treatments, a larger diverter volume was recommended. This well provided an excellent example of how DTS allowed real-time evaluation of the treatment strategy and adjustment of that strategy to respond to downhole conditions.
Midland Farms Unit Well 507. This injector well in Andrews County, 15 mi southeast of Andrews, Texas, targets the dolomite Grayburg Formation, with open hole at 4,697–4,804 ft and 5½-in. casing set at 4,697 ft. The acid treatment was down 2⅜-in. tubing with the packer at 4,593 ft.
The treatment design was to pump at 1 bbl/min. A step-rate test was planned to determine fracture pressure, after which the rate would be adjusted to pump at matrix rates for the well. Three acid stages were designed using 28% HCl, as a high concentration of acid was desired to optimize dissolving capability on the cool dolomite. A polymer diverter was used between acid stages.
Post-treatment injection on the well increased from an average 574 bbl/min. at 771 psi at surface to 678 bbl/min. at 700 psi at surface after the acid and diverter job on Nov. 25, 2008. The injection index rose to 97% from 74%.
DTS analysis indicated acid stimulation from 4,720 to 4,740 ft. A small percentage of acid went to 4,700 ft at the beginning and the end of the procedure. There were flow-distribution changes indicating some diversion had taken place. It was believed that an insufficient volume of diverter fluid was pumped, and that a higher volume would have increased the chances of success. Wormholing was also a contributor to the diversion mechanism not working as well as desired. Lessons learned were to take more diverter to location than designed, to supply an option as to how much is pumped in the event that DTS indicates more is needed; and to use diversion before wormholing occurs to increase effectiveness.
IMPROVEMENT OF JOB DESIGNS
Lessons learned from this campaign involved designing acid on a well-by-well basis, depending on what the operator desires to accomplish. If the well is a cool dolomite, the reactivity of the acid can be increased by heating the acid, increasing the HCl concentration, or slowing the injection rate to increase the time the acid has on the fractured formation face.
In jobs where an in situ cross-linked acid was pumped, the acid would cross-link once the pH rose to a certain level due to being partially spent on the limestone formation. The cross-linked acid then would break at a still higher pH, meaning the high viscosity of the cross-linked acid would reduce back down to 1 cP. In future applications, the acid concentration should be lowered to help ensure that spent acid pH reaches the adequate range for proper cross-link and breaking. Again, reducing the rate would also help raise pH as the acid spends more thoroughly.
Certain jobs had wells in which the tubing had not been pickled. In these cases, the operator can design a volume of acid before the main treatment to pickle the tubing. A good rule of thumb would have been to pump an extra 500 gal of 15% HCl per 10,000 ft of tubing to accomplish this task, then circulate this fluid out of the well to surface.
To aid in DTS analysis, care should be taken to choose the correct well candidate. Using the DTS number in developing the well candidate inventory will result in better DTS analysis. Also, the use of temperature tracers was important. Trying to cool the fluid with ice was attempted and did not work well because the fluid warmed back up before an adequate tracer effect could reach the target. Reducing the friction reducer seemed to work well. Also, it was discovered that acid going into the liner generated enough heat to use as a temperature tracer. Temperature tracers are a continuing development as this project moves forward.
It was concluded that taking extra acid and diverter to the jobsite is important. Once the DTS analysis is started, it then becomes evident what acidizing procedure should be attempted. On-the-fly decisions can only be carried out if there is enough acid and diverter, including alternative diverters, on location. 
ACKNOWLEDGMENTS
This article was prepared in part from a paper presented at the Southwestern Petroleum Short Course held in Lubbock, Texas, April 21–22, 2010.
LITERATURE CITED
1 Glasbergen, G., Yeager, V., Reyes, R. and D. Everett, “Fluid diversion monitoring: the key to treatment optimization,” SPE 122353 presented at the SPE European Formation Damage Conference, Scheveningen, The Netherlands, May 27–29, 2009.
2 Johnson, D. O., Sierra, J., Gualtieri, D. and J. Kaura, J. “DTS transient analysis: A new tool to assess well-flow dynamics,” SPE 103093 presented at the SPE Annual Technical Conference and Exhibition, San Antonio, Texas, Sept. 24–27, 2006.
3 Seffenson, R. J. and R. C. Smith, “The importance of the Joule-Thomson heating in temperature log interpretation,” SPE 4636 presented at the Fall Meeting of the SPE of AIME, Las Vegas, Nevada, Sept. 30–Oct. 3, 1973.
4 Ahangrani, J. M. and B. T. Meggitt, B.T., eds., Optical Fiber Sensor Technology: Advanced Applications Bragg Grating, and Distributed Sensors, Springer, London, 2000.
5 Soto, J. A. et al., “Distributed temperature sensor system based on Raman scattering using correlation-codes,” Paper Electronics Letters online No. 20070990 presented at the Institute of Engineering and Technology, Aug. 6, 2007.
6 Sierra, J. et al., “DPS monitoring data of hydraulic fracturing: Experiences and lessons learned,” SPE 116182 presented at the SPE Annual Technical Conference and Exhibition, Denver, Colorado, Sept. 21–24, 2008.
7 Fulton, D., Lizak, K. and M. Van Domelen, “Front-end engineering studies for carbonate stimulation optimization,” IPTC 10697 presented at the International Petroleum Technology Conference, Doha, Qatar, Nov. 21–23, 2005.
8 Erbstoesser, S. R., “Improved ball sealer diversion,” Journal of Petroleum Technology, 32, No. 11, 1980, pp. 1903–1910.
9 Nitters, G., Davies, D. R. and D. R. Koninklijke, “Granular diverting agents selection, design, and performance,” SPE 18884 presented at the SPE Production Operations Symposium, Oklahoma City, March 13–14, 1989.
10 Hill, A. D. and W. R. Rossen, “Fluid placement and diversion in matrix acidizing,” SPE 27982 presented at the University of Tulsa Centennial Petroleum Engineering Symposium, Tulsa, Oklahoma, Aug. 29–31, 1994.
11 Paccaloni, G., “A new, effective matrix stimulation diversion technique,” SPE Production and Facilities, 10, No. 3, 1995, pp. 151–156.
12 Lietard, O. “Matrix treatment in horizontal openhole wells: Design of viscous diverter slugs and treatment fluid placement optimization,” SPE 38201 presented at the SPE European Formation Damage Conference, The Hague, June 2–3, 1997.
13 Parlar, M., Nelson, E. B., Walton, I. C., Park, E. and V. DeBonis, “An experimental study on fluid-loss behavior of fracturing fluids and formation damage in high-permeability porous media,” SPE 30458 presented at the SPE Annual Technical Conference and Exhibition, Dallas, Texas, Oct. 22–25, 1995.
14 Glasbergen, G. and M. Buijse, M. “Improved acid diversion design using a placement simulator,” SPE 102412 presented at the SPE Russian Oil and Gas Technical Conference and Exhibition, Moscow, Oct. 3–6, 2006.
15 McLeod, H. O. and A. W. Coulter, Jr., “The stimulation treatment pressure record: An overlooked formation evaluation tool,” Journal of Petroleum Technology, 21, No. 8, 1969, pp. 951–960.
16 Paccaloni, G., “Matrix stimulation planning: Part 2. Field history verifies control, evaluation,” Oil and Gas Journal, 77, No. 48, 1979, pp. 60–65.
17 Eoff, L., Dalrymple, D. E., Reddy, B. R. and D. M. Everett, “Structure and process optimization for the use of a polymeric relative-permeability modifier in conformance control,” SPE Journal, 8, No. 2, 2003, pp. 92–98.
18 Yeager, V. and C. Shuchart, C., “In situ gels improve formation acidizing,” Oil and Gas Journal, 95, No. 3, 1997, pp. 70–71.
19 MaGee, J., Buijse, M. A. and R. Pongratz, “Method for effective fluid diversion when performing a matrix acid stimulation in carbonate formations,” SPE 37736 presented at the Middle East Oil Show and Conference, Bahrain, March 15–18, 1997.
|
THE AUTHORS
|
 |
Robert Reyes is a Technical Specialist for Halliburton Energy Services with 16 years of experience in the oil and gas industry. He received a BS degree in mechanical engineering from Texas Tech University and has authored professional papers on fracturing, cementing and DTS. Mr. Reyes is the DTS champion for Halliburton in the Permian Basin, serves as Chairman for the Southwestern Petroleum Short Course and is on the Board of Directors of SPE.
|
| |
Gerard Glasbergen is a Stimulation Engineer for Halliburton Energy Services with over 10 years of experience in the petroleum industry. He has an MS degree in mathematics from the University of Utrecht, the Netherlands. Mr. Glasbergen currently works in the Halliburton Technical Advisory Team for Europe and Africa. His areas of expertise include acid stimulation, fluid placement and heat transfer.
|
| |
Valerie Yeager has 26 years of oil industry experience with Halliburton, in both the technical and commercialization/portfolio management aspects of acidizing, formation damage and near-wellbore stimulation. Currently, Ms. Yeager heads the Environmental Solutions area of Halliburton’s Production Enhancement Technology division in Duncan, Oklahoma. She holds degrees in chemistry and petroleum engineering and has authored numerous papers on stimulation and formation damage.
|
| |
Joseph Parrish is a Production Engineer for Occidental Petroleum working as a member of the South Asset Team in the Permian Basin. He earned a BS degree in petroleum engineering from Texas A&M University in 2007. Mr. Parrish currently works in the Goldsmith Area and is responsible for production operations, waterflood surveillance, well enhancement and well completions.
|
|


