Using field test results in finite-element analysis modeling improved understanding of bending moments and forces of a coiled tubing intervention stack on the North Slope of Alaska.
Ken Newman and David Traugott, National Oilwell Varco CTES;
Steve Deckert, BP Exploration
On the North Slope of Alaska, large coiled tubing (CT) units are typically used to perform interventions. These units use a mast with a T-bar to support the injector and well control stack on the wellhead. In some cases, the wells have dual or ESP completions, with smaller components in the wellhead. In 2007, as BP Exploration in Alaska was planning CT operations on such wells, there was a concern that the CT intervention stack and associated equipment could damage these small wellhead components during the well intervention process. The tubing head adapter of the wellhead was a primary concern, as it had a maximum bending moment of 14,400 ft-lb specified by the manufacturer. Also of concern were the other 29⁄16-in., 5,000-psi components in the tree, though they had higher bending limits.
In an effort to understand the forces and bending moments associated with utilizing a T-bar structure to support the stack, a finite-element analysis (FEA) was performed using a proprietary software package, known as the Zeta model.1 The preliminary results from the analysis indicated that, if the CT injector was held close to the centerline of the wellhead and the injector was not allowed to rotate (tilt) toward the reel when reel-back tension (RBT) was applied, the existing intervention stack design was within allowable load limits. However, if the T-bar allowed some tilting of the CT injector due to RBT, or if the injector was not closely aligned with the wellhead (i.e., if there was some lateral displacement), the bending moment on the tubing head adapter could exceed the manufacturer-specified limit.
A field test was performed to mitigate the uncertainty associated with flexibility of the T-bar support and the flexibility of a quick connect (QC) in the well control stack. A bending moment and force measuring device, called the Zeta gauge,1 was run in the well control stack to provide real-time measurements during a field job. This job was performed on a wellhead with larger components to avoid possible failure during the test.
The field test yielded some unexpected results. First, the injector support structure was pinned at the T-bar support; during the initial modeling, it was thought to be rigidly supported. When the RBT was varied significantly, the T-bar support moved somewhat horizontally and the QC wasn’t flexible. Instead, it could travel up to 0.5° of bending from the centerline in any direction. At this point, it locked and became rigid.
The model agreed with the field data once it was updated to include these results. The model could then be rerun for the primary case of interest, which contained the smaller wellhead components. It was determined that interventions incorporating the smaller wellhead components could be run safely with careful attention being paid to the alignment of the injector and well control stack with the wellhead.
THE MODEL
The model used to perform this intervention stack analysis is a purpose-written 3D nonlinear finite-element analysis model. The FEA is run repeatedly at very small time increments. A finite-difference, forward-difference scheme is used to determine the acceleration of each component in the stack and the associated dynamic forces. Although, in this case, the stack is static, the dynamic calculation is needed to accurately determine the buckling load.
There are three failure modes considered by the model: buckling, bending and flange bending.
Buckling occurs due to instability of the structure. A long, slender column will fail when a compressive “buckling load” is applied to the column. In this case, the well control stack is relatively short, so buckling was not a concern.
Bending or yielding of a stack component is considered a “failure” in engineering terms, but it often does not result in a catastrophic event such as the collapse of the stack or a release of well pressure. Thus, bending failures may not be counted as failures. The FEA model calculates the Von Mises stresses in each of the components and compares it to the yield stress of the material. For safe operations, the Von Mises stress should be less than 50% of the material yield stress.
Flange bending moment operating limits for API flanges are provided by API 6AF. These limits are based upon the amount of bending that can occur before the seal ring disengages and allows a release of pressure. The FEA model compares the actual bending moments at the flanges with the limits specified by API. Often this is the most limiting of the failure modes. Note that this limit already includes a safety factor, so operations can be performed to 100% of this specified limit.
In this case, the bending limit of the tubing head adapter was specified by the manufacturer to be 14,400 ft-lb. This derating of the normal API 6AF bending limit is due to the offset welded neck extension used to provide access for the cable penetrator for the electrical submersible pump. This value also happens to correspond to the API flange bending limit when there is 5,000-psi pressure, so it is assumed that this is a flange bending limit.
To recap, the maximum working stress is 50% of the yield stress, while the maximum working bending moment is 100% of the API flange bending moment limit.
The initial step in using the FEA model involves identifying the intervention stack components and their physical characteristics, including length, diameter, wall thickness and yield strength of material. The next step involves definition of stack supports and their locations (such as guy wires or use of a crane or lift frame to help support the injector), as well as the presence of any object that would constrain the physical movement or deflection of the stack (e.g., passage though a deck floor). Next, the model requires any movement of the wellhead and/or the floating vessel to be defined (if applicable). Finally, the maximum loading that will be placed on the intervention stack during the field operations (such as CT weight and reel-back tension) must be defined. The model then uses these parameters to calculate the dynamic deflection of the structure and the associated Von Mises and flange bending limits.
THE GAUGE
The Zeta gauge consists of a 2-ft section of API lubricator (studded on each end and rated at 10,000-psi working pressure) that is inserted into the intervention stack during rig-up. This lubricator has been instrumented with fiber optic strain gauges placed at 90° intervals around the circumference of the spool. Additional fiber optic strain gauges are mounted on the spool to measure internal pressure and temperature of the lubricator material; these measurements are required to accurately calculate the bending moments and axial force.
Measurements from the various strain gauges are transmitted to a PC that uses proprietary software to process the data. As a result, the gauge displays and records real-time measurements of axial force, bending moment and bending direction at the location of the gauge during the field operation. The user is warned if a pre-defined limit is exceeded.
INITIAL MODELING
It was believed that it would be difficult during the rig-up process to ensure that the centerline of the injector was exactly aligned with the centerline of the wellhead. Small misalignments at the top of the injector with respect to the wellhead could cause significant bending of the wellhead. For this misalignment to exist in the model, either the stack must be bent at some point, or a “displacement force” must push the top of the stack away from the centerline. This analysis assumed that the stack was straight, and that a displacement force existed.
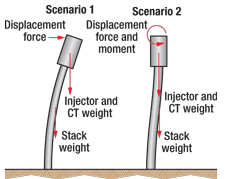
Figure 1 shows two displacement scenarios initially considered. In scenario 1, the top of the injector was allowed to rotate slightly, so there was a displacement force but no moment was being applied to the top of the injector by the T-bar structure. The resulting displacement of the structure was a curved shape. In scenario 2, the T-bar structure held the injector perfectly vertical so it was unable to rotate. In this situation, there was both a displacement force and a moment required. The resulting shape of the structure was an s-shape with a central point in the stack with a zero moment. Later, in the field test phase, it was learned that the injector support structure was pinned to the T-bar support, meaning that scenario 1 was the correct scenario.
 |
|
Fig. 1. Stack bending scenarios 1 and 2.
|
|
During the initial modeling phase of this study, it was assumed that the real situation would be somewhere between scenario 1 and scenario 2 and, thus, both scenarios were considered. For the same amount of misalignment, the s-shape caused by scenario 2 had higher bending moments than the curved shape caused by scenario 1, indicating that flexibility at the T-bar would be preferable.
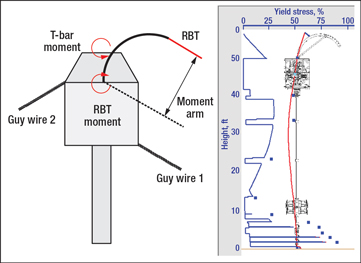
RBT causes a bending moment at the top of the injector, Fig. 2. If scenario 1 were correct, this bending moment would cause the injector to rotate, as shown in the screen capture in Fig. 2. The red line depicts the displacement of the centerline multiplied by a factor of 5 to make it more visible. To avoid this bending moment caused by RBT, it would be better to have the injector rigidly attached to the T-bar, forcing the bending described by scenario 2. Thus, it was difficult to determine which scenario was preferable in the field. During the field testing, the RBT was varied significantly. These variations caused a variation in the bending moment, but it was in the opposite direction from what was expected. After some time, it was realized that the RBT was not only causing the additional bending moment, but it was also causing the T-bar structure to move. The movement of the T-bar structure caused a larger moment in the opposite direction to the moment caused by the RBT.
 |
|
Fig. 2. Moment caused by RBT.
|
|
The following additional assumptions were used in the initial pre-job modeling:
• All the connections in the stack were modeled as API flange connections, even though quick unions were being used. This was conservative, because quick unions were believed to have more flexibility than API flanges, though no published data was available. Increased flexibility of the unions would decrease the bending moments and stresses, and allow more movement of the injector than calculated with rigid flanges.
• The API flanges would be assembled utilizing high-grade bolts. In this field operation, use of high-grade bolts would not have improved the results significantly because the bending limit was physically located at the tubing head adapter, which had a manufacturer-specified bending limit.
• The T-bar provided no vertical support to the stack; thus, all of the stack weight was applied to the wellhead via the tubing head adapter.
• These simulations were performed for a CT size of 1½ in. and a wellhead pressure of 100 psi. The CT diameter is only used for a pressure area calculation at the stripper. Increasing the CT size to 1¾ in. and the wellhead pressure to 5,000 psi reduced the calculated yield stress by less than 1%. The API 6AF flange ratings would be reduced with higher wellhead pressures. Thus, the CT diameter and wellhead pressure were assumed to be relatively unimportant.
This initial modeling showed that a 4-in. misalignment of the injector with the centerline of the well would cause the 14,400-ft-lb limit to be exceeded. A 4-in. misalignment seemed small when compared to a 60-ft stack height, and thus further examination was warranted.
The initial modeling omitted the plastic bending moment of the CT on the guide arch. For 1¾-in. 90-grade CT with a 0.156-in. wall, this bending moment is about 3,000 ft-lb. After the field test, it was realized that 3,000 ft-lb is significant when compared to a 14,400-ft-lb limit, so this plastic bending moment was included in the final analysis.
SIMPLE PIPE EXAMPLE
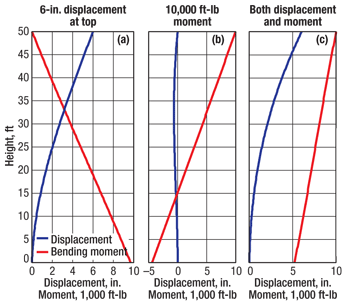
While intuition suggested that a bending moment would be positive, it was actually negative. A simple example was developed to demonstrate the effect of moments and displacements applied at the top of the injector. Consider a straight pipe of 7-in. OD and 5-in. ID that is 50 ft long and fully supported at the bottom as though it were cemented into the ground. Now imagine applying a horizontal force to the top of this pipe that causes the top to deflect 6 in. from the centerline. Figure 3a shows the displacement and bending moment along the length of the pipe for this case. This is similar to moving the hinge pin horizontally with the T-bar.
Now, consider applying only a 10,000-ft-lb bending moment at the top of the pipe, without allowing it to displace horizontally, Fig. 3b. This is similar to applying a bending moment with RBT and plastic bending, but not allowing the hinge pin to move horizontally. In this case, the bending moments in the lower portion of the pipe (where the gauge would be physically located) are negative.
Finally, imagine doing both, forcing a 6-in. displacement and applying the 10,000-ft-lb bending moment, Fig. 3c. This would happen when the bending moments are applied by the RBT and plastic bending, and when the RBT also causes the T-bar support to move horizontally. In this case, the moments are positive throughout the structure.
 |
|
Fig. 3. Displacements and moments in straight 7-in. pipe.
|
|
FIELD RESULTS
The gauge was run between the wellhead and the well control stack on a well with larger wellhead components than the one initially modeled. A series of stack deflections were performed, both on the surface and while the CT was at various downhole depths, by moving the top of the injector with the T-bar.
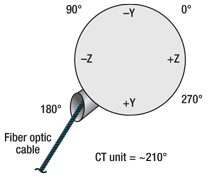
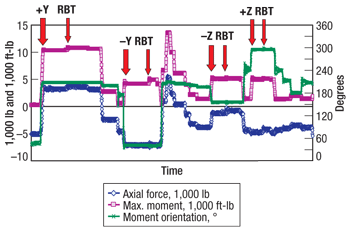
All stack deflections were performed in the same order; +Y, –Y, –Z, +Z. RBT was applied and released prior to moving the injector/intervention stack back to the centerline after each deflection. (Negative axial force indicates that the tool is in compression, and positive axial force indicates tension.) The gauge was positioned in the intervention stack such that a bending moment orientation of 210° (or +Y) represented displacement of the injector toward the CT reel. Conversely, a bending moment orientation of 30° (or –Y) would indicate that a moment was being applied by moving the injector away from the CT reel.
A bending moment orientation of 120° (or –Z) was indicative of a bending moment being applied by moving the injector to the left of the CT reel, while an orientation of 300° (or +Z) was indicative of a bending moment being applied by moving the injector toward the right of the CT reel. (The left/right orientation assumes that one was in the CT unit, looking out over the top of the reel toward the wellhead.) The fiber optic cable was connected to the gauge via the connector, which exited the gauge at 180°, Fig. 4.
 |
|
Fig. 4. Orientation of the gauge.
|
|
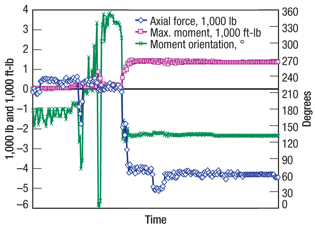
The initial values measured by the gauge are on the left-hand side of Fig. 5. The measured values are very near zero because the gauge was zeroed prior to rigging up the stack on top of the tool.
 |
|
Fig. 5. Initial rig-up measurements.
|
|
The measured axial force on the gauge increased to about –4,500 lb (compression) once the injector was connected to the top of the stack. The corresponding axial force on top of the wellhead would have been about –5,000 lb. The T-bar system was then used to apply 15,000 lb of tension to the top of the intervention stack. As a result, the axial force at the bottom quick connect increased to about 728 lb. In other words, the bottom of the stack was in compression, the top of the stack was in tension (as a result of the upward force applied by the T-bar) and the middle section contained a neutral point.
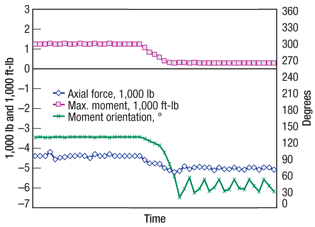
While not visible with the naked eye, the gauge measurements immediately following rig-up were indicating that the stack was being pulled slightly to the left (–Z, about 130°) as a result of misalignment between the injector and intervention stack centerline. This result was revealed when reviewing the bending moment value on the left-hand side of Fig. 6, where the bending moment was about 1,240 ft-lb.
In an effort to reduce or eliminate the initial bending moment on the stack, the T-bar support used to hold the injector was adjusted about 3 in. to the right (+Z) and, as a result, the bending moment was reduced to near zero, as shown on the right-hand side of Fig. 6.
 |
|
Fig. 6. Bending moment/T-bar re-alignment during stack rig-up.
|
|
Figure 7 contains the first of a series of stack deflection measurements recorded by the gauge. The axial force value oscillates back and forth between compression and tension, depending on the direction of stack deflection (toward or away from the CT reel). This was likely the result of the T-bar trolley support not being level. As the trolley moved along the T-bar toward the CT reel, it moved slightly up, causing tension. As it moved away from the CT reel, it moved slightly down, causing compression. This unlevel T-bar was not detected by the naked eye, nor was it included during the pre-job software modeling analysis. The maximum bending moment was observed when the stack was deflected in the +Y direction. The spike in the middle of the chart was created while trying to re-center the stack. The increase in applied RBT resulted in a slight increase of the bending moment magnitude toward the middle of each deflection; however, its impact on the overall force and bending moment was minimal.
 |
|
Fig. 7. Stack deflection series: normal T-bar weight.
|
|
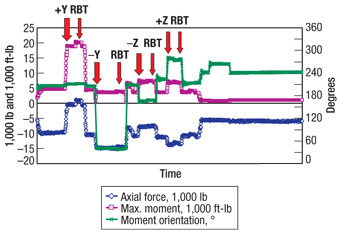
The stack deflection series shown in Fig. 8 was performed with additional weight being applied to the wellhead. Normally, the T-bar supports a large portion of the stack in an upward direction. The purpose of this portion of the test was to verify whether or not the stack bending moments increased or decreased when the axial force (weight) on the wellhead increased (or decreased). Again, when the T-bar trolley was moved in the +Y direction, the highest values of bending moment were recorded (slightly in excess of 20,000 ft-lb). This was well below the allowable working limit of 40,000 ft-lb for the 4 1⁄16-in., 5,000-psi API flanges in this stack at these low pressures.
 |
|
Fig. 8. Stack deflection series: excess T-bar weight.
|
|
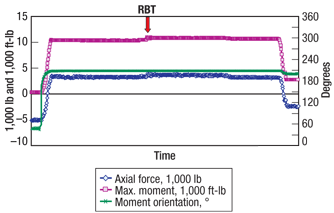
Figure 9 illustrates in detail the effect of applying additional RBT. The change in RBT caused an increase in the bending moment magnitude. At first, this increase was thought to be minimal, but after further examination it was realized that it could be as much as 3,000 ft-lb, which was considered significant when the limit was 14,400 ft-lb. Also, with further consideration, it was realized that the RBT seemed to be increasing the bending moment when it should have been decreasing the bending moment. The only explanation for this was that the change in RBT was causing some movement of the T-bar support. Before this, it had been assumed that the T-bar support was rigid.
 |
|
Fig. 9. Detailed RBT chart for stack deflection in the +Y direction.
|
|
During the intervention, the bending moments in the intervention stack were minimal. The compressive axial force increased as the CT weight increased. The orientation (direction) of the bending moment (green line) remained at or near 210° during the operation. This confirms that, during the job, the RBT gently pulled the stack slightly in the direction of the CT reel (+Y), as was expected.
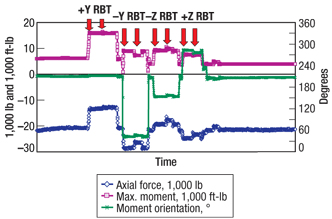
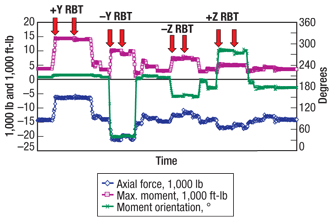
Another deflection series was run when the CT was at 10,000 ft, Fig. 10. The magnitudes of the bending moments were slightly higher due to the additional 21,000 lb of CT weight, but not as high as they had been when 14,000 lb of excess T-bar weight was applied. Figure 11 illustrates the results from a deflection series with the end of the CT positioned at 5,000 ft. They were similar to the results obtained with the CT at 10,000 ft with the exception that the bending moments were slightly smaller.
 |
|
Fig. 10. Stack deflection series with CT at 10,000 ft.
|
|
After the job, the components utilized in the original model were updated to more accurately reflect those used on the job. Based upon the QC design, it was determined that there was 0.5° of “slop,” the amount of play in the QC, which translated into 4.4 in. of horizontal movement at the T-bar from the centerline of the stack until the QC became fully rigid. This slop agreed reasonably well with the field results. The model was unable to include this slop directly, so the model was run without the slop, and 4.4 in. was added to the displacement of the T-bar. Table 1 shows the final model results for several situations. Thus, information obtained while running the gauge allowed for a better understanding of the model inputs, resulting in model output values containing greater accuracy.
| TABLE 1. Model results for comparison with field test data |
 |
MODELING OF THE 2 9⁄16-in. TREE
The analyzed results of the field test were used to model the intervention on a smaller tree, Table 2. The initial condition was obtained by iterating on the Y displacement, which yielded a moment of nearly zero at the gauge. This resulted in a moment of –670 ft-lb at the bottom of the tree. The amount of deflection was less than in the large-tree case.
| TABLE 2. Model results and limits for a 29⁄16 in. tree |
 |
Once the initial condition was established, the RBT was increased by 2,500 lb and the T-bar was moved 2.08 in. This resulted in moments that were significantly smaller than in the large-tree case.
Iterations were then done to determine the maximum deflection in the +Y, –Y and Z directions, to obtain a 14,400-ft-lb bending moment at the bottom of the tree. Again, a 4.4-in. slop was assumed because of the QC. Movements of over 10 in. could be obtained in all directions.
Similar iterations were performed with a CT weight of 20,000 lb and an RBT of 3,000 lb. These values actually increased the amount of deflection possible in the +Y and Z directions. However, the amount of possible deflection in the –Y direction decreased to 8.78 in.
 |
|
Fig. 11. Stack deflection series at 5,000 ft.
|
|
CONCLUSIONS
This work demonstrated the value of modeling an intervention stack to improve the understanding of the bending moments and forces being applied to the stack. The value of using field data to calibrate and verify the model results was also ascertained.
The T-bar support structure can be modeled accurately using primarily scenario-1 assumptions, and it does appear to provide adequate support of the well intervention stack during CT operations. The T-bar does deflect slightly when a significant change in RBT is made.
On this field test (with this particular set of field equipment), the T-bar support does not appear to be perpendicular to the T-bar support mast during the well intervention operations. Consequently, this misalignment causes variations in the axial forces dependent on the direction of stack deflection (to/from the CT reel). Despite this misalignment, the measured forces and resulting bending moments were all within the limitations of the equipment used.
Finally, the field-calibrated model was used to analyze potential intervention operations performed on wellheads with a 29⁄16-in. wellhead connector. The modeling results indicate that intervention operations with this small wellhead connector and intervention stack design can be performed while staying within the normal safety margins used by most companies. The gauge can be used to properly align the stack (to minimize the initial bending moment) and monitor stack stress if the safety margin for the intervention stack is expected to be approached during the operation. 
LITERATURE CITED
1 Smalley, E., Newman, K. and R. Stephens, “Modeling and measuring dynamic well intervention stack stress,” SPE 94233 presented at the SPE/ICoTA Coiled Tubing Conference and Exhibition, The Woodlands, Texas, April 12–13, 2005.
ACKNOWLEDGMENT
This article was prepared from SPE 121749 presented at the 2009 SPE/ICoTA Coiled Tubing and Well Intervention Conference and Exhibition held in The Woodlands, Texas, March 31–April 1, 2009.
|
THE AUTHORS
|
 |
Ken Newman is the Founder and Technical Director of NOV CTES, which is a leading provider of modeling software, data acquisition systems and specialized sensors for the well intervention industry. He is also the founder of Cormorant Engineering, which develops and markets hydraulically operated gas well dewatering systems. Mr. Newman holds a master’s degree in mechanical engineering from MIT and is a registered Professional Engineer in Texas.
|
|
 |
David Traugott is a Well Modeling Engineer for NOV CTES. He is responsible for providing software modeling analysis for client well intervention and drilling operations and also works closely with the software team to provide innovative ideas and independent software testing and validation. He holds a bachelor’s degree in electrical engineering from the University of Louisiana at Lafayette and is currently pursuing his MBA from the University of Houston at Victoria.
|
|
 |
Steve Deckert is a Staff Engineer in the Wells Group for BP Exploration–Alaska. He advises the Wells Group on well operations on the North Slope of Alaska including completion, production, intervention, stimulation and integrity. He holds a bachelor’s degree in petroleum engineering from Texas Tech University and is a registered Professional Engineer in Alaska. He is also a member of the Society of Petroleum Engineers.
|
|


