Trends in the increasingly bifurcated rig sector include the rebound of oil-directed activity relative to gas, more horizontal drilling and stacking of smaller rigs.
Bob Williams, The Land Rig Newsletter
The last few years have been a wild roller coaster ride for the US land drilling sector. There are probably a few more twists and turns ahead, but generally the land rig market will continue to stabilize through 2010 and into 2011.
The swings that have marked US onshore drilling in recent years reflect an ongoing paradigm shift that points to a bifurcated land rig market for the foreseeable future. The bifurcation manifests itself in several ways: by operator, by driller, by target hydrocarbon, by well orientation and by rig class. The realities of the US oil and gas market today dictate that these divisions will become even more sharply delineated, thanks to the game-changing impact of unconventional oil and gas drilling.
CHANGING DRILLING MARKET PATTERNS
More of the rig fleet will be dominated by bigger operators that run rigs of 1,000 hp or more in unconventional plays and that can shrug off all but the worst price slumps thanks to hedging and those prolific plays’ hefty returns. Losing ground will be a shrinking niche of small players that work low-spec rigs and that are much more sensitive to commodity prices.
Another key shift in the works is the return of parity for rigs drilling for oil. For more than a decade, gas drilling dominated the US land rig scene after being split about even with oil drilling during much of the 1990s. The disparity grew even more pronounced in recent years with the gas shale boom.
Although gas-directed drilling overall has lost market share in the past year in response to subdued gas prices, rig counts in unconventional plays have not. That’s because the frenzy that was gas shale drilling has migrated to drilling in oil shales and in liquids-rich gas shales. That shift owes to the strength of oil prices relative to gas prices in recent months.
To a great extent, gas drilling was a victim of its own success. The shale drilling boom has been a game changer, transforming the US natural gas scene from one of perceived long-term decline to lasting abundance. Early in the last decade, operators were drilling twice as many wells as they had in the past just to keep production flat. Today, operators in the hugely prolific gas shales drill half as many wells as before—yet production keeps rising—and have tapped such massive reserves that the long-promised North American LNG boom has stalled as a result.
Persistent growth in gas production, coupled with sluggish gas demand, has helped keep a lid on gas prices. That will help gas regain end-user market share overall, but the better economics found in the unconventional gas plays will force more conventional gas drilling to the sidelines absent significant increases in gas demand and prices. Rigs drilling for gas in all major unconventional plays as of July 9 totaled 566, compared with a mid-July count of 892 for all gas rigs. Unconventional plays now account for more than 60% of all gas drilling, even with gas prices still languishing below $5/Mcf.
UNCONVENTIONALS’ EMERGING DOMINANCE
The shift to unconventional plays over the last several years was underscored dramatically with the spike and subsequent collapse in oil and gas prices during 2008–2009—a dizzying reversal unprecedented in its speed and scope.
More than half the rigs in the US active fleet lay down during the steep plunge in drilling from Q3 2008 to Q2 2009 that followed the global economic collapse. However, the slump hit that part of the fleet probing for conventional oil and gas much harder than it did unconventional drilling. Unconventional plays’ share of the active rig count in fact jumped to 44% at the overall count’s trough in May 2009 from 27% at its peak in October 2008.
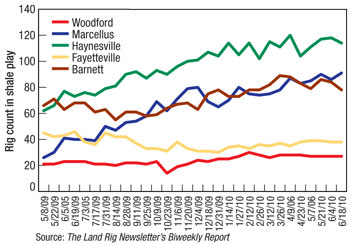
This development confounded conventional wisdom. Many analysts viewed the unconventional gas plays—the shales in particular—as high-cost plays that would buckle under the double whammy of low gas prices and persistently high operating costs. While this was true to a certain extent in some unconventional plays, especially in the Barnett Shale, some attractive new shale gas plays in fact were taking off during this period: the Haynesville Shale of northern Louisiana and eastern Texas and the Marcellus Shale of Pennsylvania and West Virginia, Fig. 1.
 |
|
Fig. 1. Rig counts in some of the major gas shale plays.
|
|
The resilience of shale drilling owed to an overriding concern of operators in these plays: the need to drill to hold the millions of acres snapped up at often-premium prices as the plays heated up. Another factor, especially for bigger companies, was the large number of term contracts—especially for newbuilds—that would cost those operators whether or not they drilled. And sustaining cash flow has always been a crucial motivator for the independents that still dominate US drilling.
The eye-popping initial production (IP) rates in the higher-cost Haynesville wells and the respectable IPs in the lower-cost Marcellus wells offered quick payouts. Operators also sought to hedge most of their production for the year while jawboning down day rates and other service and supply costs. These efforts helped to sustain rig counts while spurring a counterintuitive trend: The economics of these once-exotic plays had come to outshine those of conventional gas drilling. Even the deep wells onshore and in shallow waters along the Gulf Coast couldn’t compete with the giant IPs (double-digit-MMcfd rates have been common) that came with massive frac packages in some of the shales.
Thanks to pioneering efforts by George Mitchell of Mitchell Energy and, later, Devon Energy, industry had the key to unlocking the vast gas shale resources, and began rewriting the US gas story in earnest even amid a downturn last year. But then another major shift was in the offing.
OIL VERSUS GAS DRILLING
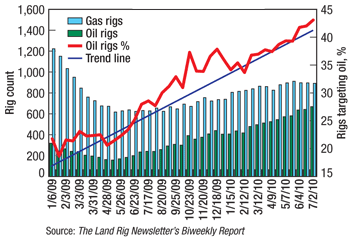
The overall combined oil and gas rig tally had reached a recent-era peak of 2,085 in early October 2008, following a recent-era gas rig peak of 1,548 the month before. At the time, the oil rig count was averaging less than a fourth of the total rig count. By the end of Q2 2010, oil’s share of the rig count topped 38%. As of mid-July, oil-directed drilling accounted for 43% of all active rigs in the US, Fig. 2.
 |
|
Fig. 2. Oil rigs as a percentage of the active rig count.
|
|
The lion’s share of the loss in rig count came in gas-directed drilling, which fell by about 1,000 units from peak in Q3 2008 to trough in Q2 2009. Many analysts predicted that the big drop in rig count would be accompanied by many shut-in gas wells and would help rebalance a sagging gas market. Even the dominant gas shales of 2008—the Barnett, Fayetteville and Woodford—saw their combined rig count drop by more than 50% during the period. But the frantic pace of drilling in the Haynesville and Marcellus largely offset that drop, limiting the decline in major gas shale drilling to about 15%.
Still, that decline—coupled with the slump in conventional gas drilling—convinced much of the analytical community that gas prices would spike again as production dropped in response to the drilling decline. Instead, gas production actually increased year-on-year in 2009, courtesy of the prolific shale wells. As a result, gas prices today are only about $1.50/Mcf above last year’s lows, which most analysts at the time expected would trigger a wave of shut-ins—but didn’t. And even that price gain is likely the result of the market banking on economic recovery in spite of soft supply/demand fundamentals.
Drillers in particular were hard hit in early 2009, as day rates plummeted by more than half, hundreds of rigs were stacked, entire fleets were idled, layoffs proliferated, and many businesses were shuttered. Rigs drilling for oil turned the rig market around in Q2 2009, when it became apparent that oil prices had set a floor around $60/bbl, even as gas prices continued to trend downward.
The confluence of sturdy oil prices and drillers desperate enough for work to sometimes take jobs that just covered their daily operating expenses sparked an uptick in oil-directed drilling. Surprisingly, the turnaround was led by the small independent producers corralling low-spec rigs to goose their cash flow again after a long drought. It helped, too, that operating costs had fallen by 30–40%, as drillers, suppliers and service companies struggled to find work.
As a result, shallow drilling expanded in traditional oil-prone areas such as the Permian Basin, where plays such as Fuhrman-Mascho Field have taken on added luster. Healthy oil prices have similarly spurred more drilling in moderate-depth Permian areas such as the Wolfberry play, a combo play involving multiple frac stages to produce low-permeability Wolfcamp and Spraberry zones. (The line on what is and what isn’t unconventional has grown increasingly blurry.)
But it was the Bakken Shale oil play of North Dakota that truly galvanized the unconventional oil drilling sector. The Bakken, which saw its rig count halved during Q2 2009 to less than 30, has since rebounded to 111 as of mid-July. With oil IPs dwarfing those of most other Lower 48 onshore oil plays, even the costly long laterals and massive frac packages endemic to the Bakken are yielding handsome returns.
In 2010, operators that had been focused heavily on gas shales realized that, with the oil/gas price ratio at roughly 16 to 1 compared with its traditional 6 to 1, it made sense to target the liquids-rich shales. That explains the spike in drilling in the Eagle Ford Shale of South Texas, which features gas, condensate and oil windows. The Eagle Ford rig count rose from a handful of rigs in 2009 to more than 60 in July, propelled by its attractive economics: liquids-richness, strong IPs, and lower cost than the Haynesville. Now, industry is turning its attention to other liquids-prone gas shale plays that are just opening up, such as the Niobrara in Colorado and the Collingwood in Michigan.
The recent pace of growth for the oil-directed rig count has it edging toward 45% of drilling in the months to come. It doesn’t seem much of a stretch to assume that natural gas demand growth will remain anemic the rest of the year while US gas production continues to increase. Given the likelihood that this will result in continued downward pressure on gas prices, it would not be surprising to see oil-directed drilling return to parity with natural gas drilling by Q2 2011.
CHANGES IN RIG FLEET AND DEMAND
Demand for certain rig classes is changing in response to the increased focus on unconventional plays and on drilling approaches in conventional areas that are inspired by the shale boom. In short, horizontal drilling is beginning to dominate rig counts. Horizontal well-focused units accounted for 52% of the total US rig count reported in mid-July, compared with 30% at the recent-era rig count peak in October 2008, 43% at the trough in May 2009, and 48% at the first of this year.
The emphasis on horizontal drilling—in particular, the long laterals many operators find so appealing to combine with multiple frac stages—increases demand for larger, higher-spec rigs. The drillers who will fare best are those marketing 1,000-hp and 1,500-hp rigs, particularly those with top drives.
Some 750-hp units are being fitted with top drives and bigger mud pumps to tackle horizontal drilling in the unconventional plays, but the operators dominating this action tend to prefer fit-for-purpose SCR electric rigs with top drives and drawworks capacities of 1,000–1,999 hp.
As for the small rigs? The downturn left many casualties among the smaller players. In October 2008, the number of private operators actively drilling in the US totaled more than 800. That tally plunged to about 240 by May 2009. It since has rebounded to only about 400–440 in the first half of this year.
That’s not to say that the days are numbered for the small rigs these operators depend on and the “mom ’n’ pop” drillers who run them. Odds are that natural gas prices won’t return to the lofty heights of 2008 for years, but as long as oil prices remain robust, there will always be a niche for the little guys—both operators and drillers.
Rig fleet changes. Further underscoring the bifurcation in US land drilling is the current state of the rig fleet itself. The available US fleet stands at about 3,000, following a boom in rig construction during the latter half of the past decade that saw more than 1,000 newbuilds added. The total is almost double the current active rig count.
A slightly less dismal metric is The Land Rig Newsletter’s “Ready Rig” count, which tallies any rig that has drilled an oil or gas well in the preceding four quarters. At 2,331 as of June 30, even the “Ready Rig”metric shows significant surplus capacity—particularly of rigs that have not worked in more than a year. Despite that overall surplus, however, dozens of newbuilds are in the pipeline, and almost all of them are 1,000 hp or greater—another indicator of how unconventional plays dominate drilling activity today.
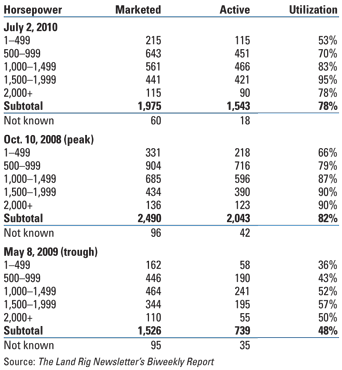
Newbuilds and day rates. Utilization numbers and day rates must both be robust to warrant another significant round of newbuilds. As a rule of thumb, utilization rates must be above 80% to warrant newbuilds. In mid-July, rig utilization rates for 1,000–1,499-hp and 1,500–1,999-hp classes were 83% and 95%, respectively. As for day rates, early results from surveys of drilling contractors point to day rate gains of 10–15% since Q1 2010. Again, the strongest showings in day rate gains are in the 1,000–1,999-hp classes. Rates are nearing their peaks of 2007–2008. In some areas, 1,000-hp units are garnering the same rates as the 1,500-hp units because of the scarcity of “the right kind” of rig to drill the unconventional plays. Some 1,500-hp rigs and even some 1,000-hp rigs in Appalachia have been reported earning $20,000–21,000 day rates—without fuel or add-ons—at the end of the second quarter. That follows a steep plunge last year that didn’t bottom out until the fourth quarter.
High utilization rates and robust day rates underscore the dominance of 1,000-hp-plus rigs on the newbuild list. Of 58 newbuilds for which horsepower data were available, about 85% were 1,000 hp or greater. (The overall newbuild total as of midyear 2010 was 85.) Sub-500-hp rig utilization continues to languish near 50% (Table 1), so these small units will see the most scrappage in 2010 and beyond while the market for 1,000-hp and 1,500-hp rigs remains tight.
| US land rig utilization by horsepower |
 |
OUTLOOK
A major wild card is the issue of health, safety and the environment. HSE concerns were already gaining momentum in the past year or so, even before the Deepwater Horizon tragedy, over the rapid acceleration of fracing activity that accompanied the shale boom. BP’s Macondo well blowout and subsequent oil spill in the Gulf of Mexico is another game-changer for the industry. It’s universally acknowledged that regulatory strictures will tighten for offshore drilling as a result. But animosity toward drilling in general because of the disaster is already spilling over into the onshore sector. The threat of onerous new regulations governing fracing practices could hinder the further growth of unconventional drilling.
On the other hand, the greatly increased risk profile for E&P in the deepwater Gulf of Mexico will certainly shift the portfolios of more large companies from offshore to new onshore resources. So even as US drilling markets continue to stabilize this year, the next 12 months could still prove to be tumultuous for operators and drillers alike. 
|
THE AUTHORS
|
 |
Bob Williams is Director of News and Analysis for The Land Rig Newsletter Group, an affiliate of RigData. He previously served as Director of Research for PennWell Corp.’s Oil & Gas Journal Research Center, after a four-year stint as Communications Editor under contract to the US Department of Energy’s National Energy Technology Center. That followed a 24-year career with the Oil & Gas Journal, where he last served as Executive Editor. Mr. Williams has a journalism degree from the University of Tulsa.
|
|


