Production increases at the beginning of 2008 were offset by cutbacks due to falling demand as the year progressed and the reality of a crashing world economy set in.
We all know what happened: The world economy turned into “The Great Recession” just as oil prices were going through the roof. When reality could no longer be denied, oil prices crashed dramatically, going from a new record of $147.27 on July 11, 2008, to a WTI crude oil spot price of $30.28 a barrel on Dec. 23—a nearly 500% range in just five months. This article fills in the rest of the numbers that resulted from this extraordinary event.
WORLD OIL PRODUCTION
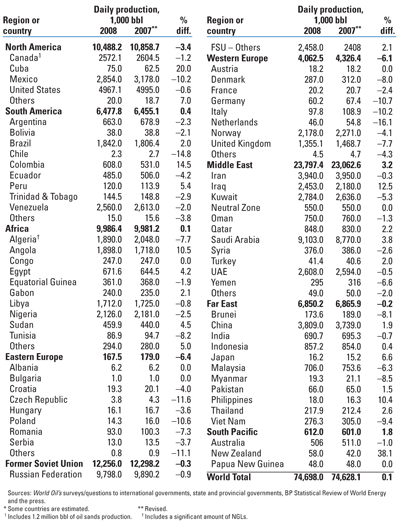
The oil production statistics that we present in February are gathered in late December and early January, making the last few months of the year an educated guess. In late 2008, prices, demand, and the resulting production were all in freefall. So we gathered the now-revised numbers for 2007 and 2008 for an updated comparison, as we always do this time of year. Global production of crude and condensate rose 0.1% in 2008 rather than the 0.3% we presented in February. In most cases, revisions in the individual countries were equally small. It should be emphasized that while “crude and condensate” has been a traditional and consistent measure of oil production, it no longer tells the complete story. There are about 750,000 bpd of biofuels produced, plus another 11 million bpd of NGLs, plus 2.2 million bpd of refinery gain—a “swelling” or density-lightening process that results from modernizing refineries worldwide so that heavier crudes can be upgraded into lighter products.
As 2009 progressed, sustained OPEC cuts help stabilize oil prices near the $70-per-barrel range. As always, internal compliance with OPEC quotas is key, but the members generally seem to be cooperating for now, with the cartel saying compliance is between 70 and 90%, although according to the Paris-based International Energy Agency (IEA), it is currently producing about 1.28 million bpd over its stated 24.85 million-bpd output target (including all liquids). Global all-liquids supply is down by 2.6 million barrels a day as of July of this year compared to year-ago levels, almost entirely due to OPEC crude production cuts (although NGLs are fluctuating upward).
In its August Oil Market Report, the IEA estimates that global demand fell 0.3% in 2008, and forecasts it to fall another 2.7% this year. Growth above 1% is forecast for 2010; however, it should be noted that these forecasts change often, sometimes monthly; recent forecasts of demand, dismal though they may be, have been revised upward a few times this year. Together, 2008−’09 will be the first two-year period of negative demand growth since 1982. All regions appear to have bottomed out in terms of industrial production—albeit not by much—except the US, which is expected to turn the corner in the third quarter this year.
Inventory levels of crude remain stubbornly high in general, although there have been some volatile buildups and draw-downs in North America. The IEA says that OECD countries have been relatively soft in oil demand—with prevailing weakness remaining the key feature. European demand contraction widened to 0.9 million bpd in second-quarter 2009. Early US July gasoline demand stood 1.8% below 2008 levels, after a decline of 1.6% in June.
World crude/condensate production by countries,
2008 and 2007* |
 |
RESERVES
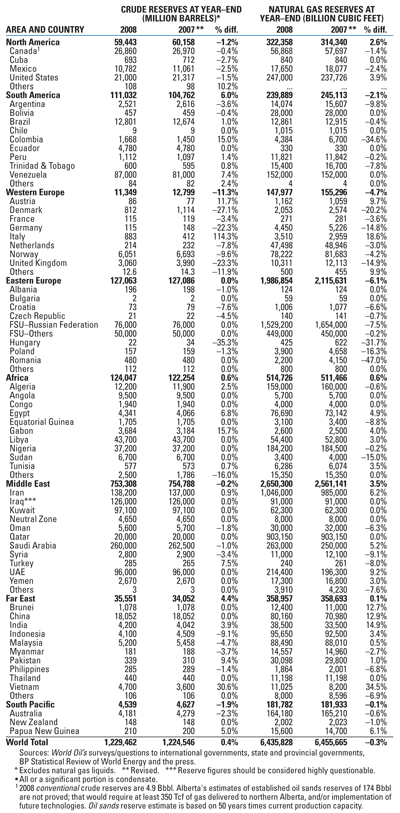
Global reserves didn’t change much in 2008, in part because there were no discoveries of such magnitude that they would swamp depletion due to production. Brazil, of course, made some major discoveries in the pre-salt, and has added about a billion barrels of reserves in the last two years while producing nearly 2 million bopd. Presumably more reserves will be booked soon. Gabon and Uganda are other areas with billion-barrel-plus discoveries.
We continue to discount Canada’s claim of 174 billion barrels of proved reserves, in part because it will require about 350 Tcf of gas to be delivered to the Fort McMurray area, as well as take nearly 400 years to produce. Similarly, we have traditionally discounted Venezuela’s earlier claim of 78 billion barrels (down to 52 billion), which is now claimed to have grown to 99 billion barrels, despite faltering production. Still, the country is actively planning on developing more of its Orinoco Belt extra-heavy oil reserves, so we added 35 years of the production that is likely to occur there to last year’s reserves. 
| Estimated proven world reserves, 2008 versus 2007 |
 |
Editor’s note: Normally, we would be presenting world drilling and its breakdown (dry, oil, gas, etc.) as well as the number of wells naturally flowing and those on artificial lift. Regrettably, the number of responses to our surveys has fallen to a new low, perhaps because of job loss or departments operating on shoestring budgets. We will reinstate those numbers when we can get a better data set.
|


