A practical approach is presented for comparing the actual path of a directional well with the original well plan.
Chimere O. Nkwocha, Geopro Technology Limited, UK
Traditional performance metrics tend to relate drilling performance to the final cost of the well. Thus, decreasing unit drilling cost is considered a reflection of performance improvements. These benchmarking methods are based on cost exposure as measured by nonproductive time, cost per barrel of oil expected, cost per foot, and cost per 1,000 ft or 10,000 ft drilled.1–4 These benchmarks are difficult to normalize, taking into account other inherent and prevalent factors such as drilling environment, geological formations and their peculiarities, and optimum well production objectives.
In the case of directional drilling expertise and performance, the cost-based approach is also further developed into a new concept called market share, here used as a means of validating superiority over the competition rather than a true representation of competence. That a company may improve market penetration through more competitive pricing, readiness to mobilize and/or presence in the market, rather than superior expertise and performance, is sometimes overlooked. As a result, operators continue to cyclically change contractors on a global scale. Operators are eager to drive costs down, and at the onset of contract/tender evaluation, they only have a few values that they can use to select a contractor based on their pre-defined selection matrices. It is therefore expected that once a directional drilling contractor is able to establish its presence within an operator, the continuation of the business relationship indefinitely is assumed. But this seldom occurs, mainly because the operating climate changes and the realities of contractual requirements, logistics, maintenance schedules, etc., take their toll on the project, and performance ultimately tends to dip after stabilization. There are other factors besides these that will invariably have the same results.
Previous attempts to provide adequate directional drilling performance and benchmarking factors have been suggested, such as the directional Drilling Difficulty Index (DDI) proposed by Oag and Williams.5 A closer look at the derivation of DDI shows that it is both ambiguous and difficult to use. And in most cases it only seems to have applicability where all the wells are drilled from the same platform/cellar to about the same TVD.
Ultimately, the reason for drilling directionally is to create a well that matches the well plan as closely as possible. Therefore the plan represents the perfect well. This article offers operators and directional drilling contractors a means of evaluating performance purely as a reflection of directional drilling competency. This method is based on the assumption that the planned and approved well path is the most appropriate well path to meet both the geological and the drilling objectives. Traditionally, tortuosity variations have been used to establish directional driller compliance to the well path, but this measure is difficult to use and, sometimes, even to understand. Basically, tortuosity should equal the final inclination in a perfectly drilled well, i.e., in comparison with the plan. However, in other wells it is a growth factor from point to point.
DERIVATIONS
Standard directional survey files contain the following headers:
• Measured depth
• Inclination
• Azimuth grid
• TVD
• Subsea TVD
• Vertical section
• North–south grid north
• East–west grid north
• Closure
• Closure azimuth
• DogLeg Severity (DLS)
• Magnetic/gravity tool face
• Tortuosity
• Directional difficulty
• Walk rate.
The first three listed parameters are the only parameters that are physically measured, while the rest are derivatives of these measurements. Based on these factors, we define the parameters, A, B, C, D and E, where:
• A is the TVD/MD factor
• B is the closure factor, with closure defined in the survey sheet/calculation
• C is the inclination factor
• D is the Build-Up Rate (BUR) factor
• E is the target tolerance factor.
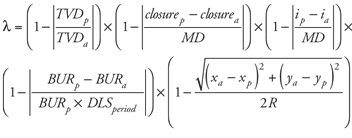
For E > 0, we define the performance factor, λ, as:

Eq. 1
or, with better-defined parameters:

Eq. 2
In this equation:
• BUR is the build-up rate in °/period
• i is the inclination
• x represents the easting offset from the surface coordinates at a given point along the well
• y represents the northing offset from the surface coordinates for a given point along the well path
• R is the target tolerance radius
• Subscripts a and p represent actual and plan, respectively.
If for any reason E < 0, which can only result from the entire well being drilled outside of the tunnel defined by the target tolerance from surface to geological objectives, then:

Eq. 3
The values for A, B, C, D and E can be calculated from their respective expressions shown in Eq. 2.
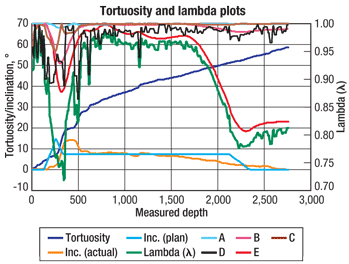
The value of λ at any given point in the well should be a factor between 0 and 1, where 0 is the lowest possible performance and 1 is the best performance, representing a well that exactly represents the plan. A value of λ can be calculated at every survey period defined by the DLS; e.g., a DLS measured in °/10 m or °/30 m means that l should be resolved every 10 m or 30 m, respectively, and the cumulative average over the course of a well becomes the directional drilling performance index for that well. This value is the DLSperiod in Eq. 2. Figure 1 shows tortuosity and λ variations for a given well. The average value of λ for the entire well is 0.895, which is represented by:

Eq. 4
In Eq. 4, the very first survey (at surface) or the survey at the tie-in point will automatically be attributed a value of 1 since plan and actual parameters for A, B, C, D and E at that point are the same. The value for n is equal to the number of survey stations/interpolations used for the calculations. The best approach will be to interpolate the surveys to ensure that all the parameters used to compute λ are carried out at the same MD for both the planned and actual well paths.
 |
|
Fig. 1. Variation in several parameters, including tortuosity and l, during the drilling of a directional well.
|
|
BENCHMARKING
Benchmarking can be achieved in two ways. Either a) the average λ for each specific well can be used to rank a specific project; or b) an arbitrary value for λ can be required, and each of these values can therefore be compared to this value using the benchmark parameter γ, defined by:

Eq. 5
where D is the measured depth, subscript B represents the base value for comparison, and subscript N represents the current well value used in the benchmarking calculations.
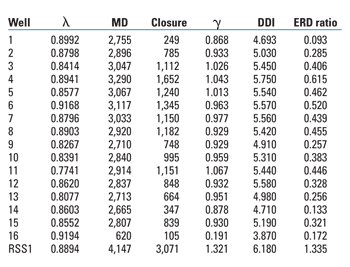
Table 1 presents an example of wells drilled from the same cluster. All wells have been drilled directionally and are similar in design except for one Rotary Steerable System (RSS) well with a long stepout.
We define benchmark reference values for λB and DB as 0.85 and 3,000 m, respectively. This means that, for a well drilled to 3,000 m, the client expects to achieve a minimum average λ of 0.85. This relationship is used to derive the values for γ shown in Table 1.
| TABLE 1. Drilling data for example well cluster |
 |
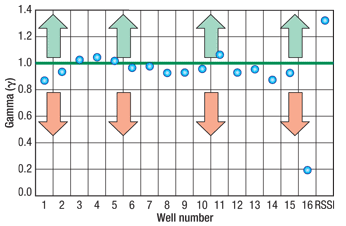
If we base our determination solely on λ, then wells 6 and 16 seem to be the best wells, followed closely by wells 1, 4, 8 and RSS1. But once the concept of benchmarking is introduced and γ is added as a reference, wells 16, 6 and 1 suddenly don’t look as good anymore, Fig. 2. The reason is that the impact of measured depth becomes evident, as we will expect the deeper wells to pose more difficulty, especially with increasing stepouts and other complicating factors. Therefore, γ shows that the best well is essentially well RSS1, with well 16 being the worst, followed by well 1. Well 16 is also the shallowest, as it was abandoned at about 620 m. Directionally, it appeared excellent using λ, but not when one factors in the comparatively low level of difficulty expected for such a shallow well. This does not mean that the well was badly drilled, but at that depth you will expect to stay very close to the ideal scenario. The benchmark parameter γ offers a level of utility that DDI does not, because it allows us to compare the levels of difficulty posed by different wells.
 |
|
Fig. 2. Benchmark parameters for the example well cluster.
|
|
OTHER APPLICATIONS
Besides benchmarking a well, λ can also be used for establishing directional driller competency. Returning to Fig. 1, see how λ dips between 1,500 m and TD. Using the actual inclination as a control, it is seen that the directional driller drifted away from the well plan around 1,200 m of MD, and only returned to it near TD, resulting in the upward movement of the λ curve.
Using this technique, potential key seating areas due to poor directional control can be identified, and ultimately the total average value of λ or γ for a specific directional drilling contractor can be used for contractual purposes, monitoring and compliance evaluation by operator drilling department personnel. Ultimately, this will help resolve issues related to nonperformance in future wells.
FURTHER DEVELOPMENT OF THE THEORY
This concept will need to be developed for targets with irregular shapes and for well placement operations. We have only considered circular targets with the well plan intercepting the center of the target. A consideration for well placement initiatives could be the use of net-to-gross ratios. The problem will be determining what constitutes net with respect to reservoir producibility. This will need to be established from the onset by the geologist and the well placement teams. 
LITERATURE CITED
1 Limmus, J. L., “Drilling optimization,” Journal of Petroleum Technology, November 1970, pp. 1379–1388.
2 Azar, J. J. and G. R. Samuel, Drilling Engineering, PenWell, Tulsa, Okla., 2007.
3 Bourgoyne, A. T. et al., Applied Drilling Engineering, 1st Ed., SPE Textbook Series, 1986.
4 Devine, L., Ellis, M., Scotchman, A., May, N. and S. Connell, “Systematic team approach to drilling optimization reduces well construction time by 15%, Ghadames Basin, Algeria,” SPE 74522 presented at the IADC/SPE Drilling Conference, Dallas, Texas, Feb. 26–28, 2002.
5 Oag, A. and M. Williams, “Directional drilling difficulty index: A new approach to performance benchmarking,” SPE 59196 presented at the IADC/SPE Drilling Conference, New Orleans, Feb. 23–25, 2000.
|
THE AUTHOR
|
 |
Chimere Nkwocha holds bachelor’s and master’s degrees in engineering, both from the University of Port Harcourt, Nigeria. He has worked in well operations and production enhancement for the past 19 years. He worked for Schlumberger for 10 years, including as Drilling Engineering Manager for the Drilling and Measurements segment in the Russia Land region. In April 2009, he formed Geopro Technology Limited, a UK-based company, to provide tailored drilling optimization services and premium drillbits primarily to the African market.
|
| |
| |
|
|


