US gas: Demand, supply and reserves
Demand for natural gas is rising while production of conventional natural gas is shrinking. Production of unconventional gas is growing, and combines with imports to fill the gap.
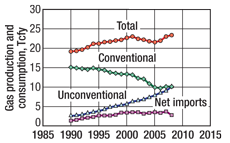
Demand for natural gas is rising while production of conventional natural gas is shrinking. Production of unconventional gas is growing, and combines with imports to fill the gap.H. C. Juvkam-Wold, Texas A&M University, College Station, Texas Are sources of natural gas adequate to supply growing US demand? How important are the unconventional sources: tight gas, shale gas and coalbed methane? Can we expect to continue to import large quantities of gas from Canada? Can imports of liquefied natural gas continue to rise? What about methane hydrates? We evaluate past and current production and, where possible, future reserves of gas from various sources. We discuss replacing shrinking US supplies of conventional natural gas, currently providing 43% of demand, with the alternatives listed above. The US Energy Information Administration (EIA) estimates that 44% of current gas needs are provided from unconventional sources.1 Another 13% comes from imports. How might this change in the future? In this article we also present, and where appropriate apply, a method of estimating gas reserves using purely historical production data. It is based on a method pioneered by the famous M. King Hubbert.2 This method makes no assumptions concerning prices, geology, politics, technology, ultimate recoverable gas or reserves growth, and yet we believe that the estimates are realistic. The technique is basically the same as one applied to evaluate oil reserves in a previous World Oil article.3 INTRODUCTION Since 1987, US consumption of natural gas has exceeded US production.1,4 The gap between the two has been closed by importing natural gas by pipeline, and by ship in the form of Liquefied Natural Gas (LNG). The largest single component of supply is conventional natural gas, but this has been dropping steadily, and now supplies only 43% of the total.4,5 The second-largest component is tight gas, now supplying 29% and growing rapidly. The third-largest component is gas imported by pipeline, 12%. Single-digit components of coalbed methane, shale gas and LNG complete the picture. Recent trends in the contributions from each component of gas are shown in Fig. 1. Unconventional gas production has quadrupled in the last two decades.
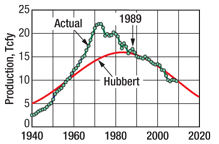
CONVENTIONAL NATURAL GAS Figure 1 shows that US conventional gas production has been steadily decreasing, from 15 Tcf/year in 1990 to about 10 Tcfy in 2008. Historical gas production vs. time tends to follow a bell-shaped curve. An example is US conventional gas production, Fig. 2.1,4 This plot does not include gas from unconventional sources. The red curve in Fig. 2 is a logistic distribution. The equation for this curve is the derivative of the logistic curve used by M. King Hubbert. The derivative curve is P = dQ/dt, where:
and where P is the natural gas production rate (Tcfy); Pm is the production at peak (Tcfy); t is the time or reference date, in years; tm is the year of peak production; b is the factor describing the slope (Tcfy); and Q is the cumulative production (Tcf) at time t. The theoretical Hubbert curve fits production data reasonably well after there are sufficient long-term data. After the actual production reaches a maximum, when about half the gas has been produced, the data tend to follow the theoretical curve fairly closely, since 1989 in this case. From this plot, it is not immediately obvious what future production will be, especially if there is a fair amount of data scatter. Figure 2 suggests that, by 2020, conventional gas production may have decreased to 7 Tcfy.
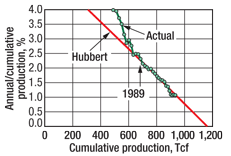
We can re-plot the production data in a way that tests whether it fits the Hubbert theory and indicates when an acceptable fit started. Figure 3 is a plot of the ratio of annual production to cumulative production on the y-axis vs. cumulative production on the x-axis. The plot shows the annual growth rate of cumulative production. In Fig. 3, we also show the linear logistic projection (red). A good fit to the Hubbert theory started in 1989.
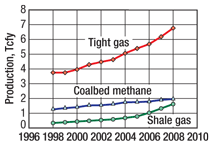
When this line reaches the x-axis, the production rate has dropped to zero, and we have an estimate of the ultimate cumulative production, which, for conventional gas, is nearly 1,200 Tcf. If we are lucky enough to find a large new conventional gas field in the US, the plot would, of course, change, but so far the data have followed the Hubbert line for about 20 years. According to Fig. 3, the US has produced about 930 Tcf of conventional gas to date, and has about 230 Tcf to go. UNCONVENTIONAL GAS The share of US unconventional gas production increased from 28% of total production in 1998 to 46% in 2007.6 Figure 1 shows that production has grown steadily and now is roughly equal to that of conventional gas. We shall split unconventional gas into three categories: tight gas, shale gas and coalbed methane. The increased production of unconventional gas has approximately compensated for the decrease in conventional gas, so total production of domestic gas has been fairly steady, except for an obvious uptick in the last few years. Exceptionally high gas prices led to high rig counts that, in turn, resulted in more drilling and the recent high production. Figure 4 shows the production rates of US unconventional gases. Tight gas is by far the largest of the unconventional gas categories, totaling almost 7 Tcfy and supplying 29% of US demand. One definition of tight gas is gas in low-permeability rock, usually sandstones. Tight reservoirs require horizontal wells or hydraulic fracturing, or both, to enable commercial production. Tight gas is on the growing part of the production curve and has potential for further growth. The Rocky Mountains region provides about 45% of tight gas production. Another 35% comes from the Gulf Coast. The Rockies surpassed the Gulf Coast in 2003. Shale gas production is about 1.7 Tcfy and provides 7% of US demand. As the name suggests, shale gas is produced from shale rock, and horizontal wells and/or hydraulic fracturing are required here also. Figure 4 suggests that the growth rate of shale gas is in its exponential phase. By far, the largest contributor to shale gas production is the Barnett Shale in the Fort Worth Basin, with 2008 production of 1.4 Tcf.7 Between 1993 and 2008, the Barnett produced 5.0 Tcf. Remaining reserves may be close to 26 Tcf.6 We do not believe that the current 32% rate of growth of production is sustainable, especially at present gas prices (around $4 per million Btu). Some estimate that $6 or more may be necessary.8,9
The Haynesville Shale in northwestern Louisiana and East Texas is a bright spot in the current gas market. Reportedly, initial production rates of 15–20 MMcfd are the norm.10 A drawback is that first-year decline can be as much as 65–80%. Technically recoverable gas is estimated to be 34 Tcf. With well costs of $7.5–$9.5 million per well drilled to depths of 11,500–15,250 ft, the Haynesville may require $6–$8 per million Btu to be economic.8,9,11 There are more than 20 shale plays in the US. Some estimate that production from the big seven may reach 10–14 Tcfy by 2020.6 This estimate may be too optimistic.8 Coalbed methane refers to methane that is adsorbed into the matrix of the coal. Some free gas may be found in cleats in the coal. This methane has been a hazard in coal mining, but recently it has become a welcome source of natural gas. Figure 4 shows that CBM production is not growing as fast as the other unconventional sources. Production has not yet reached the 50% (peak) point. Present production is 2.0 Tcfy, or 8% of demand. In 1985, the production was only 0.01 Tcfy. About 80% of CBM has come from the San Juan and Powder River Basins in the Rocky Mountain region. Over the last decade, CBM production increased 38%. Methane hydrates are sometimes mentioned as a future source of unconventional gas. They do represent a huge potential resource, but commercial production will not occur for a long time.12 With no production data, no Hubbert analysis can be made. It is also too early to perform a reliable Hubbert analysis on the other unconventional sources. This is because, in every case, the production rate is still small, and is far from the midpoint or “peak” production rate. In Table 1, we show some early estimates of unconventional gas reserves from various sources. Note that these are technically recoverable resources, not necessarily economically recoverable. Reported reserves tend to grow with time as more discoveries and developments are made. A 2007 study based on a variety of sources came up with mean reserves of 274 Tcf for shale gas, 118 Tcf for tight gas and 88 Tcf for CBM, for a total unconventional reserve of 480 Tcf.6 The same study lists conventional gas reserves at 294 Tcf.
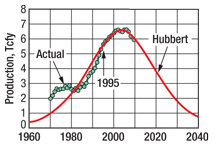
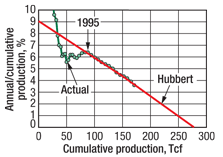
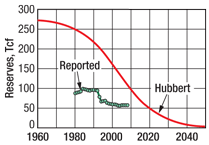
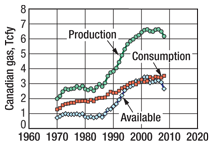
As an example of the uncertainty in predictions of production, in 1996 the EIA estimated that the production of unconventional gas in 2005 would be 2.5 Tcf.1 In 2000, the estimate was for 2005 production to be 4.9 Tcf. As late as 2004, the estimate was 6.1 Tcf. Actual production in 2005 was 8 Tcf. PIPELINE IMPORTATION Imports from Canada dominate this category. Current net imports are about 3 Tcfy, meeting 12% of US demand. This rate represents close to 50% of Canada’s shrinking production. We apply the Hubbert analysis to show what the future is likely to hold for this category. Canadian production peaked at 6.6 Tcfy in 2004, and was 5.9 Tcfy in 2008, Fig. 5. Figure 6 shows the growth rate of cumulative production. The indicated ultimate cumulative, where the red line intersects the x-axis, is 280 Tcf. The data fit the Hubbert theory for the 13 years from 1995 to 2008. Cumulative production at the end of 2008 is 170 Tcf, so the present Hubbert reserves are 110 Tcf. The production data have followed the straight line very closely over the past 13 years. Figure 7 shows the remaining reserves of Canadian gas as a function of time. Note that the reported official estimated reserves of 60 Tcf are significantly lower than the Hubbert reserves of 110 Tcf. Figure 8 shows trends in Canadian gas production and consumption. Production has peaked, while consumption is still increasing. With shrinking production and increasing demand within Canada, it seems unlikely that US imports from this source can be increased, or even maintained. A factor that may change this picture over the long term is that Canada reportedly has substantial resources of shale gas.
IMPORTATION OF LNG We have a number of sources of imported LNG. About 75% comes from Trinidad, a source favored by its relatively short transportation distance to the US. That country’s gas production is still increasing, so imports of LNG from this source can grow. The other LNG exporters to the US have ample supplies of gas and increasing production, so US importation of LNG will not be limited in the near future by a shortage of resources. Other possible limitations, such as transportation vessels and regasification terminals, can be overcome by time and higher prices. US import prices of LNG over the past two decades have closely followed the domestic gas price. Japan, the world’s largest LNG importer, has paid somewhat higher prices. Its imports are nine times the size of LNG imports into the US.4 SUMMARY Even though US production of conventional gas is rapidly decreasing and demand is increasing over time, the production of unconventional sources of gas has grown fast enough to keep total production fairly constant. Any remaining gap between supply and demand has been met by imports via pipeline from Canada and by ships carrying LNG. The potential for increases in gas from Canada looks limited unless that country has a large source of untapped shale gas; however, further LNG imports look promising. Countries supplying LNG have growing production and ample reserves. We have demonstrated a robust theory for evaluating gas reserves based purely on historical production data. The technique was pioneered by M. King Hubbert, and was later explained and expanded by Kenneth S. Deffeyes, professor emeritus at Princeton University, whose work explains the approach used in Figs. 2 and 3.13 The procedure works especially well when applied to a large region where substantial drilling and production have been done, and where the production has reached its peak. The process is not applicable to single wells or fields, or to small areas where production is just beginning. We show that it works well for conventional US gas and for Canadian gas. No assumptions about future discoveries or improved technologies are made, and the concept of reserves growth plays no part. The technique is not yet applicable to evaluation of unconventional gas sources because they are still too early in their production history.
ACKNOWLEDGMENT The author would like to thank Dr. A. J. Dessler for stimulating discussions and many useful suggestions. LITERATURE CITED 1 Energy Information Administration website, www.eia.org. Procedure for calculating gas reserves Step 1: Plot historical gas production vs. time. Select the best-fitting logistic distribution to the production data. Step 2: Plot the ratio of annual/cumulative production vs. cumulative production. On this plot, the correlation from the Hubbert equation follows a straight line. When this line intersects the cumulative production axis, we will have reached ultimate cumulative production. Step 3: Subtract the cumulative production at any time from the ultimate cumulative production to find the remaining (Hubbert) reserves. The ultimate cumulative production is the total gas that we expect to obtain from the region in question; in other words, it represents the reserves at time zero.
|
|||||||||||||||||||||||||||||||||||||||||||||||||||||||||
- Prices and governmental policies combine to stymie Canadian upstream growth (February 2024)
- U.S. producing gas wells increase despite low prices (February 2024)
- U.S. drilling: More of the same expected (February 2024)
- U.S. oil and natural gas production hits record highs (February 2024)
- U.S. upstream muddles along, with an eye toward 2024 (September 2023)
- Canada's upstream soldiers on despite governmental interference (September 2023)

