Comparative analysis shows that a digital core and a real core compare favorably when digital and real experiments are run.
Bill Sharp, Dave DesAutels, Garwin Powers and Robert Young, Noble Energy Inc.; Stuart Foster, Elizabeth Diaz and Dr. Jack Dvorkin, Ingrain
In trying to evaluate and model a rapidly expanding inventory of US and international discoveries, Noble Energy initiated a project that used Ingrain’s digital rock physics technology in March 2009. Noble Energy saw a competitive advantage in using the new approach in quickly determining reservoir parameters and rock properties. Proprietary micro-CT scanning technology was used to image and segment samples from a deepwater clastic Miocene reservoir in order to compute rock properties. The computed rock properties included porosity, absolute permeability, formation factor and relative permeability. The digital modeling process took only 30 days to complete.
THE COMPARATIVE EXPERIMENT
The digital rock physics experiment includes three main processes. The first is 3D imaging of a small rock fragment at a resolution required to clearly discriminate between pores and mineral matrix, as well as to discriminate among the minerals comprising the mineral matrix. Such images are represented in the computer by a gray scale (e.g., zero to 255). The second process is segmenting this raw 3D image to digitally define a finite number (much smaller than 256) of the elements of rock, specifically porosity and basic mineral components. The output is a digital reservoir rock called “vRock.” The final processes are 3D computer simulations of single and multiphase fluid flow for absolute and relative permeability, respectively, electrical current flow for resistivity, and formation factor determination.
The digital modeling can be performed on regular core material and on rock fragments unsuitable for a conventional physical laboratory, such as sidewall cores and drill cuttings. The latter capability is extremely important due to the difficulty of extracting core from deviated wells and because it is currently not possible to extract from slimhole wells. Moreover, such digital experiments are repeatable (often unlike physical special core analysis) using exactly the same digital reservoir rock. In addition, the conditions of these experiments are easily modified to reflect the changes in pore fluids occurring during production, the most important being wettability and viscosity.
Physical samples. Twelve samples were selected, of which nine consisted of end trims from core plugs. The remaining three samples were selected from sidewall cores. Based on the initial analyses of porosity, permeability and formation factor, three samples were then selected for special digital core analysis to compute the relative permeability curves.
Figure 1 shows one of the selected samples examined by micro-CT scanning. Figure 1a is the chair display of the raw 3D volume, Fig. 1b shows its three axial slices, and Fig. 1c is a single 2D slice of the segmented image with the pore space, bitumen and quartz grains identified based on variations in density as seen by micro-CT scanning. The digital 3D volume of any sample allowed fly-through rendering to understand the fabric, texture and nature of the grain contacts within that sample.
 |
|
Fig. 1. Raw 3D image (a), axial slices (b), and 2D slice of the segmented image with its components identified (c).
|
|
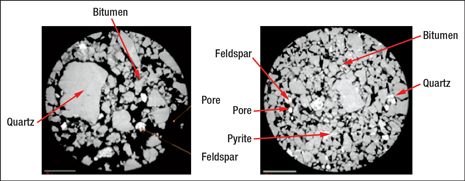
Figure 2 displays 2D slices of two other samples where pores, bitumen, quartz, feldspar and pyrite were identified.
 |
|
Fig. 2. A 2D slice of two segmented images with rock components identified. These samples are different from that displayed in Fig. 1.
|
|
Computing. Once the segmentation had rendered the virtual rock volume, connected and disconnected porosity were quantified. Once determined, only the connected pore volume was used to derive absolute permeability in three principal directions for these samples. The formation factor was also computed in the three principal directions for these samples.
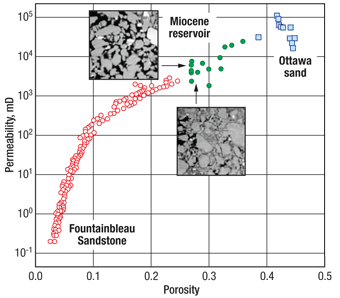
A cross-plot of computed absolute permeability vs. the connected porosity is shown in Fig. 3. The reservoir’s porosity and permeability are both very good. QC procedures evaluate the plausibility of computed data by comparing the results to existing lab measurements. The QC results are also displayed in Fig. 3, where the permeability-porosity trend obtained in the Miocene reservoir sand is compared to the classic Fontainebleau Sandstone data, as well as to data obtained on an unconsolidated Ottawa sand with varying grain size. The Miocene reservoir sand trend fills the gap between the two laboratory data trends and qualitatively continues the Fontainebleau data into a higher-porosity range, eventually connecting to the Ottawa sand data at the high-porosity end.
 |
|
Fig. 3. Permeability vs. porosity in the Miocene reservoir (black circles) compared to the Fontainebleau trend (gray circles) and Ottawa sand data (gray squares). Shown also are 2D slices of a lower-porosity/higher-permeability sample and a higher-porosity/lower-permeability sample.
|
|
The computed permeability-porosity trend in the Miocene reservoir exhibits more scattering than the Fontainebleau Sandstone trend. A potential reason is variation in grain-size sorting within the Miocene reservoir sand. The Fontainebleau is a well-sorted sandstone, while the Miocene reservoir sand exhibits poor to moderate sorting. The two 2D slices shown in Fig. 3 demonstrate the relationship among sorting, porosity and permeability within the samples. The porosity and permeability derived by the proprietary digital analysis were comparable to those obtained by traditional methods.
Special core analysis. A two-phase oil/water flow was simulated to arrive at relative permeability curves. Noble selected three digital rock files from the 12 samples that had in situ reservoir fluid properties previously obtained by lab measurements. All fluid-flow properties were computed using propriety algorithms that incorporate fluid properties and the digital reservoir rock. The relative permeability behavior is quite typical for this type of sediment. The relative permeability data from the digital process confirmed what had been used in Noble Energy’s reservoir model.
CONCLUSION
Noble Energy used micro-CT scanning technology and Ingrain’s proprietary algorithms to quickly obtain more accurate measurements of porosity, permeability, formation factor and relative permeability. These results confirmed the data in Noble’s reservoir model—that is, a deepwater clastic Miocene reservoir. The entire analysis from sample selection to reporting of analytical results was achieved in 30 days. Rapid turnaround allows for information that is more accurate to be used as inputs; thus, a better reservoir model can be created.
Digital rock physics can be conducted on regular core material and on rock fragments unsuitable for conventional physical laboratory experiments, such as sidewall cores and drill cuttings. This flexibility to analyze reservoir data rapidly from multiple potential sources should allow Noble Energy to enhance its reservoir models. 
|
THE AUTHORS
|
| |
Bill Sharp is a Senior Geological Advisor for Noble Energy Inc. and has been with Noble Energy since 1992.
|
|
| |
Dave DesAutels is Manager, Development, Geoscience for Noble Energy Inc., residing in Houston. He is responsible for worldwide geoscience operational efficiency, cost management, best practices, staffing and field exploitation performance improvements. Prior to joining Noble, he was in field exploration in Qatar, Indonesia and Colombia.
|
|
| |
Garwin Powers is a Senior Petrophysical Advisor at Noble Energy Inc. He started his career over 25 years ago at Amoco Production Co. and worked for several major oil companies before starting with Noble.
|
|
| |
Robert Young, Senior Reservoir Engineer, started working for Noble Energy Inc. in 2001.
|
|
| |
Stuart Foster has been an Account Executive with Ingrain since 2008. Prior to joining Ingrain, he worked for BJ Services’ pressure pumping division in Houma, Louisiana.
|
|
| |
Elizabeth Diaz is Chief Geoscientist at Ingrain. She earned an MS in geophysics from Stanford University. Experienced on multiple exploration and appraisal projects worldwide, she previously worked for Occidental Oil & Gas and Shell International Exploration and Production.
|
|
| |
Dr. Jack Dvorkin is Senior Research Scientist at Stanford University and Advisor to Ingrain. He is one of the company’s founders.
|
|


