What's new in production
New produced water study: Where it comes from, where it goes
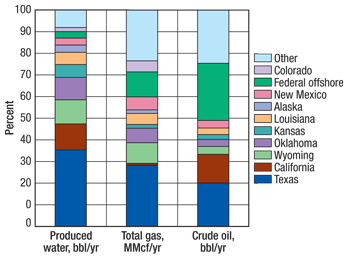
New produced water study: Where it comes from, where it goes Over the past decade or so, several estimates have been thrown around for the amount of produced water that comes with each barrel of oil extracted. Globally, an average Water-Oil Ratio (WOR) of 3 bbl water/bbl oil has been proposed.1 Limiting the scope to the US, estimates of average WOR have ranged as high as 9.52 and as low as 7.3 But until now, these numbers don’t seem to have been based on much in the way of hard data. Nevertheless, these US estimates have come pretty close to the mark, according to a new report prepared by the Argonne National Laboratory for the US Energy Department. The report places the national onshore average at 7.6 bbl of produced water for each oil barrel, equivalent to an 88% average watercut.4 That number does have data behind it: The researchers compiled the most comprehensive information to date on US produced water volumes and management practices, from surveys sent to state agencies in the 31 oil- and gas-producing states, as well as the federal Minerals Management Service, Bureau of Land Management and Environmental Protection Agency. However, only 14 of those states provided data segregating their produced water into gas-associated and oil-associated volumes, which means that the WOR estimate represents less than half of oil- and gas-producing states. States that didn’t segregate data by production type include Texas and Oklahoma, which have large numbers of stripper wells producing in mature fields, where watercuts are higher. If data from these states had been included, the WOR would likely have been substantially higher. Adding in offshore activity has the opposite effect. Federal waters produce more oil than any state—467 million bbl in 2007, nearly 27% of the US total—but only 3% of the country’s produced water (see figure). And federal offshore activities produce only 1.04 bbl of water per oil barrel, which drops the average WOR for the US to 5.3.
For the most part, the lower watercuts experienced offshore are a simple economic matter; large volumes of produced water are generally more expensive to manage offshore, so wells are abandoned far earlier in their production life than a comparable onshore well. Minimizing offshore water production can be accomplished with new technologies, such as subsea interventions and intelligent wells—specifically, multizone completions equipped with sensors and shutoff valves. These allow higher hydrocarbon outputs while keeping water from entering the production string. The technological contribution to low offshore watercuts will grow as these systems become cheaper, more widely used and more advanced. Once it’s on the surface, in general, there are two options for produced water management: a) treatment followed by surface discharge and b) well injection, either for reservoir pressure maintenance or for disposal. Because real estate is so precious on a platform, compared with an onshore wellsite, only a limited amount of space is available to treat produced water for overboard discharge, although the new study found that this is the management practice used for 91% of produced water in federal offshore territory. That’s because offshore injection wells, especially in deep water, are even more expensive. The result is that what little produced water injection is done in federal waters is almost exclusively (97%, according to the study) for enhanced recovery, not strictly for disposal. In contrast, the study found that treatment and discharge represented less than 1% of US onshore produced water management. For all the attention given to produced water treatment for beneficial use (this magazine is no exception), onshore treatment and discharge is still reserved for those rare cases where it’s cheaper to do so than to re-inject the water. Onshore, there is very little to limit the watercuts at which hydrocarbon production is economic, so we can expect to see more and more water produced, with the national average reaching well above 10 bbl water/bbl oil. In some states (Florida, Illinois, Kansas, Missouri and Nebraska), the average WOR is already above 20 to 1. This reminds me of what I heard at a recent Produced Water Society meeting (www.pws.org): “Most E&P folks think that they’re in the oil business. They’re not. They’re in the produced water business—oil is just a byproduct.” LITERATURE CITED 1 Khatib, Z. and P. Verbeek, “Water to value: Produced water management for sustainable field development of mature and green fields,” Journal of Petroleum Technology, January 2003, pp. 26–28.
|
|||||||||||
- What's new in production (February 2024)
- Prices and governmental policies combine to stymie Canadian upstream growth (February 2024)
- U.S. operators reduce activity as crude prices plunge (February 2024)
- U.S. producing gas wells increase despite low prices (February 2024)
- U.S. drilling: More of the same expected (February 2024)
- U.S. oil and natural gas production hits record highs (February 2024)


