Intelligent completions coupled with an optical downhole monitoring system allow flow control of individual laterals.
I. H. Al-Arnaout, M. H. Al-Buali, S. M. Al-Mubarak and Saad M. Al-Driweesh, Saudi Aramco; M. A. Zareef and E. S. Johansen, Weatherford Intl.
In today’s drive to improve well production and performance, more innovative methods are continually being implemented to enhance well productivity and reservoir management. By increasing reservoir contact and applying fit for purpose technologies, increased production can be attained at lower drawdown. In multilateral wells equipped with active downhole control valves and downhole measurement devices, monitoring and managing the production from each lateral is achievable. These capabilities enhance well performance and allow better sweep; hence better recovery. This article describes the design, completion, commissioning and operational experience of the world’s first Maximum Reservoir Contact (MRC) well equipped with an intelligent completion, combined with fiber optic monitoring capabilities.
The adoption rate of optical sensing technology for in-well permanent monitoring has accelerated dramatically since it was first introduced more than a decade ago. Today, most of the common electronic-based technology measurements for in-well permanent reservoir monitoring have a commercially available optical equivalent; such as pressure, temperature, seismic and flowmeters. In fact, optical monitoring has exceeded the functionalities of conventional downhole measurement devices. The new fiber optic devices provide various measurement capabilities such as distributed temperature sensing, array temperature sensing and non-intrusive single- and multiphase flowmeters.
The present work involves the use of an advanced fiber optic monitoring system which enables remote monitoring of pressure, temperature, total flowrate and watercut from each of the laterals of a trilateral MRC well. The objective was to use this information to determine the downhole valves’ optimum positions, thereby optimizing production in real-time by:
- Monitoring pressure and temperature
- Monitoring production allocation from different zones
- Measuring watercut
- Identifying production anomalies.
TRILATERAL SMART WELL
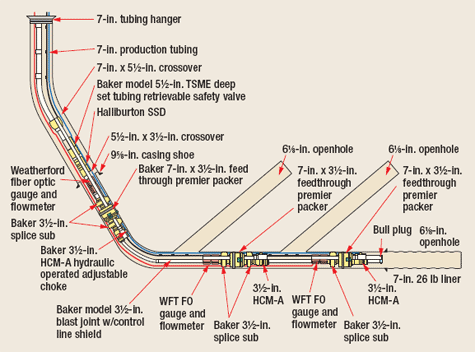
Well A is the world’s first maximum reservoir contact and trilateral smart well with a downhole fiber optic monitoring system. The well’s three laterals expose more than 5,000 m of hole length for reservoir contact. The laterals were equipped with downhole adjustable Inflow Control Valves (ICVs) and a permanent downhole monitoring system, including two-phase optical flowmeters. The well is the first in Saudi Aramco to be completed with 7-in. tubing and deep downhole sub-surface safety valve to accommodate future tubing electric submersible pump installation. The ICVs, optical flowmeters and Pressure/Temperature (P/T) gauges were located slightly uphole from each lateral, Fig.1. When the well was put on production, it showed a potential of 25,000 bpd of dry oil.
 |
|
Fig. 1. The inflow control valves, optical flowmeters and P/T gauges were located slightly up-hole from each lateral.
|
|
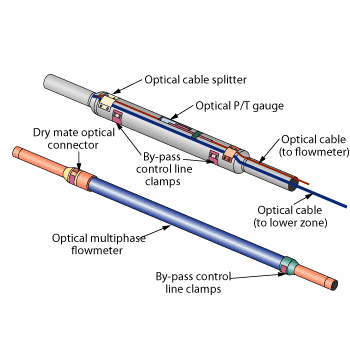
The optical monitoring system has low complexity and passive components downhole, while keeping active electronic equipment on the surface to ensure high reliability and measurement accuracy. The two-phase flowmeter and the fiber optic P/T gauge, Fig. 2, were built as a single integrated assembly. The meter is full bore, non-intrusive, has no exposed sensors, moving parts or downhole electronics. It also has high resilience to erosion and corrosion.
 |
|
Fig. 2. The two-phase flowmeter and the fiber optic P/T gauge were built as a single integrated assembly.
|
|
The optical P/T gauges deployed are Fiber Bragg Grating (FBG)-based sensors that have demonstrated long-term field performance. The gauges provide real-time zonal P/T for production monitoring and well diagnostics.
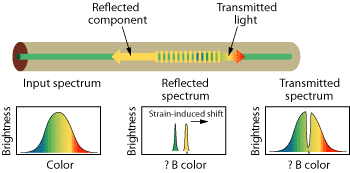
FBGs are extensively used in telecommunications networks and have been widely exploited in sensing applications by a number of industries over the past decade. During the fiber optic sensor manufacturing process; intersecting UV laser beams create an interference pattern of equally spaced dark lines, which cause a periodic change in the fiber’s refraction index. Broadband infrared light is transmitted down the fiber optic cable. As light passes through the FBG, the grating reflects a wavelength back to surface that matches the line spacing of the grating, Fig. 3. In effect, the gratings act as wavelength-specific partially-reflective mirrors. Since only part of the light is reflected back and most of the light passes straight through the grating, multiple FBG for different wavelengths can be inscribed in the fiber, each FBG reflecting back a different light color. Furthermore, the FBG has a physical length, and when exposed to strain, the gratings’ spacing will change and a different light color will be reflected.
 |
|
Fig. 3. As light passes through, the Fiber-Bragg grating reflects a wavelength back to surface that matches the grating’s line spacing.
|
|
Measuring temperature with FBG is possible due to thermal expansion of the glass with temperature. An increase in temperature causes an increase in the reflected wavelength. Similarly, by exposing FBG to pressure the grating spacing will decrease with increasing pressure. The P/T gauge employs two FBGs for different wavelengths and different sensitivities to pressure and temperature. By simultaneously measuring both wavelengths and using a factory generated calibration file, pressure and temperature are found concurrently.
The P/T gauge has no moving parts and no downhole electronic components. It is rated for continuous operation up to 20,000 psi and 150°C for a life span in excess of 20 yr. It has an all-welded construction and is fitted with an enclosed bellows that communicates wellbore pressures to the sensor, which is allowed to float in a silicon-oil-filled chamber. The bellows completely eliminates contamination with wellbore fluids.
FLOW MONITORING
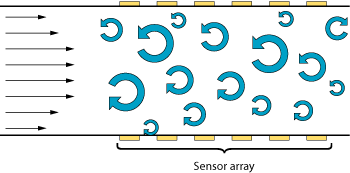
Downhole optical flow measurement technology is based on measurement of unsteady pressures associated with turbulent flow and natural acoustics. Turbulent pipe flow contains self-generating vortical structures that convect at a velocity near the volumetrically-averaged flow velocity, Fig. 4. These vortices remain coherent for several pipe diameters and decay as they convect. Meanwhile, new vortices are continuously generated by frictional forces between the fluid and pipe wall and within the fluid. Futhermore, as these vortices convect along the pipe, they create sound waves which propagate in both upstream and downstream directions.
 |
|
Fig. 4. Turbulent pipe flow contains vortices that convect at a velocity near the volumetrically-averaged flow velocity.
|
|
By tracking the convection velocity of turbulent eddies and the propagation velocity of the eddies’ sound waves, the medium’s flow velocity and the Speed-Of-Sound (SOS) are determined. The tracking method is based on measuring the force exerted on the inner surface of the flowmeter’s pipe by the pressure fluctuations caused by the vortices. The pressure fluctuations inside the pipe cause local changes in the radial strain in the pipe wall. The strain is measured by an array of fiber-optic based, spatially distributed, dynamic strain sensors located on the outer surface of the pipe. All sensors are on a single fiber and are FBG-based, but their operation is quite different from the P/T gauge. The interrogation method is known as interferometry and uses a pulsed laser.
The acoustical and vortical pressure disturbances strain the pipe wall independently and simultaneously, so that the signal measured by the strain sensors is a superposition of both pressures. Using an advanced array processing algorithm, the acoustical and vortical signals are separated, and the velocity and SOS are independently determined.
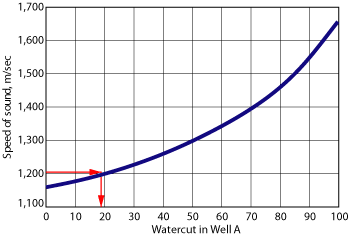
Knowing the densities and SOS for individual phases, phase fractions can be determined. Using the mixture velocity and the phase fractions yield the phases’ flowrates. The measured SOS is proportional to the insitu liquid holdup, if accurate Pressure/Volume/Temperature (PVT) properties for the flowing phases are available.1,2 The density and SOS for oil, water and gas are found from a PVT lookup table and interpolated to the pressure and temperature measured by the optical P/T gauge. Volume fractions are thus found directly from measured SOS and pure-phase PVT properties. The SOS vs. water fraction for Well A is shown in Fig. 5, where a measured SOS of 1,200 m/sec yields a watercut of 18%. With measured and flow velocity, the downhole flowrates are determined using a multiphase flow algorithm. The downhole flowrates are then converted to surface (stock tank) flowrates using PVT properties including, gas/oil ratio, and volume conversion factors for oil, water and gas.
 |
|
Fig. 5. Knowing the densities and speed-of-sound for individual phases, phase fractions, including water cut, can be determined.
|
|
FLOWMETER PERFORMANCE
Excellent accuracy and repeatability have been demonstrated in lab and field flowmeter tests. Single-phase uncertainty is typically less than ±1% and has been calibrated to within ±0.25%. Lab tests have confirmed that flowmeter performance is not affected by solids (i.e., sand) in the flow stream.
Efforts were made to test identical flowmeters in single-phase air and single-phase water flows. The purpose was to determine if the flowmeter technology had a universal behavior in different test fluids, and if a single calibration curve based on Reynolds number could be used for all practical conditions. It was found and reported that such a curve indeed exists and that it characterizes the single-phase behavior of the turbulent structures with respect to the main flow.3 This is an important feature that allows the flowmeter to be calibrated in one medium (such as water) and be used in another (such as oil or gas) with the same calibration. Furthermore, no changes to hardware or software are needed to operate the flowmeter under gas or liquids. Typical calibrated performance of better than ±1% is achievable over the full measurement range.
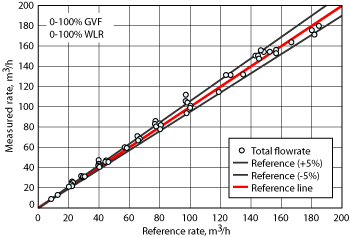
The technology has also been tested in a number of multiphase and wet-gas flow loops.4,5 These results are directly applicable to the flowmeter in Well A. In multiphase flows, the total flowrate is within ±5% over the full range of Gas Volume Fraction (GVF) and Water Liquid Ratio (WLR), Fig. 6. The flowmeter has a very limited watercut effect due to the well-defined Reynolds number behavior. There is reduced performance at GVF ranging from 30–90% due to severely slugging flow conditions resulting in non-homogeneous flow.
 |
|
Fig. 6. In multiphase flows, the total flowrate is within ±5% over the full range.
|
|
An equivalent topside flowmeter has also been tested in a wet-gas flow loop with Lockhart-Martinelli numbers ranging from 0 to 0.3. In those tests, the total flowrate was shown to be within ±5% over the full range of flowrates and wetness.
Recent work demonstrates that after six years of operation in a gas producer (two-phase flow) in Trinidad, the fiber optic flowmeter provides excellent results matching the separator results well within 3%.3 This work validates that the downhole flowmeter is reliable and continues to report accurate data.6
INSTALLATION
Downhole a three-section monitoring system was installed in Well-A. The wellbore was cleaned-up with five trips using brushes and magnets in the process. The intelligent completion and fiber optic monitoring system was then run in the hole and 7-in. production tubing run back to surface.
The tubing hanger was made up and control lines were run through tubing hanger. After landing the tubing hanger, the downhole valves were function-tested and the P/T profile was measured.
All the downhole chokes were closed and the system was pressurized to 4,200 psi to set the packers. The backside packers were tested to 1,500 psi; after which the well was ready for flowback and production.
TEST PROGRAM
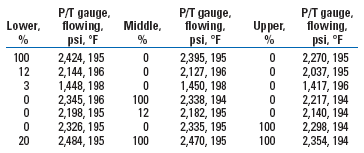
The P/T gauges operated to specification and delivered consistent and reliable numbers. They respond as expected to the changes in downhole ICV valve settings and well conditions, Table 1. Excellent data were also obtained at shut-in condition. After shutting the well, pressure built from 2,500 to 2,550 psi. All the P/T gauges respond well to the shut-in duration effect. Moreover, the gauges indicated that the upper lateral has lower pressure than the other laterals.
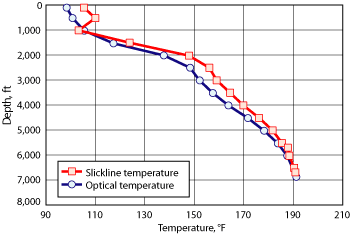
Pressure gauges were deployed into the well using a slick-line to confirm the pressure shut-in data. They were run in different times and compared at the same time to the optical P/T outputs. Pressure measurements showed an excellent match with wireline pressure measurements. Temperature gauges were deployed into the well using a slickline to confirm the temperature shut-in data. They were run in different times and compared simultaneously with the optical P/T outputs. The upper gauge located at 7,004 ft reflects 193°F, which is confirmed by the wireline temperature gauge run to the same depth, Fig. 7. The lower gauges reported 195°F, since they are deeper.
 |
|
Fig. 7. Temperature gauges were deployed on slick line to confirm the temperature shut-in data.
|
|
FLOW DATA
The downhole flowmeter measurement was observed and compared to the flow data reported from testing facilities. The original PVT parameter file was generated using a black oil model that assumed a reservoir GOR of 299 scf/bbl. The revised PVT parameter file was generated based on PVT report for an offset well, Well B, using a full compositional analysis using Calsep PVTsim, Tables 2 and 3.
| TABLE 1. Pressure/temperature gauge measurements |
|
|
|
| TABLE 2. Optical flowmeter measurements using original PVT |
|

|
|
| TABLE 3. Optical flowmeter measurements using revised PVT |
|

|
|
| TABLE 4. Downhole flowmeter measurements (WLR = 0) |
|
|
|
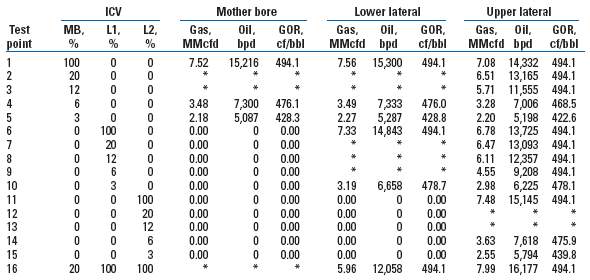
Note that the flowmeter across the Mother Bore (MB) is reading the flow produced from the mother bore. The flowmeter installed across the middle lateral is reading the sum of the flow produced from the MB and the second lateral while the third meter is reading the total rate from all laterals. There is very good agreement between the measured flowrate from the top flowmeter and the flowrate reported from the surface facility. The flow measurements from each of the three zones shows that about two-thirds of the production comes from the MB.
A series of production tests with various combinations of ICV positions were conducted in Well A. The test program included adjusting the bottom (MB), middle (L1) and top (L2) downhole ICVs sequentially with 100%, 20%, 12%, 6%, 3% and 0% settings. For each individual position, the pressure, temperature, and flowrates from each of the three flowmeter systems were recorded, Table 4.
For all ICV positions, the flowmeters were fully functioning except for positions 20% and 12% and in one case 6%; valves did not function properly due to excessive acoustic noise in the well. Severe acoustic noise generation in the well prevents proper operation of the flowmeters.
The gas and oil flowrates reported showed very good agreement between the optical and surface multiphase flowmeters (usually within 5%).
When the pressure at the metering location is above the bubble point, there should be no free gas and the meter can deliver oil, water and gas rates efficiently within +/- 5% accuracy. When the pressure is below the bubble point, free gas will be encountered and the SOS measurement will be a measure of the gas void fraction.
In this case, total flowrate will still be reported accurately; however, any changes in watercut will not be detected and will be reported as zero. These flowmeters are configured for two-phase (oil/water) measurements (i.e., above the bubble point) only. A dramatic drop in the SOS is observed when the pressure drops below bubble point pressure, and as such, this is an insitu verification of the bubble point pressure.
For a number of test points, there was excessive acoustic noise, or slew, which is defined as the rate of change of pressure, dp/dt. This can be attributed to the large differential pressure across the downhole ICVs (as high as 1,000 psi). The large pressure drop creates a high-frequency acoustic signal that overwhelms the optical demodulation algorithm. As a result, the sensor data are incorrectly represented. This was observed only in flowmeters located in the vicinity of the ICV and only at specific open positions of 6%, 12%, and 20%. To avoid this problem, a new flow instrumentation system has been developed with substantial increase in the slew tolerance.
During a shut-in period, the PDHMS data viewer indicated flow velocities in the lower meter: at about 6.5 ft/sec, in the middle meter at about 4 ft/sec and at zero flow in the upper meter. These results suggested the possibility of a cross-flow during shut-in due to the differential pressure among the laterals. A detailed post-processing of data confirmed that the data are valid. Additionally, the SOS diagnostics confirmed cross flow between laterals while the well was shut-in.
PRODUCTION OPTIMIZATION
With the knowledge about Well A performance and known technology capabilities, the withdrawal of each lateral was optimized within the overall well and reservoir strategy. The mother bore was restricted to 20% open choke setting, while keeping the other two laterals fully open to allow equivalent production contribution. Both surface and downhole rate measurements were equivalent. Several publications have talked about various optimization efforts with regards to completion and performance.7,8
CONCLUSIONS
The downhole monitoring system installed in Well A has proved performance reliability and provided satisfactory pressure and temperature data and flow measurement. Present flowmeter technology has a limitation when excessive acoustic noise is encountered. This issue has been assessed and eliminated in the new generation of the flowmeter system. The value of downhole flowmeters is evident in managing multilateral production optimization. Additionally, the flowmeters showed their value when used to detect cross flow during shut-in conditions. 
ACKNOWLEDGEMENTS
The authors thank Saudi Aramco and Weatherford for their permission to publish this work, and also thank Ö. H. Ünalmis for his support and valuable contribution to this project. This article was prepared from SPE 118033, which was presented at the Abu Dhabi International Petroleum Exhibition and Conference held in Abu Dhabi, UAE, November 3–6, 2008.
LITERATURE CITED
1 Kragas, T. K., Johansen, E. S., Hassanali, H. and S. L. Da Costa, “Installation and data analysis of a downhole, fiber optic flowmeter at BP’s Mahogany Field, offshore Trinidad,” SPE 81018 presented at the SPE Latin American and Caribbean Petroleum Engineering Conference, Port-of-Spain, Trinidad, West Indies, April 27–30, 2003.
2 Johansen, E. S., Kragas, T. K. and P. Beaumont, “Downhole fiber optic 3-phase flow meter field test at BP Mungo,” presented at the 21st North Sea Flow Measurement Workshop, October 28–30, 2003.
3 Ünalmis, Ö. H., Chung, R., Vera, A., Mathias, S. and E. S. Johansen, “Fiber optic downhole flowmeter at BP Mahogany, offshore Trinidad,” presented at the 1st Production and Upstream Flow Measurement Workshop in Houston, Texas, February 12–14 2008.
4 Johansen, E. S., Hall, A. R. W., Ünalmis, Ö. H., Rodriguez, D. J., Vera, A. and V. Ramakrishnan, “A prototype wet-gas and multiphase flowmeter,” presented at the 25th International North Sea Flow Measurement Workshop in Oslo, Norway, October 16–19 2007.
5 Rodriguez, D. J., Ünalmis, Ö. H., Vera, A., Ramakrishnan, V. and E. S. Johansen, “A new approach in wet gas monitoring,” presented at the Multiphase Pumping and Technologies Conference Track at Offshore Asia in Kuala Lumpur, Malaysia, March 18–20, 2008.
6 Smith, B., Hall, M., Franklin, A., Johansen, E. S. and Ö. H. Ünalmis, “Field-wide deployment of in-well optical flowmeters and pressure/temperature gauges at Buzzard Field,” SPE 112127 presented at the SPE Intelligent Energy Conference in Amsterdam, The Netherlands, February 25–27, 2008.
7 Mubarak, S. M, Pham, T. R. and M. Shafiq, “Using down-hole control valves to sustain oil production from the first MRC, multilateral and smart well in Ghawar Field: Case Study,” IPTC 11630 presented at IPTC held in Dubai, U.A.E., December 4–6, 2007.
8 Mubarak, S. M., Sunbul, A. H., Hembling, D., Sukkestad, T. and S. Jacob, “Improved performance of downhole active inflow control valves through enhanced design: Case Study,” SPE 117634 presented at the ADIPEC held in Abu Dhabi, UAE, November 3–6 2008.
|
THE AUTHOR
|
| |
Ibrahim H. Al-Arnaout earned a BS degree in petroleum engineering from King Fahad University of Petroleum and Minerals. He has 10 years of petroleum experience and is experienced with intelligent fields and well intervention. Al-Arnaout is a Petroleum Engineer working for Saudi Aramco in the Southern Area Production Engineering Department and is head of the Haradh and Harmaliyah Production Engineer Unit at Udhailiyah.
|
|
| |
Muhammad H. Al-Buali earned a BS degree in applied chemical engineering from King Fahad University of Petroleum and Minerals. In November 2002, he joined Saudi Aramco and now has six years of experience in production optimization and well intervention. Presently, he is working at HRDH GOSP-1. Al-Buali is a Petroleum Engineer in the Southern Area Production Engineering Department.
|
|
| |
Saeed M. Al-Mubarak earned a BS degree in chemical engineering from King Fahd University of Petroleum and Minerals and is pursuing an MS degree in petroleum engineering. With more than 15 years of experience, he has been very involved in the development, design and implementation of intelligent fields and various advanced well completion systems. Al-Mubarak is a Supervisor in the Southern Area Reservoir Management Department, and is a specialist in real-time reservoir management and intelligent fields.
|
|
| |
Saad M. Al-Driweesh earned a BS degree in petroleum engineering from the University of King Fahad of Petroleum and Minerals in Saudi Arabia. He has worked with Saudi Aramco for the past 20 years in gas and oil production engineering. His main interests are production optimization and new well completion applications. Al-Driweesh is a Production Engineering General Supervisor in Saudi Aramco, where he is involved in production engineering, well completion and stimulation activities.
|
|
| |
M. A. Zareef earned a BSc in mechanical engineering from King Fahd University of Petroleum and Minerals and an MBA from the University of Manchester. He began his career as a field/wireline logging engineer for Baker Atlas and recently was the project manager for intelligent completion technology. Zareef is presently the Business Development Manager for Weatherford’s Production Optimization group in Saudi Arabia.
|
|
| |
E. S. Johansen earned a PhD in aerospace engineering from Texas A&M University in 2001, where NASA and the Air Force Office of Scientific Research funded his research on unsteady aerodynamics. He holds five US patents and has been with Weatherford for seven years working on the development and commercialization of optical in-well sensing technologies and flow measurement systems. He is the Eastern Hemisphere Flow Measurement Manager for Weatherford International Ltd., based in London, UK.
|
|
| |
|


