Developments include improvements in wireline depth accuracy; new methods for tool deployment; casing evaluation tools; LWD batteries and telemetry systems; azimuthal-density imaging; and digital-outcrop modeling.
Stephen Prensky, Consultant, Silver Spring, Maryland
The recent emphasis in logging and formation evaluation has focused on unconventional reservoirs: improved geosteering in ERD and horizontal wells, as well as characterizing and evaluating deepwater laminated turbidites, low-permeability carbonates, fractured tight-gas reservoirs (sandstones and gas shales) and heavy oil/tar sands. This emphasis has produced new and improved technologies that provide additional and more accurate measurements for geosteering (deeper-reading and azimuthal), downhole fluid characterization and analysis, borehole imaging for fracture identification and evaluation, and downhole devices for monitoring fluid movement.
The oil-price roller coaster has definitely affected the logging and formation evaluation sector. The record run-up in oil prices that peaked in July 2008 saw the major service companies snapping up smaller companies to improve their positions as providers of integrated project management. New technology centers focusing on regional E&P issues—designed to bring the latest technology to the customer—were opened. Since the collapse in oil prices, however, these same companies are announcing major layoffs.
WIRELINE LOGGING
The past year saw many new and enhanced wireline logging tools, an improvement to a tractor conveyance for moving tools through horizontal sections, and new studies of interest to wireline operators.
Depth accuracy. In 2008, the emphasis in this ongoing topic was on improving depth correction for borehole imaging tools, where depth-accuracy issues can result from sensors being located at different depths, and from depth “creep.”1 Depth creep—the difference between winch depth and true tool depth that occurs when the logging winch is stopped—affects stationary operations (formation testing, sidewall coring and perforating).2,3
For sensors at different depths, a depth correction was presented to improve image accuracy in cases of tool sticking or logging-speed variations, when the depth separation between sensors is less than 3 ft. For depth creep, the causes (e.g., toolstring momentum, cable delay, fluid viscosity, stick-slip, wellbore profile) and methods to estimate creep were discussed, and recommendations for minimizing wireline creep in open and cased hole were proposed.
‘Offline’ openhole logging. Chevron is gaining experience with a new approach to openhole logging in batch-drilling operations: logging Under the Rig Floor (URF) rather than on the rig floor.4 URF operation integrates unique logging components with existing rig systems to allow simultaneous wireline openhole logging in one well while drilling another. “Offline” refers to performing a process off the critical path of a drilling operation.
This technique results from studies seeking to improve rig efficiency to make the most of high rig rates. Chevron sees this technique as a less expensive alternative to LWD in situations where either option could be exercised without impairing critical rig operations. In a case study, “offline” URF logging resulted in a 10% reduction in the time and expense required to drill an average well in the Gulf of Thailand.
Well tractors. Tractors are used to convey formation-evaluation logging, production logging and well-servicing tools through long horizontal sections in open and cased hole. They have also been used for fishing MWD tools stuck in horizontal wells.5 Both continuous-drive and reciprocating-grip tractors rely on friction with the rock formations in open hole or with casing, to provide the traction necessary for conveying the tools to the desired location downhole. However, devices often slip and fail to provide sufficient tractoring force in soft formations.
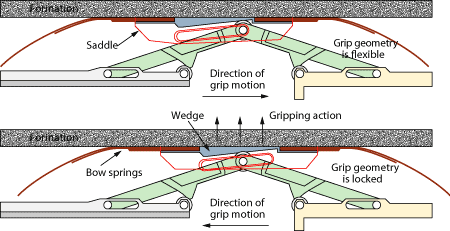
An existing cased-hole reciprocating device was redesigned for use in open hole where the formation compressive strength is less than 5,000 psi.6 The modifications consist of increasing the contact area, using pad rather than a cam to increase contact area and lower contact pressure with the formation, and using a bowspring in place of rigid arms to reduce or avoid tool sticking at borehole irregularities, Fig. 1.
 |
|
Fig. 1. A modified tractor design uses a flexible bow spring for gripping smooth surfaces (e.g., casing) and an enlarged pad (“wedge”) for gripping in open hole.5
|
|
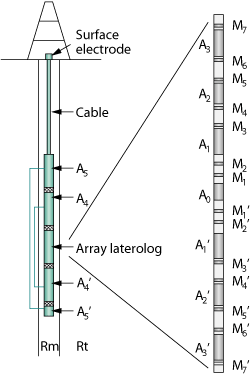
Array laterolog. Baker Atlas introduced the Multi Laterolog, a multi-frequency high-resolution array-laterolog tool that acquires four independent focused measurements at multiple depths of investigation, ranging from 9 in. to 40 in., to provide an improved invasion profile.7 The quad-frequency tool is comprised of a central emitting electrode (A0) with a symmetric array of focusing (guard, A1–3 and A1–3’) and monitoring (M1–7 and M1–7’) electrodes above and below it, Fig. 2. The central array-laterolog mandrel may be augmented with electrodes (A4, A5, A4’, A5’) contained in additional tools in the toolstring and connected to it.
 |
|
Fig. 2. The configuration of Baker Atlas’s Multi Laterolog consists of the 14-ft central mandrel plus additional electrodes in other tools placed above and below it in the toolstring.7
|
|
The 14-ft mandrel is shorter than conventional dual-laterolog tools. Different depths of investigation are achieved through hardware focusing using the various guard electrodes. The current return is within the toolstring, both above and below the survey current source electrodes, not at surface as with conventional laterolog devices. The symmetrical antenna configuration reduces the Delaware/Gronigen effect. A new inversion-based technique—adaptive borehole correction—is used at the wellsite to resolve issues related to the borehole and eccentricity effects on the shallow measurements, and to provide Rt and depth of invasion. This technique guarantees that all four laterolog curves stack in uninvaded intervals and exhibit a reliable and consistent resistivity profile in invaded formations.
Dielectric tool. Schlumberger’s wideband dielectric tool is a multi-frequency, multi-spacing pad tool that provides continuous measurement of dielectric dispersion at 1-in. vertical resolution, Fig. 3.8 The device operates at four frequencies ranging from 20 MHz to 1 GHz and makes 72 amplitude and 72 phase measurements at each frequency; some of these measurements are combined. The device was developed, in part, to improve formation evaluation in carbonate and heavy oil reservoirs, as well as in more traditional dielectric tool applications like freshwater and thin-bed reservoirs. The multi-spacing high-frequency measurements of dielectric permittivity enable pore-fluid analysis; the multi-frequency dielectric-dispersion data allows matrix analysis in carbonates and shaly sands; the high-resolution dispersion and the low-frequency permittivity (interfacial polarization) measurements provide information on geological structure (e.g., thin-bed analysis, carbonate classification).
 |
|
Fig. 3. Schematic showing the wideband dielectric tool antenna configuration. The transmitters (T) and receivers (R) on the cylindrical measurement pad are colocated normal (crossed) magnetic dipoles. The symmetrical arrangement provides borehole compensation.8
|
|
Microelectrical borehole imaging devices. A new oil-based-mud tool and a shuttle-deployed memory tool were introduced. Halliburton’s Oil Mud Reservoir Imager (OMRI) tool uses a capacitive-coupling sensor to allow operation in all types of nonconductive mud.9 The tool is 27.5 ft long and with a 5½-in. diameter that allows it to operate in borehole sizes ranging from 6½ in. to 24 in. There are six measurement pads, arranged vertically in two groups of three and mounted on independent caliper arms having two-axis articulation. Each pad has six microresistivity buttons for a total of 36 measurements with a vertical resolution of 1 in. and a depth of investigation of 3.75 in., for a total of 120 samples/ft. Borehole coverage is 57% in 8-in.-diameter borehole. The tool is rated to 350°F (117°C) and 20,000 psi.
Weatherford’s Compact Micro-Imaging (CMI) small-diameter memory tool can be deployed on wireline or through drillipipe in highly deviated and horizontal wells using a well shuttle mechanism.10 The shuttle mechanism, housed in special drill collars at the bottom of the drillstring, is activated at TD, either through a messenger system or using a sequence of pressure pulses generated by the mud pumps; data is acquired while tripping out of the hole.
Unlike conventional pipe-conveyed logging, shuttle deployment protects the tool going into the hole, and memory logging eliminates concerns related to the length and protection of a side-entry wireline. The CMI tool has eight arms in two planes. The pads on the four upper arms each have 20 microelectrode buttons in two rows, and the bottom four pads each have 24 buttons in two rows, for a total of 176. The vertical resolution is 0.2 in. Borehole coverage is 99% in 6-in.-diameter hole and 71% in 8-in. hole. The upper caliper arms are cross-linked, while the lower arms are independent. The tool is rated to 250°F (120°C) and 12,500 psi. A new, robust speed correction uses all the memory time-domain data, rather than a subset.
Depth of electrical image vs. depth of investigation. Resistivity images do not originate at the borehole wall but at some depth into the formation. The accuracy of dip computations derived from electrical borehole images is influenced by the origination depth of the image: An error of 0.5 in. in the depth of image can result in a 3° error in relative dip.11
A recent Halliburton study demonstrates that for focused-resistivity devices, the tool’s depth of investigation is not the same as the depth at which the image is generated, and characterizes these parameters for two recently introduced LWD resistivity tools.
Wireline formation testing. The quality and reliability of modern Wireline Formation Testing (WFT) devices is now so high that Shell routinely uses them to replace conventional drillstem testing for permeability and fluid sampling.12
InSitu is the new service name for Schlumberger’s collection of complementary downhole reservoir fluid measurements (fluid composition, gas-oil ratio, CO2, density, color, fluorescence and pH) acquired with the company’s fluid analyzer, all of which were described in this article in 2006–2008. The system also measures flowline pressure, temperature and resistivity.
Halliburton introduced a densitometer and a dual Straddle-Packer Section (SPS) for the Reservoir Description Tool (RDT). The density sensor provides fluid-sample density, water salinity and fluid compressibility.13
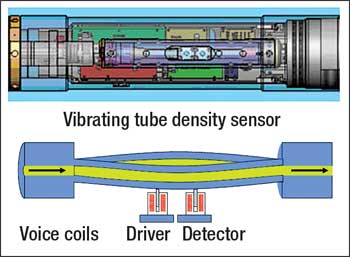
The fluid sample is pumped through a tube, which is forced to vibrate at its natural frequency, Fig. 4. The tube mass changes with the fluid flowing through it, causing the natural frequency to change in proportion to the fluid density. (Schlumberger’s density sensor also uses the vibrating frequency principle.14) The density sensor is sensitive to the entire fluid sample contained in the tube and therefore less affected by sample contamination than other types of sensors. This sensor is also very sensitive to fluid mixtures consisting of miscible and immiscible fluids (water, oil and gas).
 |
|
Fig. 4. Halliburton WFT density sensor.13
|
|
In general, fluid-density measurements obtained using the resonating-frequency approach show excellent correlation with laboratory data obtained for a range of fluids at different temperatures and pressures, with measurement accuracy of about 0.01 g/cm3.
The RDT SPS is configured to isolate a 1-m (3.28-ft) formation interval and is designed to test small reservoir features that commonly contribute to fluid flow in carbonates, thinly bedded sands and naturally fractured reservoirs. The SPS incorporates dual inlet ports, separated by 17-in., to reduce sampling times and collect cleaner samples. When a density contrast exists between the reservoir and contamination fluids, the denser phase gravitates to the bottom of the interval and the lighter phase floats to the top, and these differences are detectable by the density sensor. Retract rods, which are passive piston devices, use borehole hydraulic pressure to pull the packer elements back to their original deflated dimensions and thereby reduce the risk of sticking the tool when it is pulled up the borehole after testing.
Casing evaluation. Halliburton introduced an upgraded version of its CAST series ultrasonic pulse-echo imaging tool that operates at logging speeds up to five times faster.15 The higher logging speed is made possible through upgraded tool electronics and improvements in data acquisition, processing and evaluation software.
The tool operates in two modes: Cased-hole mode is used for measuring casing internal diameter and thickness, and the acoustic impedance of material beyond the casing for cement evaluation, while image mode provides detailed images of interior casing defects. Both modes provide complete horizontal coverage; vertical resolution is 0.20 in. for image mode or 1, 3 and 6 in. for casing mode.
Weatherford introduced a Magnetic Flux Leakage (MFL) casing inspection tool.16 This tool uses a samarium-cobalt permanent magnet that is stronger than permanent magnets in current use to induce a high magnetic flux within the casing wall. Overlapping high-resolution Hall-effect sensors are used to detect variations in the flux leakage caused by inner or outer casing defects. Rare-earth magnets do not require power and provide optimum field strength.
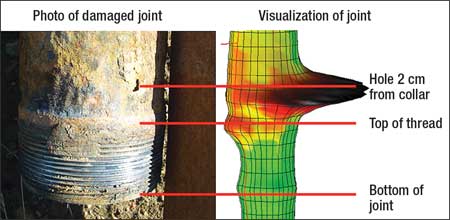
Two sets of sensors (corrosion sensors and discriminators) provide complete circumferential coverage and allow discrimination between internal and external defects. The advantage of these new sensors is that they do not require a constant logging speed, which allows them to detect defects in areas where previous methods would not work; e.g., near the surface. The evaluation software provides 3D images that clearly show pipe defects, Fig. 5. One advantage of MFL devices over ultrasonic devices is that they can be run in both liquid- and gas-filled holes.
 |
|
Fig. 5. Comparison of an interval of retrieved casing (left) and the MFL log visualization that was used to locate the hole in the casing (right).16
|
|
Shell, in combination with Baker Hughes, is developing an in situ fiber optic casing imager that provides continuous, real-time, high-resolution images of casing for monitoring deformation.17 High geologic stresses or reservoir compaction can put casing under great strain, which can result in casing deformation and collapse, and even loss of the well. Early indications of changes in casing shape permit scheduling remedial action to minimize the impact. Continuous strain monitoring can also lead to an improved understanding of the reservoir that can be used to optimize production and reserves recovery.
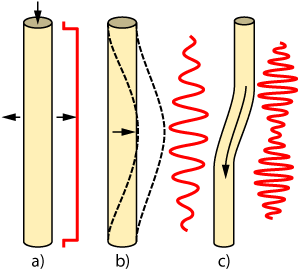
The Real Time Casing Imager (RTCI) is comprised of fiber optic laser transmitting and sensing cables and a surface unit that provides the laser light and analyzes the detected signal, Fig. 6. The strain sensors are fiber Bragg gratings—of the same type used in distributed-temperature-sensing fiber optic systems—that can be photo-inscribed onto the optic fiber as close as 1 cm apart. The sensing cable is helically wrapped around the outside of the casing; changes in the laser wavelength that is reflected off the Bragg gratings are detected by the imaging system. The current version can detect casing deformations of less than 10°/100 ft and covers compressive and tensile axial strain ranges from less than 0.1% to 10%.
 |
|
Fig. 6. Typical signatures of the wavelength shift in the laser light reflected off RCTI Bragg gratings attached to tubing undergoing different types of strain: a) pure axial compression, b) column buckling and c) shearing.17
|
|
RESERVOIR MONITORING
Many advances in reservoir monitoring technologies and methods have been proposed or are being developed, including a more sensitive pulsed-neutron logging tool, a borehole gravity sensor using laser interferometry, and a new technique for characterizing formation heterogeneity.
Pulsed-neutron logging. Weatherford is developing a new dual-mode, cased-hole Pulsed-Neutron Capture (PNC) tool that uses an array of four lanthanum-bromide (LaBr3) scintillation detectors.18 Compared with the scintillation detectors currently used for PNC, these high-density halide detectors provide improved peak resolution, temperature response and speed.
This tool can operate in thermal-neutron mode, or in combination with the inelastic mode, to provide sigma, neutron porosity and lithology. The sigma and porosity measurements use the near and far detectors and are similar to the same measurements from Weatherford’s existing tool. The 111⁄16-in.-diameter Cased-Reservoir Evaluation (CRE) system is comprised of a telemetry sonde, a gamma ray sonde and the PNC sonde in a 23-ft stack. The CRE is rated to 325°F (163°C) and 20,000 psi.
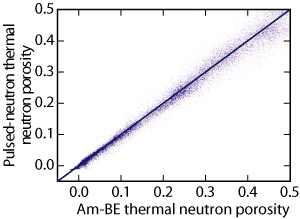
Alternative neutron porosity source. A new algorithm for computing the equivalent thermal-neutron porosity from wireline pulsed-neutron measurements was proposed as part of industry’s efforts to minimize use of americium-beryllium (Am-Be) chemical radioactive sources due to national security and environmental concerns (discussed in this article in March 2008). The method, proposed by Fricke et al.,19 uses neutron slowing-down length, capture cross-section and density to predict the count rate ratio that would be measured by a conventional Am-Be-based thermal-neutron tool. There is very good agreement between conventional thermal-neutron log porosity and thermal-neutron porosity generated by this method up to 50 porosity units, Fig. 7. These results have been validated for a range of porosities, lithologies, hole sizes, mud types, borehole salinities and formation fluids.
 |
|
Fig. 7. Crossplot of calculated and measured thermal-neutron porosity for 10 wells.19
|
|
Borehole gravity. Time-lapse microgravity surveys can monitor inter-well fluid movement. Surface and borehole gravity sensors are sensitive to changes in bulk density and can monitor the density changes accompanying movement of injected water, especially at gas-liquid contacts.20 Existing borehole gravimeters primarily use Lacoste-Romberg spring sensors, make stationary measurement at 3-m (10-ft) to 10-m (33-ft) sample intervals, and have a depth of investigation approaching 100 m (328 ft).
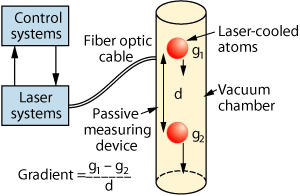
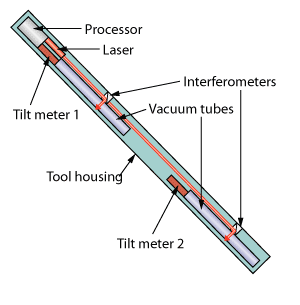
A new type of borehole gravity sensor has been proposed that would use laser interferometry to measure the freefall acceleration of a retroreflector (an object whose surface reflects light back to its source with minimum scattering) in a vacuum. These sensors would use simultaneous measurements of two reflectors (to compensate for tool movement) and would be small enough to fit into small-diameter sondes for cased-hole reservoir monitoring. One proposed sensor design simultaneously measures the freefall of laser-cooled atoms (Fig. 8);21 a second is a dual-sensor sliding-weight design that allows logging in deviated wells, Fig. 9.22 A third design, currently in development, uses a pair of miniature test masses.23
 |
|
Fig. 8. Diagram of the atom-interferometry gravity tool proposed by Alshakhs et al.21
|
|
 |
|
Fig. 9. Diagram of a tandem sliding-weight borehole gravimeter.22
|
|
Meanwhile, a new inversion technique for current devices enables extraction of reliable densities at station intervals as small as 1 m (3.28 ft).24
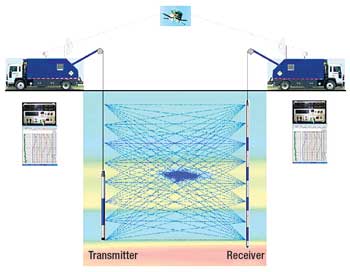
Crosswell EM. Acoustic and electromagnetic crosswell logging are borehole geophysical imaging techniques that provide a snapshot of the interwell region. These methods can detect bypassed oil, or, used in 4D time-lapse sequences, can monitor the progress of hydrocarbon production and water- and steamflooding (the vertical and lateral movement of formation fluids) or the spread or remediation of pollutants in the vadose zone.Displacement of formation fluids produces changes in rock properties and/or temperature (as in steamflood) that can be detected through changes in acoustic velocity and resistivity.
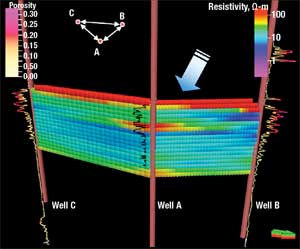
In crosswell imaging, a transmitter is placed in one well and a receiver array in another, Fig. 10. The transmitter is moved up the hole a specified interval while the transmitters remain stationary; this is repeated at additional receiver positions covering the depth range of interest. Data inversion is used to process and interpret the data, which are typically presented as tomographic resistivity images. These images, constrained by available well log and petrophysical data, can be presented to show the interwell distribution of fluids or petrophysical properties, Fig. 11.
 |
|
Fig. 10. Illustration showing the deployment of crosswell EM.25
|
|
 |
|
Fig. 11. Resistivity cross-sections based on results of a three-well crosswell EM study in Haradh (southern Ghawar) Field, Saudi Arabia. The wells’ porosity logs are also displayed. The interwell spacing is 850 m (2,790 ft).26
|
|
A new crosswell EM system designed for petroleum applications is in field testing.25 The Cross-Well EM Resistivity system operates at frequencies ranging from 5 Hz to 1 kHz, in open or cased holes, at interwell distances up to 1,000 m (3,280 ft). The system uses wireless GPS synchronization between the transmitter and receivers. The transmitter sonde, operating at a single frequency, travels uphole at logging speeds of 2,000–5,000 ft/hr, three to four times faster than earlier tools, while data from the transmitter sonde and receivers are continuously recorded. The magnetic moment of the transmitter sonde is about five orders of magnitude greater than that of a conventional induction tool and twice as large as that of previous crosswell EM sondes.
The transmitter sonde has a 3⅜-in. diameter and is 32.4 ft long. The receiver toolstring, comprised of four receivers 14.75 ft apart, has a 2⅛-in. diameter and is 73.8 ft long. A typical survey consists of 32 to 60 different receiver stations and requires 16–36 hours, depending on the interwell distance, length of logged interval, casing type, operating frequency and downhole noise levels.
Downhole EM arrays. Permanent electrical arrays to monitor waterflooding—attached to the outside of casing and cemented in place—were introduced in 2001 (see discussion in this article in March 2002).
A new dynamic technique for characterizing formation heterogeneity, Fluid Movement Monitoring (FMM), uses the deep time-lapse resistivity measurements from an Electrode-Resistivity Array (ERA) to provide in situ estimates of multiphase flow properties, such as relative permeability and capillary pressure.27,28 In the FMM tests, the ERA, consisting of 28 electrodes spaced 4 ft apart, was deployed on the outside of slotted fiberglass tubing in a barefoot completion; i.e. in open hole.
The openhole wireline logs, wireline formation tester and core data were used to develop a multi-layer reservoir model. New inversion and interpretation techniques integrate the time-lapse resistivity data, pressure-transient data (from a permanent downhole gauge), production log injection and production profiles obtained during injection and flowback with the reservoir model.
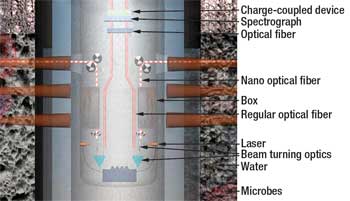
Raman spectroscopy detection of bypassed oil. The concept for a novel cased-hole logging device, the oil-microbe detection tool, was proposed in a student paper presented at the SPE annual conference.29 The device—for use in fields undergoing Microbial Enhanced Oil Recovery (MEOR)—consists of a laser, Charge-Coupled Device (CCD) detector, spectrograph and special nano optical fibers. Data are transmitted uphole through a different set of fiber optics. It operates on the principle of Resonance Raman Spectroscopy (RSS) to detect the microbes used in MEOR. These microbes only live on the oil-water interface, and their detection serves as a proxy for the presence of oil.
The device would be lowered opposite perforations and the nano optical fibers positioned through the perforations into the formation, Fig. 12. Changes in the specific wavelength of reflected laser energy would indicate the presence of MEOR microorganisms. The absence of reflected laser energy (i.e., no microbes) would indicate a thief zone.
 |
|
Fig. 12. Conceptual drawing of the oil-microbe detection tool.29
|
|
LOGGING WHILE DRILLING
LWD/MWD advances in 2008 include more robust and rechargeable MWD batteries, new research on the effects of magnetic shielding, and a rig-less wireline logging tool that drills itself into the formation.
Downhole batteries. Recent parallel developments in battery technology will enable significant extension of the downhole operation of MWD tools while reducing the operational and disposal hazards associated with the primary (non-rechargeable) lithium batteries now in use. In the first development, Saft, a French battery manufacturer, has increased the maximum operating temperature for its primary lithium batteries used in MWD tools, to 302°F (150°C) from 150°F (65°C).30 They have also developed a high-temperature rechargeable lithium-ion battery. This battery, capable of operating at up to 255°F (125°C), is smaller than current primary batteries.
In the second development, Halliburton and Electrochemical Systems have jointly developed a molten-salt rechargeable battery with an effective operating temperature range of 175°F–266°F (80°C–130°C).31
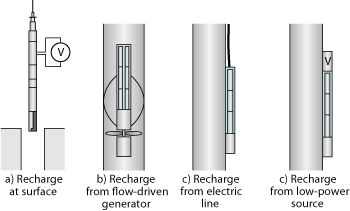
Downhole rechargeable batteries can be charged in a variety of ways, depending on the application, Fig. 13. For MWD, the most likely method is recharging via a turbine propelled by the circulating drilling fluid, Fig. 13b.
 |
|
Fig. 13. Possible recharging configurations for batteries used in downhole applications.31
|
|
Directional surveys. A new report discusses the magnetic shielding effect on MWD directional survey accuracy.32 Magnetic material in drilling mud, added as weighting material or as the result of tubular wear, can mask the true magnetic field sensed by MWD directional tools and can result in survey azimuth errors ranging from 1–2° (typical) to 5–10° or more (extreme). The magnitude of the magnetic shielding effect is a function of the magnetic susceptibility of the materials involved and is also time dependent. The primary recommendation at this time for optimizing the quality of directional-survey readings is to perform the MWD measurements immediately after cessation of drilling.
SPE’s Wellbore Positioning Technical Section published a revised version of the 2004 standardized general model for estimating the error in gyroscopic surveying position accuracy.33 Gyroscopic tools, originally used for surveying wellbores in regions of high magnetic interference, are now commonly used in general MWD operations. The presented generic model can be used with most commercial gyro surveying services.
Telemetry. Baker Hughes’ new aXcelerate system includes the existing IntelliServ wired-pipe system and a new high-speed mud-pulse telemetry system. The wired-pipe option is particularly useful in wells drilled with foam, which cannot transmit the pulses as in conventional LWD telemetry. Efforts are underway to develop a variety of logging and/or drilling sensors for additional and higher-resolution real-time measurements and images. In principle, pressure sensors, strain gauges and accelerometers can be embedded in the signal-amplifer subs that are required by this system every 400–500 m (1,310–1,640 ft). These subs already contain temperature sensors that communicate with the surface system and provide a temperature profile from the drillbit to the surface.34
The mud-pulse system uses a new oscillating-disc downhole pulser, dual-sensor surface receivers, and a new signal acquisition and processing unit to achieve data rates up to 20 bits/sec.35 The pulser can be programed to generate either baseband or carrier modulated signals to accommodate different well depths and mud conditions. The carrier frequency can be changed to achieve the height signal-to-noise ratio without changing the data rate, and the downhole system supports more than 100 telemetry options. Bidirectional communication is used to change downhole drilling and logging parameters without interrupting the drilling process. The system measures the transmission channel and automatically adapts processing settings to best match the needs of the data delivery stream and available telemetry bandwidth. These features enable delivery of more and higher-resolution data in real time for greater drilling optimization and more accurate wellbore placement (geosteering).
In one field test, the aXcelerate service delivered telemetry rates of 20 bits/sec., which allowed it to provide real-time density images and highly detailed 60-sector resistivity images while drilling at penetration rates up to 130 ft/hr.
Azimuthal acoustic. Within the context of a discussion on the use of azimuthal acoustic devices in geosteering, Halliburton presented data from a prototype device that is apparently undergoing field testing.36
Azimuthal density. Pathfinder’s iFinder LWD density-neutron service provides neutron porosity, ultrasonic standoff and azimuthal images of bulk density and photoelectric index.37 Real-time density images use 4, 8 or 16 azimuthal bins (sectors), and higher-quality 32-sector images are available from memory data. Three neutron-porosity measurements are computed from the three neutron detectors; the default display uses the porosity from the near/far detector pair.
This 4¾-in. narrow-diameter tool is designed for use in borehole sizes between 5⅞ in. and 7 in. The tool uses a standard cesium-137 density source and the newer californium-252 chemical neutron source discussed in this article in March 2008.38 The 19.6-ft-long tool is rated to 350°F (175°C) and 25,000 psi. The modular design allows it to be placed anywhere in the toolstring.
Burrowing logging device. The Badger Explorer is a unique, self-contained remote wireline device that “drills itself into the underground and buries itself” while continuously recording data using onboard sensors.39 According to the company’s prospectus, this device will drill a 6-in.-diameter borehole, up to 3,000 m (9,840 ft) TVD, at an ROP of 2 m/hr (6.5 ft/hr). Furthermore, this borehole, drilled without drilling fluid, will be a gauge hole, without washout or rugosity and with no formation invasion. These factors will simplify formation evaluation and reduce the logging sensor package’s cost, while increasing data quality.
The wireline connection will allow higher data transmission rates than conventional LWD. Proposed logging measurements include resistivity, gamma ray and neutron porosity, possibly acoustic. A prototype of this combination drilling/logging device is being tested in Norway.
DIGITAL OUTCROP IN RESERVOIR MODELING
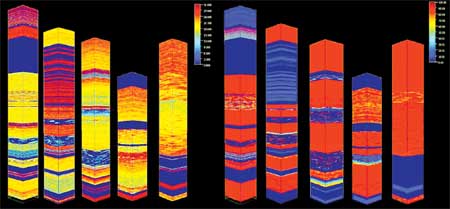
The digital (virtual) outcrop is a high-resolution 3D model that represents the integration of all available outcrop-based geologic features, at all scales, that are spatially positioned (including remotely sensed and physically sampled data) for quantitative use with reservoir-modeling software, Fig. 14. These models, which can be the product of a single workflow, serve as subsurface analogs for developing the reservoir depositional models used to constrain the uncertainty in reservoir evaluation.
 |
|
Fig. 14. Digital outcrop 3D petrophysical models. The left portion shows porosity and the right, resistivity, of measured sections.42
|
|
 |
|
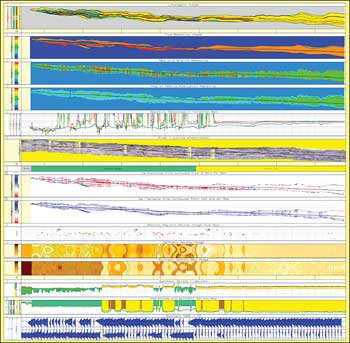
Fig. 15. Composite plot for a deepwater turbidite outcrop in the southern Pyrenees, Spain, used as an analog for offshore West Africa reservoirs. The plot includes the geological and LWD response models for a synthetic high-angle/horizontal well (depth in meters).43
|
|
In addition to reservoir geometry, these models provide insight to the depositional controls of vertical and lateral changes in petrophysical rock properties. This information can be used in forward models to synthesize well-log response to explain actual well-log response, or to predict the well-log response in future wells, Fig. 15. This capability can be used to optimize subsequent data acquisition (choice of logging suite) and formation evaluation in high-angle and horizontal wells.40–43
LITERATURE CITED
1 Moake, G. L., “An accelerometer- and tension-based depth correction suitable for image logs,” paper UU presented at the 49th SPWLA Annual Logging Symposium, Edinburgh, UK, May 25–28, 2008.
2 Fitzgerald, P., “Wireline ‘creep’,” SPE 118027 presented at the SPE Abu Dhabi International Petroleum Exhibition and Conference, Abu Dhabi, Nov. 3–6, 2008.
3 Pledger, T. M., “Are wells perforated on depth today?” World Oil, January 2008, pp. 61–63.
4 Upchurch, E. R. and K. S. Graves, “Under-rig-floor open hole logging in the Gulf of Thailand: Engineering design of the oil industry’s first simultaneous open hole wireline logging and drilling operation,” SPE 116335 presented at the SPE Annual Technical Conference and Exhibition, Denver, Colo., Sept. 21–24, 2008.
5 Frasure, G. et al., “Fishing MWD tools in horizontal wells without fluid circulation,” SPE 114972 presented at the CIPC/SPE Gas Technology Symposium Joint Conference, Calgary, June 17–19, 2008.
6 Hashem, M. K. et al., “An innovative tractor design for logging openhole soft formation horizontal wells,” SPE 111347 presented at the SPE North Africa Technical Conference and Exhibition, Marrakech, Morocco, March 12–14, 2008.
7 Zhou, Z. et al., “A new multi laterolog tool with adaptive borehole correction,” SPE 114704 presented at ATCE, 2008.
8 Hizem, M. et al., “Dielectric dispersion: A new wireline petrophysical measurement,” SPE 116130 presented at ATCE, 2008.
9 San Martin, L. et al., “Oil-based mud imaging tool generates high quality borehole images in challenging formation and borehole condition, including thin beds, low resistive formations, and shales,” Fig. 15. Composite plot for a deepwater turbidite outcrop in the southern Pyrenees, Spain, used as an analog for offshore West Africa reservoirs. The plot includes the geological and LWD response models for a synthetic high-angle/horizontal well (depth in meters).43
World Oil MARCH 2009 61 paper KKKK presented at the SPWLA Annual Logging Symposium, 2008.
10 Christie, R. et al., “Acquiring microresistivity borehole images in deviated and horizontal wells using shuttle-deployed memory tools,” SPE 116266 presented at ATCE, 2008.
11 Bittar, M. et al., “The ‘depth-of-electrical image’ a key parameter in accurate dip computation and geosteering,” paper TT presented at the SPWLA Annual Logging Symposium, 2008.
12 Elshahawi, H. et al., “Moving from vision to reality: The state of optimal value testing,” SPE 114870 presented at the SPE Asia Pacific Oil and Gas Conference and Exhibition, Perth, Australia, Oct. 20–22, 2008.
13 Palmer, R. et al., “Advances in fluid identification methods using a high resolution densitometer in a Saudi Aramco field,” paper MM presented at the SPWLA Annual Logging Symposium, 2008.
14 Godefroy, S. et al., “Discussion on formation fluid density measurements and their applications,” SPE 114648 presented at ATCE, 2008.
15 Shook, E. H. et al., “Cement bond logging,” SPE 108415 presented at the SPE Western Regional and Pacific Section AAPG Joint Meeting, Bakersfield, Calif., March 31–April 2, 2008.
16 Sharar, M. A. et al., “High resolution casing imaging utilizing magnetic flux leakage measurements,” paper R presented at the 49th Annual Logging Symposium, 2008.
17 Appel, M. et al. “Real-time fiber-optic casing imager,” SPE 109941 presented at ATCE, 2007.
18 Odom, R. et al., “Design and initial field-test results of a new pulsedneutron logging system for cased reservoir characterization,” paper O presented at the SPWLA Annual Logging Symposium, 2008.
19 Fricke, S. et al., “Thermal neutron porosity using pulsed-neutron measurements,” paper L presented at the SPWLA Annual Logging Symposium, 2008.
20 Brady, J. L. et al., “Results of the world’s first 4D microgravity surveillance of a waterflood: Prudhoe Bay, Alaska,” SPE 101762, presented at the SPE Annual Technical Conference and Exhibition, San Antonio, Texas, Sept. 24–27, 2006.
21 Alshakhs, M. J. et al., “Utilizing 4D microgravity to monitor water encroachment,” SPE 115028 presented at ATCE, 2008.
22 Peeters, M., “Design of a sliding-weight borehole gravimeter to measure rock density in highly deviated and narrow bore holes,” paper EEE presented at the SPWLA Annual Logging Symposium, 2008.
23 Meyer, T. J., “Monitoring water front advancements with downhole gravity sensors,” paper GM 1.2 presented at the 78th SEG Annual Meeting, Las Vegas, Nev., Nov. 9–14, 2008.
24 MacQueen, J. D., “High-resolution density from borehole gravity data,” paper GM 1.7 presented at the 77th SEG Annual Meeting, San Antonio, Sept. 23–27, 2007.
25 DePavia, L. et al., “Next-generation crosswell EM imaging tool,” SPE 116344 presented at ATCE, 2008.
26 Marsala, A.F. et al., “Crosswell electromagnetic tomography: From resistivity mapping to interwell fluid distribution,” IPTC 12229 presented at the International Petroleum Technology Conference, Kuala Lumpur, Malaysia, Dec. 3–5, 2008.
27 Kuchuk, F. et al., ”Determination of in-situ two-phase flow properties through downhole fluid movement monitoring,” SPE 116068 presented at ATCE, 2008.
28 Zhan, L. et al., “Characterization of reservoir heterogeneity through fluid movement monitoring with deep electromagnetic and pressure measurements,” SPE 116328 presented at ATCE, 2008.
29 Jahagirdar, S. R., “Bypassed oil detection using spectroscopy and nano technology,” SPE 120200 presented at ATCE, 2008.
30 Saft, “Saft launches world’s first Li-ion cell capable of operating at +125°C for oil drilling market,” press release, Nov. 6, 2007.
31 Fripp, M. et al., “Development of a high-temperature rechargeable battery for downhole use in the petroleum industry” OTC 19621 presented at the Offshore Technology Conference, Houston, May 5–8, 2008.
32 Amundsen, P.A. et al., “Magnetic shielding during MWD azimuth measurements and wellbore positioning,” SPE 113206 presented at the SPE Indian Oil and Gas Technical Conference and Exhibition, Mumbai, India, March 4–6, 2008.
33 Torkildsen, T. et al. “Prediction of wellbore accuracy when survey with gyroscopic tools,” SPE Drilling and Completion, 23, No. 1, 2008, pp. 5–12.
34 Hovda, S. et al., “Potential for ultra high-speed drill string telemetry in future improvements of the drilling process control,” SPE 115196 presented at the IADC/SPE Asia Pacific Drilling Technology Conference and Exhibition, Jakarta, Indonesia, Aug. 25–27, 2008.
35 Klotz, C. et al., “A new mud pulse telemetry system for enhanced MWD/LWD applications,” paper IADC/SPE 112683 presented at the IADC/SPE Drilling Conference and Exhibition, Orlando, Fla., March 4–6, 2008.
36 Market, J. and R. Deady, “Azimuthal sonic measurements: New methods in theory and practice,” paper G presented at the SPWLA Annual Logging Symposium, 2008.
37 Pathfinder, iFinder density imaging service datasheet, 2008, http://www.pathfinderlwd.com/news/2008/iFinder%20Density%20Imaging% 20Service.pdf.
38 Valant-Spaight, B. et al., “Field examples with a slim LWD density/ neutron instrument containing a californium-252 neutron source and three neutron detectors,” paper CCC presented at the 47th SPWLA Annual Logging Symposium, Veracruz, Mexico, June 4–7, 2006.
39 Badger Explorer, website, 2007, http://www.bxpl.com/.
40 Nardon, S. et al., “Multisource data integration and 3D digital outcrop visualization environment: From virtual geology to subsurface models,” paper A042 presented at the SPE Europec/EAGE Annual Conference and Exhibition, Rome, June 9–12, 2008.
41 Reijnders, G.-J. et al., “Simulating the outcrop: Surface to subsurface integration of a carbonate reservoir, Khuff Formation, Oman,” SPE 118332 presented at the SPE Abu Dhabi International Petroleum Exhibition and Conference, 2008.
42 Tyurin, E. and M. Benefield, “Application of outcrop analogues to optimize LWD acquisition for more confident formation evaluation in high angle and horizontal wells,” SPE 116338 presented at the SPE Russian Oil And Gas Technical Conference and Exhibition, Moscow, Oct. 28–30, 2008.
43 Tyurin, E. and M. Benefield, “Integration of outcrop analogue and reservoir rock properties to synthesize propagation resistivity tool response in deepwater, turbidite reservoirs,” paper.
|
THE AUTHOR
|
 |
Stephen Prensky is a consultant to logging service companies, with 34 years’ working experience in petroleum geology and petrophysics. He previously worked for Texaco, the US Geological Survey and the Minerals Management Service. He has served as the SPWLA vice president of technology and as editor of SPWLA’s Petrophysics. He now serves on the SPWLA Technology Committee. In addition to SPWLA, he is a member of AAPG and SPE.
|
|
| |
|


