Simulations reveal mechanisms of seismic waves for EOR
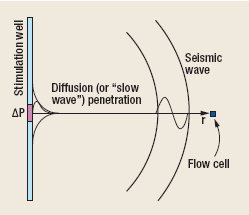
The pore-scale effects of seismic stimulation on two-phase flow are numerically modeled in random two-dimensional grain-pack geometries.Steven R. Pride, Lawrence Berkeley National Laboratory; Eirik G. Flekkøy and Olav Aursjø, University of Oslo Seismic stimulation aims to enhance oil production by sending seismic waves across a reservoir to liberate immobile patches of oil. For seismic amplitudes above a well-defined (analytically expressed) dimensionless criterion, the force perturbation associated with the waves can indeed liberate oil trapped on capillary barriers and get it flowing again under the background pressure gradient. Subsequent coalescence of the freed oil droplets acts to further enhance oil movement because longer bubbles more efficiently overcome capillary barriers than do shorter bubbles. Poroelasticity theory defines the effective force that a seismic wave adds to the background fluid-pressure gradient, while the lattice-Boltzmann model in two dimensions is used to perform the pore-scale numerical simulations. The dimensionless numbers (groups of material and force parameters) involved in seismic stimulation are carefully defined so that the numerical simulations can be applied to field-scale conditions. Using the analytical criteria defined by the authors,* there is a significant range of reservoir conditions over which seismic stimulation can be expected to enhance oil production. The objective of this article is to simulate numerically the effect of a passing seismic wave on the pore-scale two-phase flow. We use the lattice-Boltzmann model to perform the simulations, and poroelasticity theory to define the effective force that the seismic wave adds to the background fluid-pressure gradient. The simulations are presently done in 2D on cells that are typically 10 x 10 grains in size; however, extension to 3D and to larger systems is straightforward. Over a significant parameter range, stimulation is observed to mobilize oil by causing coalescence of smaller droplets into bigger ones that flow more easily. POROELASTICITY OF SEISMIC STIMULATION We imagine an oil reservoir being produced through the use of injection and extraction wells. The oil production in the field, through time, has fallen to low levels; water is flowing, but much of the oil became effectively trapped when the waterflood passed through. Such remaining oil patches (so-called “ganglia”) may be present at economically significant volume fractions; e.g., 30% or more of the pore space in a reservoir might commonly be occupied by such trapped oil. We focus on some arbitrarily chosen small region within the reservoir that we call a “simulation” or “flow cell.” The distribution of wells in the field is creating a net fluid pressure gradient Fo across this flow cell; however, any further details of the production wells are not required in what follows. An oil ganglion of downstream length h (typically much larger than grain sizes) becomes stuck when the downstream pressure drop hFo along the bubble is just balanced by a capillary pressure increase As shown in Fig. 1, there is assumed to be a seismic source in a stimulation well located a distance r from a given flow cell under study. By perturbing the fluid pressure in this borehole over a certain depth range, we aim to perturb the flow in the distant cell with the goal of enhancing the oil flux across that cell. Fluid exchanges between the stimulation well and the surrounding reservoir play no important role in enhancing the oil flow. It is the seismic waves that are overwhelmingly responsible for any stimulation effect. Any oil ganglia that are marginally trapped (on the verge of moving by Fo alone) are susceptible to seismic stimulation.
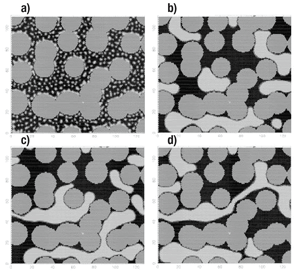
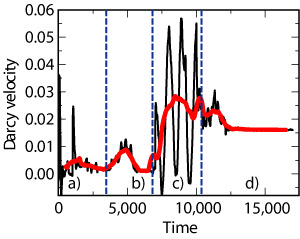
PARAMETERIZATION AND PROTOCOL In all the present simulations, the background force Fo is applied from left to right (the flow direction), while both the top and bottom and left and right flow boundaries are periodic. Some characteristic snapshots corresponding to the various stages of the simulation protocol used are given in Fig. 2, while the associated average Darcy velocity of the oil during each stage is shown in Fig. 3. The porous material in this demonstration example has porosity
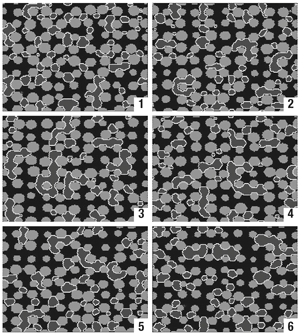
The simulation protocol is the same for each production run presented in this article and is broken into the four time intervals denoted in both Figs. 2 and 3 and defined as follows: a. The oil and water are allowed to spontaneously separate from an initial homogeneous distribution with all applied forcing set to zero. b. The background force Fo is then applied uniformly to both oil and water, initially causing some flow but often resulting (depending on both the value of Fo and the oil-volume fraction) in the oil becoming trapped on capillary barriers with an associated large decrease in the average Darcy velocity in the system. c. The seismic stimulation is then applied, such that Fa (the amplitude of any time-harmonic force created by the fluid-pressure perturbations applied in the stimulation borehole) is greater than zero. d. The seismic stimulation is turned off with a new steady flow state emerging under the influence of Fo alone. Only three seismic-wave periods of stimulation (corresponding to roughly 0.1 s of stimulation in the field) are ever applied in our simulations. If, as in field applications, the stimulation is applied for many millions of wave periods, the effect on the total volume of produced oil will necessarily increase beyond what we have determined here. The main pore-scale effect of applying the seismic stimulation is to mobilize the stuck oil droplets, which allows them to coalesce and form longer bubbles. Longer bubbles have a greater applied pressure drop along them, which allows them to more easily overcome the capillary barriers they encounter. In Fig. 3, it is seen that the oil was stuck (barely moving) prior to the application of the stimulation. In the final steady state that emerges once the stimulation is turned off, there is observed a system-spanning steady stream of oil created by the wave-induced coalescence of the oil droplets. Stimulation can easily create such system-spanning streams when the oil occupies roughly 40–60% of the pore space. As the oil volume fraction increases, there becomes enough oil that the background force alone can create a system-spanning stream and the oil never becomes trapped. As the oil volume fraction decreases, the likelihood of creating such a single system-spanning stream, even with stimulation-induced mobilization and coalescence, is progressively reduced. In order to keep the oil droplets moving at such lower oil volume fractions, it is necessary to repeatedly apply the stimulation. In real, 3D, non-periodic systems, even if a system-spanning oil stream develops, it will potentially break up due to the Rayleigh instability, which is the 3D effect responsible for the pinching off of droplets at a slowly dripping faucet. The smaller bubbles so created will become trapped again on capillary barriers, in which case repeated stimulation will again be required. RESULTS FOR SIX MATERIALS We next focus on the oil production occurring in six porous materials, Fig. 4. The permeabilities and porosities of these six materials are shown in the legend of Fig. 5 (and subsequent figures). In all the examples presented here, the oil occupies one-third of the pore space and water occupies the other two-thirds. We conservatively chose this oil-volume fraction so that system-spanning oil streams were not created.
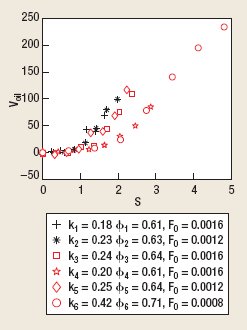
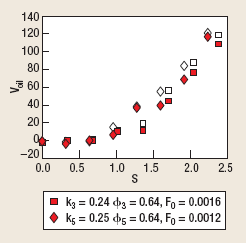
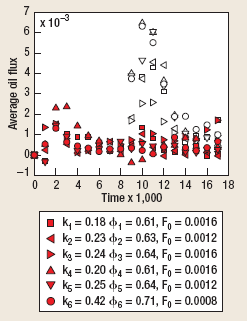
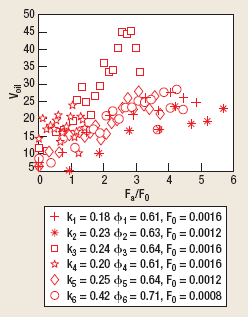
For each of the six different porous materials studied, Fig. 5 shows the corresponding total oil production during an entire production run (the entire 18,000-time-step simulation) when no seismic stimulation is applied. The plotted quantity is the specific oil volume that we define as: where joil is the local volume flux of oil (from left to right), Figure 5 shows that for all six media studied, the dimensionless “stimulation number” S ≈ 1 corresponds to the threshold background force Fo above which the oil flows by the background force alone without becoming trapped. The roughly linear dependence Voil ~ S in Fig. 5 once S > 1 is simply a statement of the emergent Darcy’s law. In order to determine S at each level of applied force Fo, it is necessary to numerically measure the average length h of the oil ganglia found in each system. The same experiments are next performed with the inclusion of three cycles of seismic stimulation between time steps 9,000 and 12,000 with Fa / Fo = 1. The result is shown in Fig. 6 for two of the six materials; however, similar results hold for all six. The stimulation is seen to enhance the total oil produced during the run even though the seismically coalesced bubbles are not able to form system-spanning streams. If stimulation was applied for more than just three time-harmonic cycles, the enhancement would have been greater.
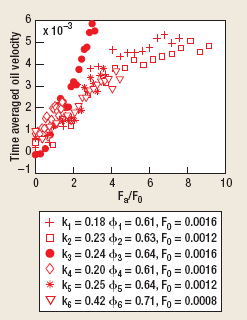
A better way to see the effect of stimulation on the oil production is to monitor (as in Fig. 3) the average Darcy flow throughout the system
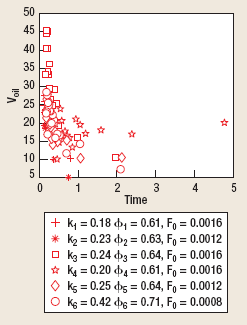
Mobilization and coalescence of trapped bubbles may only occur if the oil bubbles are moved a significant distance in a wave period compared to the pore length. To quantify this condition, we carry out simulations with different ratios (T) of the pore-length scale ℓ to the fluid displacement due to the acoustic oscillations. This suggests that when T > 1, stimulation ceases to have an effect. In Fig. 8, total produced oil is plotted as a function of T, and indeed a critical T is observed around the value of 1.
The finite oil production for T > 1 is due both to the initial displacement that takes place before stimulation is applied (Figs. 3a and 3b) and to the fact that not all oil becomes completely trapped in the steady state prior to stimulation. In Fig. 9, the specific volume
CONCLUSIONS The numerical simulations performed in this study strongly support the conclusion that seismic stimulation will mobilize trapped oil, thus increasing oil production, when certain criteria are met, among them: • The seismic wave has to push on the oil bubble with enough force that the downstream meniscus has its radius of curvature reduced to the point that it can get through the pore throat constriction that is blocking its downstream progress. • In a cycle of the time-harmonic stimulation, the meniscus has enough time to advance through the constriction before the seismic force changes direction and begins to push the meniscus upstream. These two conditions may be achieved by using sufficiently large stimulation amplitudes and sufficiently small stimulation frequencies. Interestingly, when the stimulation force is modeled as that due to a seismic wave, and if seismic strain is independent of frequency, we predict that Fa increases linearly with frequency, while T becomes independent of frequency. Of course, the imposed seismic strain from different seismic sources working at different frequencies need not be the same. Furthermore, in the field, the strain of a wave is always reduced at higher frequencies by seismic attenuation. So there are many practical tradeoffs to consider when choosing which source to work with and at what frequency. Further numerical studies should be performed that 1) take the simulations from two dimensions to three; 2) work with more grains in each flow cell; 3) apply the stimulation for many hundreds (or more) of seismic wave periods; and 4) use alternative ways to simulate the way the oil becomes trapped in the system in the first place. As an example of this last point, one may wish to start with a large volume fraction of oil in the system, and perform an imbibition experiment until the advancing water front forms a percolating backbone. The oil that remains may be only marginally stuck and thus more susceptible to the effects of seismic stimulation. There is no intrinsic difficulty in performing the lattice-Boltzmann simulations in 3D. It is mainly a matter of applying a larger computational effort. We conjecture that 3D simulations will reveal that the greater number of junctions and oil branchings that can occur in three dimensions will result in a larger number of marginally stuck fingers of oil. On the other hand, the Rayleigh instability (an effect confined to 3D) will tend to break up larger ganglia into smaller ones, in particular when the solid is wetted by the water as in our simulations. In this case, the stimulation will need to be applied repeatedly in order to continuously remobilize and coalesce the oil droplets. Lastly, in 3D the porosities can be reduced to those in real rocks because the pore space remains connected across a sample even as porosity approaches zero. * Analytical criteria are defined in Pride, S. R., Flekkøy, E. G. and O. Aursjø, “Seismic stimulation for enhanced oil recovery,” Geophysics, 73. No. 5, September–October 2008. This article excerpts that paper with permission from the Society of Exploration Geophysicists. Find the original article at http://dx.doi.org/10.1190/1.2968090.
|
|||||||||||||||||||||||||||||||||||||||||||||||
- Applying ultra-deep LWD resistivity technology successfully in a SAGD operation (May 2019)
- Adoption of wireless intelligent completions advances (May 2019)
- Majors double down as takeaway crunch eases (April 2019)
- What’s new in well logging and formation evaluation (April 2019)
- Qualification of a 20,000-psi subsea BOP: A collaborative approach (February 2019)
- ConocoPhillips’ Greg Leveille sees rapid trajectory of technical advancement continuing (February 2019)

