Weak acid stimulates San Andres
The use of slowly reacting acetic acid at low treatment rates resulted in improved oil output while controlling watercut.
The use of slowly reacting acetic acid at low treatment rates resulted in improved oil output while controlling watercut.
Clint Brian, Apache Corporation; and Steve Metcalf, BJ Services Compano
Carbonate formations predominant in the Permian Basin are repeatedly stimulated with acids to maintain productivity over the life of a well. Acid reacts on carbonates to create wormholes when pumped at matrix injection rates. These wormholes facilitate production improvement by virtue of the increased surface area provided. Strong acids, such as hydrochloric, are very efficient at performing this task; however, they react very quickly and therefore when they encounter the beneficial surface area created by a previous acid treatment, they are often spent before achieving any increase in penetration. The success of an acid stimulation is dependent on the penetration into the reservoir. This can be hampered by accelerated reactivity with increased temperature, inefficient distribution of treating fluids over an interval, mineral solubility, rock hardness and changes in the exposed surface area on which the acid can react.
Whereas a strong acid is limited in penetrating a carbonate that has been previously treated with a strong acid, a weak acid, such as acetic, is retarded enough to overcome this. A process to further enhance this penetration of weak acid has been developed and applied to 13 San Andres wells in the Permian Basin.1,2 Low-rate matrix treatments were used to minimize any increase in water production.
THE PROCESS
It has been previously reported that dilution of weak acids facilitates increased dissolution of carbonates.1,2 The reaction of acetic acid and other “weak” acids on calcite has been studied by many.3–8 Principle equations of this reaction are:
![]() Eq. 1
Eq. 1
![]() Eq. 2
Eq. 2
![]() Eq. 3
Eq. 3
![]() Eq. 4
Eq. 4
It has been found that when the partial pressure of CO2 is low and the pH is low, Eq. 1 is dominant, and when the pH is high Eq. 3 is dominant. For CO2 partial pressure greater than 0.1 atmospheres and pH greater than 5, Eq. 2 dominates the dissolution of calcite.3 Investigation into reaction kinetics of acetic acid on calcite using rotating disks determined that over the pH range 2.3–2.9 dissolution was mass transfer limited.4 However, the dissolution rates were lower than expected based on reactant diffusion coefficients. It was decided that the diffusion of the reactants to the surface and the products away from the surface interacted to reduce the dissolution. It was also found that above pH 3.7 the surface reaction rate has a major effect on the dissolution. Chatelain et al. determined that influence of the products transport away from the surface was the primary reason for the difference in dissolution.5 Fredd et al. determined the transition region to be at a pH less than 3.7.4 Several researchers have put together models for dealing with kinetic expressions governing weak acid reactivity and the associated equilibrium constants.4,6
The possibility of treating producing and injection wells with acid to a deeper penetration appeared to be feasible. The idea is to pump an organic acid at a high concentration into the rock and follow it with a large volume of fresh water. The acid will react with the rock to some limit based on the temperature, pressure and equilibrium constants of all the active participants. As the fresh water mixes with the acid, dilution will occur. Based on laboratory testing, the dilution changes the concentrations of all the active ions and the carbon dioxide, establishing a new equilibrium point and thus allowing the dissolution of more rock.1 The treatments are to be performed at low injection rates to facilitate the acid and water mixing. Once recovery of the treating fluids commences, any undiluted acid, at equilibrium, some distance into the formation will experience a pressure reduction resulting in CO2 gas being evolved from the solution, thus disturbing the equilibrium. This disturbance will result in the dissolution of more rock in an attempt to reestablish the equilibrium of the solution.
HISTORY AND OPERATION
The San Andres (about 4,700–5,700 ft deep) is a dolomitic formation with solution gas drive in combination with gas cap expansion.9,10 Average permeability is greater than 9 mD, and average porosity is greater than 13%. Acid solubility varies from 78% to 92% in 15% hydrochloric acid. The main components of the lithology are dolomite (77–92%) and anhydrite (3–20%). Bottomhole temperature is typically 100–125°F.
The keys to a successful stimulation treatment are deep penetration, staying out of water and keeping costs down. Since these wells have been acidized before, the effectiveness of a subsequent acid treatment depends on making changes to either rate, volume or type of acid system used. Because rate is limited by the desire to avoid stimulation of water zones and volume is limited to minimize cost, a change in acid system offers the best option. An acid system with reactivity control or retardation has to be used.
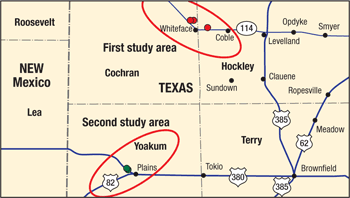
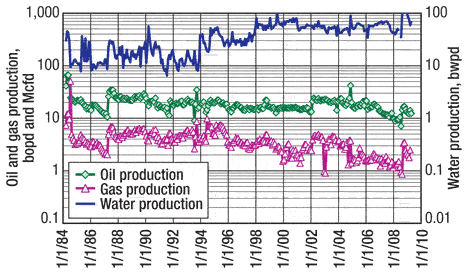
First study area. Three wells in the first study area near Whiteface, Texas, (Fig. 1) were originally completed more than 19 years ago with 5½-in. casing and 2⅜- or 2⅞-in. production tubing to about 4,850 ft. San Andres perforations are from 4,800 to 4,834 ft. All three of these properties were acquired in late 2004, and all three well files contained no well history from 1991 through June 2008. Given the history of other San Andres wells in the area, it is assumed that fluctuations in production over this time period are the result of chemical treatments, acid stimulation, workovers or some combination of the three. Without the actual well files it is impossible to know exactly what took place. An opinion is therefore presented as to what might have happened to cause the changes in production for these wells. Well 1 was acidized on initial completion with 5,400 gal of 15% hydrochloric acid. It was re-acidized in 1987 with 4,000 gal of 15% HCl, which was followed with a chemical treatment. Production response from this operation was significant, with oil and gas increasing about 100% and 200%, respectively, while water increased about 80%. At the end of 1991, a probable wellbore cleanout and chemical or acid treatment was performed as oil, gas and water production all increased by 25–75%. In early 2002 a possible chemical or acid treatment was performed; however, only oil and gas production increased while water remained the same. There are other times in the life of this well during which fluctuations in production occurred, but without records it is difficult to know specifics.
 |
|
|
Well 2 was also acidized on intial completion with 5,800 gal of 15% hydrochloric acid. In November 1988, a possible chemical treatment or hot oil job was performed; the water production remained fairly flat but oil and gas increased. There was another change in production in the middle of 1990. It is hard to tell exactly what took place. In the middle of 1991, again there was a change in production; it is assumed that a pump change took place at this time. In the middle of 2002, there was a threefold increase of water, oil and gas. However, after this event oil and gas declined rapidly while water kept increasing. Most likely an acid job occurred at this time.
As with the others, Well 3 was acidized initially with 4,850 gal of 15% hydrochloric acid but had to be re-perforated and acidized 5 months later with 6,000 gal of 15% HCl. In October 1995, water, oil and gas production increased; it is assumed that some sort of a stimulation was performed, most likely an acid job. In May 1998 there was another change in production. Because the well was down the preceding month, it is suspected that some sort of a pulling job was performed; a stimulation treatment could have been performed as well. In December 1999 a possible chemical and/or stimulation treatment was most likely performed. In November 2004 a possible pump change was made. The increase in oil and water was very short lived and could have been the result of replacing an inefficient pump.
A new treatment using concentrated weak acid was designed for these three wells. The treatments incorporated 750 gal of 15% hydrochloric acid and ball sealers for diversion to ensure good fluid entry into the perforated intervals prior to pumping 2,000 gal of 30% acetic acid solution, which was flushed with about 40,000 gal of fresh water. The wells were treated at a low injection rate (3–4 bbl/min.) in order to minimize the increase in water production. The treatments took place in June and July 2008.
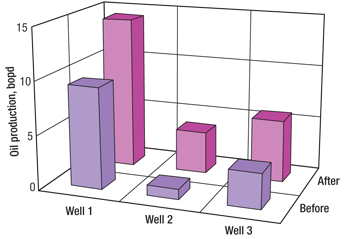
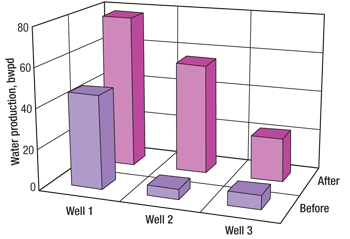
Figure 2 illustrates the production history of Well 1, and Figs. 3 and 4 give a summary of the oil and water production responses, respectively. Oil production for all three wells was increased by an average of 145%, while watercut increased an average of 12% on Wells 2 and 3 and only 1% on Well 1.
 |
|
|
 |
|
|
 |
|
|
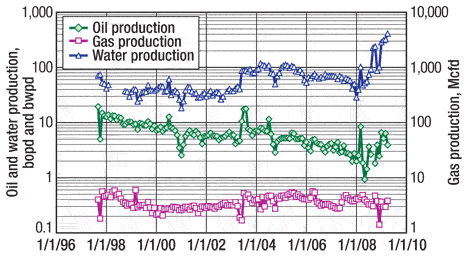
Second study area. Two wells in the second study area near Plains, Texas, were originally completed 12 years ago with 5½-in. casing and 2⅞-in. production tubing to about 5,400 ft. The San Andres perforations are from 5,228 to 5,298 ft and, similar to the wells in the first study area, were acidized initially with 4,000–5,000 gal of 15% hydrochloric acid. Both of these properties over their producing life have been treated similarly to those described above in the first study area, with the same resulting production fluctuations.
As can be seen in the production history of Well 1 (Fig. 5) a change in production occurred at the beginning of 2001. Although there is no record of what occurred, it is assumed that a hole in the tubing was repaired. At the beginning of 2003, however, a 4,500-gal treatment of 15% hydrochloric acid was performed when 20 ft of additional perforations were added. The production response to this was about a 50% increase in oil and 33% in gas, while there was an approximate increase of 5% in watercut after production had stabilized.
 |
|
|
Most recently, engineers designed similar treatments to the ones described in the first study area, using concentrated weak acid, for the two wells in this study area. Unlike the wells in the first study area, no hydrochloric acid or ball sealers were used prior to pumping 2,500–3,000 gal of 30% acetic acid solution, which was flushed with about 40,000 gal of fresh water. However, in the acetic acid solution, ball sealers were utilized for diversion. These wells were also treated at low injection rates. Treatments took place in August 2008, resulting in an oil production increase averaging 106.5% while watercut increased an average of 2%. Oil production on Well 1 after this treatment is nearly the same as after the 2003 acid treatment.
CONCLUSIONS
Production increases of 9% to over 300% were achieved using the changes in equilibrium produced by 30% acetic acid on the San Andres wells in the two study areas discussed, with an average increase of about 125%. Low treatment rates along with the use of the more slowly reacting acetic acid controlled the watercut changes from 0% to 12% with an average change in the two study areas of about 5.8%. ![]()
LITERATURE CITED
1 Metcalf, A. S., Parker, C. P. and J. L. Boles, “Acetic acid demonstrates greater carbonate dissolution than typically expected,” Journal of Canadian Petroleum Technology, 44, No. 12, December 2005, pp. 22–24.
2 Metcalf, A. S., “Acetic acid successfully stimulates San Andres,” presented at the 56th Annual Southwestern Petroleum Short Course, Lubbock, Texas, April 22–23, 2009.
3 Rietjens, M., “Sense and non-sense about acid-induced sludge,” SPE 38163 presented at the SPE European Formation Damage Conference, The Hague, June 2–3, 1997.
4 Nierode, D. E. and B. B. Williams, “Characteristics of acid reaction in limestone formations,” SPE 3101 presented at the SPE 45th Annual Technical Conference and Exhibition, Houston, Oct. 4–7, 1971.
5 Plummer, L. N., Wigley, T. M. L. and D. L. Parkhurst, “The kinetics of calcite dissolution in CO2–water systems at 5° to 60°C and 0.0 to 1.0 atmospheres CO2,” American Journal of Science, 278, February 1978, pp. 179–216.
6 Fredd, C. N. and H. S. Fogler, “The kinetics of calcite dissolution in acetic acid solutions,” Chemical Engineering Science, 53, No. 22, October 1998, pp. 3863–3874.
7 Chatelain, J. C., Silberberg, I. H. and R. S. Schechter, “Thermodynamic limitations in organic acid-carbonate systems,” SPE 5647 presented at the SPE 50th Annual Technical Conference and Exhibition, Dallas, Sept. 28–Oct. 1, 1975.
8 Buijse, M., de Boar, P., Breukel, B., Klos, M. and G. Burgos, “Organic acids in carbonate acidizing,” SPE 82211 presented at the SPE European Formation Damage Conference, The Hague, May 13–14, 2003.
9 Davis, B. J. and R. Maharidge, “Mechanical rock properties and petrologic analysis of drilled sidewall core plugs,” BJ Services Internal Report 02030239, May 2002.
10 Davis, B. J. and R. Maharidge, “Mineralogical analysis of whole core segments,” BJ Services Internal Report 99030173, April 1999
.
THE AUTHORS |
|
 |
Clint Brian graduated from Texas A&M University in 1996, and was employed by Halliburton Energy Services from 1997 to 2004, specialized in production enhancement and zonal isolation. In 2004, he joined Apache Corporation, where he holds the title of Senior Production Engineer and is responsible for the maintenance and operation of about 750 wells located primarily in Yoakum County, Texas. Mr. Brian holds professional engineering licenses in petroleum engineering in Texas, Louisiana and Oklahoma. |
 |
Steve Metcalf is the Permian Basin Region Technical Manager for BJ Services in Midland, Texas. He received a BS degree in chemistry from Emporia State University in 1972 and an MS degree in physical chemistry from Kansas State University in 1975. He is a registered professional petroleum engineer in Oklahoma. Mr. Metcalf has 34 years of industry experience working for both service and operating companies in Texas and Oklahoma, and has held various research and engineering positions. He is a member of the Society of Petroleum Engineers and has co-authored several papers in the areas of cementing, acidizing and fracturing. |
|
|
- Coiled tubing drilling’s role in the energy transition (March 2024)
- Shale technology: Bayesian variable pressure decline-curve analysis for shale gas wells (March 2024)
- What's new in production (February 2024)
- Using data to create new completion efficiencies (February 2024)
- Digital tool kit enhances real-time decision-making to improve drilling efficiency and performance (February 2024)
- E&P outside the U.S. maintains a disciplined pace (February 2024)


