Porosity calculation can mis-estimate reserves; defining invasion fluid densities improves accuracy.
Chanh Cao Minh, Schlumberger; Emmanuel Caroli, Total; and Padmanabhan Sundararaman, Chevron
In a rhetorical thesis by a long-departed pioneer in the art of well log interpretation, the author asked, “What’s a milli-mho worth?” He was trying to make the point that even a small measurement, if done inaccurately, can make a significant difference when it is magnified to reservoir scale. Today, we ask, “What’s a p.u. worth?”
In this case, every acre-foot of a typical reservoir of 30% porosity and 20% water saturation contains about 1,862 bbl of oil, or 62 bbl per porosity unit (p.u.). At today’s prices, that’s a little more than $3,100 worth. Insignificant? Not when you figure-in the number of acre-feet in a typical commercial reservoir.
Looking at it another way, typically we compute porosity from the density log by dividing the difference between the density of 100% matrix rock and the log reading by the difference between the density of 100% matrix rock and the density of water using the familiar porosity equation. The density of the matrix rock can be obtained from cores or spectroscopy logging.
The density of the formation fluid is assumed to be 1.0 g/cc, or that of fresh water. But what if the fluid in the formation within the density tool’s volume of investigation is not water, but some admixture of mud filtrate, water and crude oil or gas? This could lead to an erroneous estimation of porosity. For example, in a 30 p.u. sandstone drilled with Oil-Based Mud (OBM), every 0.1 g/cc error in fluid density leads to a 1.5 p.u. error in porosity. Using the above analogy, that’s more than $4,650 worth (times the reservoir size). At reservoir scale, the error could easily be more than 1 million bbl.
The problem of compensating for the near-wellbore fluid effects on density porosity computation is not new. In 1962, Gaymard and Poupon proposed a method that assumes uniform distribution of hydrocarbon throughout the tool’s volume of investigation when matrix density is known. Almost twenty years later, Suau noted that near-wellbore fluid concentrations can vary radially and took into account the different depths of investigation of density and neutron devices in an attempt to compute total porosity with greater accuracy.
BREAKTHROUGH TECHNOLOGY
The development of the Nuclear Magnetic Resonance (NMR) tool gave petrophysicists their first opportunity to measure pore fluid independent of the matrix, and in 1998 Freedman and his colleagues proposed a technique, named Density Magnetic Resonance (DMR), to measure and compensate for near-wellbore fluid effects. Nevertheless, the DMR technique had one significant flaw. It assumed that all sensors see the same fluids. But the NMR tools of the time had very shallow depths of investigation (about 1 in.), whereas Compensated Neutron Logs (CNL) measured as much as 1 ft into the formation. Density tools were somewhere in-between.
Three-dimensional NMR tools measure transverse relaxation time (T2), longitudinal relaxation time (T1), and diffusion (D) at a precise depth of investigation depending on the focal point of their antennae. By pinpointing the location of the formation fluids being measured, a 2D map of T1, T2 and D can be drawn that describes the volume and saturation of individual fluids, and thus total porosity can be estimated. These tools, however, are impractical for macro-porosity estimation because of their slow logging speed and unfavorable vertical resolutions.
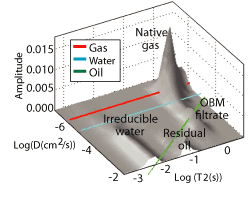
The new 4D MR Scanner tool adds a greatly improved radial dimension - the fourth dimension - with continuous measurement at six, discrete depths of investigation called “shells” that resemble concentric 45º arcs. These extend between 6-in. and 18-in. long axially. For the calculation, measurements are typically chosen from the shells located at 1.5 in., 2.7 in. and 4 in. from the surface of the sonde, Fig. 1.
 |
|
Fig. 1. The new tool produces discrete sample volumes at precise radial depths of investigation to profile the radial distribution of pore fluids.
|
|
By simultaneously processing data from all shells, a radial distribution of fluid parameters can be described. The idea is to estimate the variable fluid-mixture density with 3D NMR at multiple depths of investigation, and then use it in the density-porosity computation, assuming the matrix density is known. Since the NMR measurement is unaffected by matrix, this is a robust way to calculate continuous porosity, compensated for fluid density variations over large vertical intervals.
The geometric response of the formation density tool can be approximated by a hyperbolic tangent function of the radial distance from the wellbore interface, thus the approximate response can be determined at the three discrete investigation depths chosen. By including a zero-point, the density reading at the wellbore wall, subsequent data fitting from the tool’s values gives distributed fluid density correlations of reasonable accuracy. When extrapolated out to 6 in., the full response can be estimated within 4%.
EXAMPLES
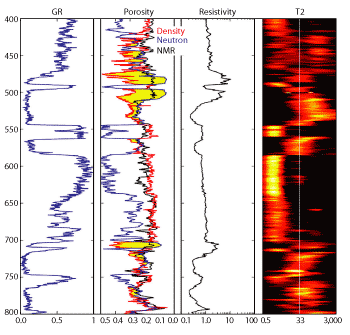
A well drilled using OBM in West Africa encountered unconsolidated sandstone with excellent porosity and permeability. The matrix density determined from core analysis was 2.65 g/cc. Openhole logs that included a high-resolution 1D NMR T2 image were run, Fig. 2. Hydrocarbon intervals can be identified by observing the traditional density/neutron “hourglass” profile (colored yellow in Track 2). At around 500 ft to 700 ft, the gas effect ranges from 40 p.u. to 30 p.u., making accurate determination of true porosity problematic.
 |
|
Fig. 2. Openhole logs illustrate large gas effects in zones around 500 ft and 700 ft.
|
|
Absent a measurement of actual fluid density, interpreters choose a constant 0.9 g/cc for their calculations. This is a compromise that attempts to account for the presence of hydrocarbons in the near-wellbore region caused by OBM filtrate invasion. In performing a detailed interpretation, the petrophysicist can choose different values for water zones, oil zones, gas zones and shale sections, but the selection is arbitrary and depends on the interpreter’s individual skill and local experience.
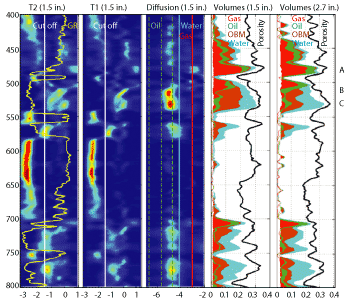
In this case, the well was also logged with the new tool, Fig. 3. The first three tracks display T1, T2 and D distributions, respectively, for the 1.5-in. dataset. Fluid volumes for both 1.5-in. and 2.7-in. datasets are shown in Tracks 4 and 5. Point A in the gas zone at 480-ft, point B in the oil zone at 510-ft and point C in the water zone at 525-ft illustrate how fluid density can cause porosity calculations (black curve) to change continuously with changes in fluid volume distribution.
 |
|
Fig. 3. 4D MR Scanner logs and porosity volume plots at each of two depths of investigation (right two tracks) reveal differences in porosity calculations.
|
|
DOES IT MATTER?
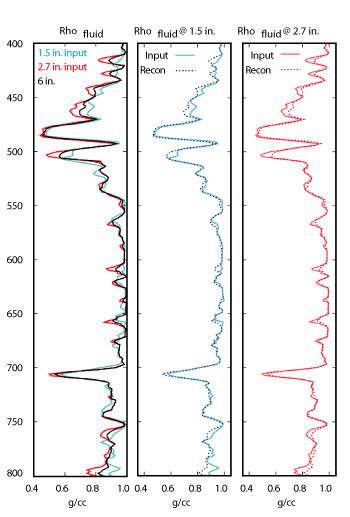
A look at the fluid density curves for the two depths of investigation and the 6.0-in extrapolation shows the dramatic effect of mud filtrate invasion of the gas-bearing sand bodies, Fig. 4. Fluid density varies from 0.45 g/cc in the gas sands to 1.0 g/cc in the shales. Any porosity calculation method assuming a constant fluid density will return significant errors.
 |
|
Fig. 4. Fluid density variations displayed with input and reconstructed values at two depths of investigation.
|
|
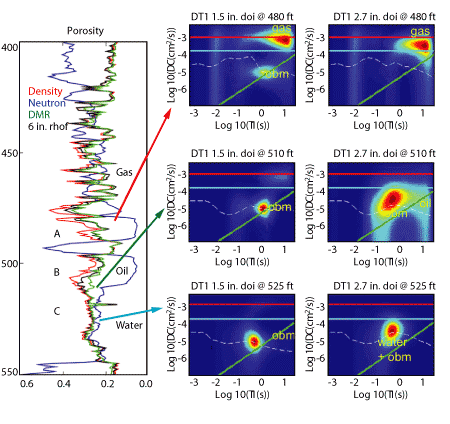
The results are shown in Fig 5. In the detailed section, three zones are highlighted: the gas zone (A) around 480 ft, the oil zone (B) underneath it at 510 ft and the water zone (C) below at 525 ft.
 |
|
Fig. 5. Radial plot comparisons between DMR (green) and density porosity computed using variable fluid density (black) show changes in fluid distribution.
|
|
Radial fluid distribution maps for each zone at both 1.5-in and 2.7-in depth of investigation are arrayed to the right. These are logarithmic crossplots of T1 versus D. The variations caused by non-uniform OBM invasion can be seen at the different depths of investigation.
The same situation was observed in oil wells. Using data from a West Africa well drilled with OBM, results were observed in a shaly sand series having good porosity and permeability. But variations in grain size and shaliness caused variations in permeability that produced complementary variations in filtrate invasion depths. Without a way to measure fluid density in situ, accurate determination of porosity would be problematic given the wide variations in fluid composition.
As one might expect, the volume of OBM filtrate invasion decreases with depth of investigation. The extrapolated 6.0-in. depth of invasion curve showed that fluid density in the sand bodies averaged 0.83 g/cc, considerably less than the 1.0 g/cc typically assumed when deriving density porosity. In fact, the density derived porosity differs from the MR-derived porosity by 3.0 p.u.
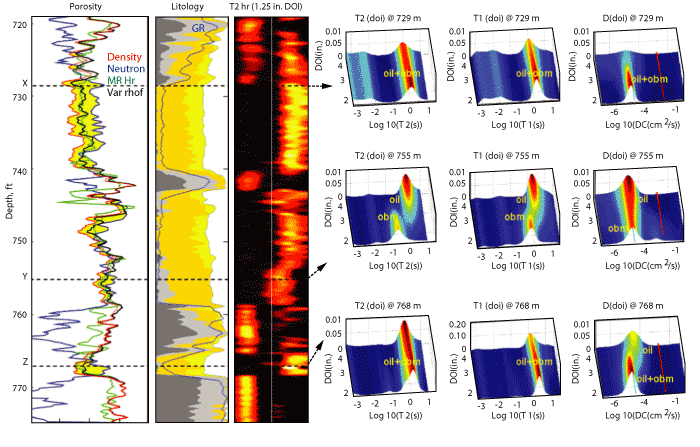
Three zones are identified in the resulting logs: Zone X at 729 m shows a large density/neutron separation with anti-correlation (mirroring effect); Zone Y at 755 m also shows density/neutron separation, but without the mirroring effect; and Zone Z at 768 m shows the separation, but again with the anti-correlation, Fig. 6. A look at Track 1 shows the porosity comparison between density (red), neutron (blue), high-resolution magnetic resonance (green) and the variable fluid-density (black) techniques.
 |
|
Fig. 6. Radial maps reveal fluid discrimination in Zone Y that results in pessimistic porosity calculation.
Click Image to Enlarge.
|
|
All three NMR parameters (T1, T2 and D) are crossplotted vs. depth of investigation maps for each zone and are shown to the right. The richness of detail is apparent. Oil can be easily discriminated from OBM filtrate, in Zone Y. In zones X and Z, the maps show a consistent single fluid at all investigation depths, interpreted as formation oil with little OBM invasion effect.
In this case, both density and neutron logs will have the same hydrocarbon effect. But in Zone Y, the neutron log sees a different fluid than the density log (leading to the lack of mirror effect). This means that the neutron is affected much more by the hydrocarbon effect than the density log and any attempt to compute total porosity using standard hydrocarbon correction to both logs would result in a pessimistic value, giving a dollar value to answer the question: What’s a p.u. worth?
Why use a fluid tool instead of a matrix tool? Matrix density is far more likely to be known (after calibration with core data), and is more likely to remain constant over the reservoir than is the near-wellbore fluid density, which can vary because of invasion. 
ACKNOWLEDGEMENT
This article was derived from SPE paper 109051 presented at the 2007 SPE Annual Technical Conference and Exhibition held in Anaheim, California, November 11-14, 2007.
|
THE AUTHORS
|
| |
Chanh Cao Minh earned an MS degree in electronic and electrical engineering from Université de Liège, Belgium. He joined Schlumberger in 1978 as a field engineer working in France and Norway and has held various management and staff assignments in Europe, Southeast Asia, China and Saudi Arabia. In 2004, he became the Section Manager for combinable magnetic resonance in the NMR department at Schlumberger’s Sugar Land Product Center. Chanh is presently Petrophysics Domain Champion for West and South Africa.
|
|
| |
Emmanuel Caroli began working at IFP on basin-scale turbidite flow models. He joined Total in 2003 developing geochemical reacting reservoir models for acid-gas sequestration. He then became a wellsite geologist working on tight gas fields in Argentina, extended-reach wells in the Netherlands, and on development and exploration wells in Angola. Caroli has been the Chief Petrophysicist at Total E&P Angola since August 2005.
|
|
| |
Padmanabhan Sundararaman earned his PhD in organic chemistry from Florida State University. After spending some time as post-doctoral fellow at Stanford University, he joined Chevron as Senior Research Chemist. He spent 15 years as a geochemical specialist, then joined the petrophysics group working on various projects and locations. He is presently the Chief Petrophysicist at Chevron in Angola.
|
|
|


