Deploying a small, inexpensive, energy-efficient treatment system for contaminated groundwater in a remote area presented many challenges for the operator.
Katharyn M. Lee, R.T. Hicks Consultants
In southeastern New Mexico, produced water has Total Dissolved Solids (TDS) levels between 2,000 and 100,000 mg/L. Legal produced water handling practices before the 1970s caused intermittent releases that impacted regional groundwater, soils and vegetation.
In 2001, during the closure of a saltwater disposal system, two adjacent sites in Lea County, N.M., showed hydrocarbon and chloride impact in soil and groundwater. The operator reported findings to the New Mexico Oil Conservation Division and began characterization with NMOCD approval to determine the extent and magnitude of groundwater impact.
Data collected quarterly from monitoring wells at these sites between 2002 and 2007 illustrate that historic releases of produced water impacted the surrounding area over time through elevated TDS concentrations. A treatment system was proposed in 2004 to provide water for beneficial use to land owners in the area. This article presents findings on the site conditions and the development and operation of a groundwater treatment system to produce water for beneficial use.
GROUNDWATER IMPACT
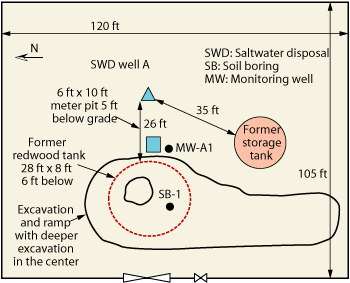
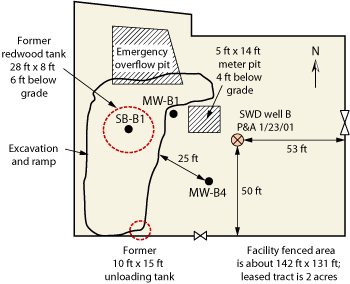
Information presented here was collected from a private produced water handling company. The saltwater disposal system served an area of about 5 mi by 4 mi from 1967 to about 2001. During closure of the system in 2001, two adjacent sites, about 1,250 ft apart, showed hydrocarbon and chloride impact in soil and groundwater. These sites were characteristic of many saltwater handling stations in the area, and located in a region developed for oil and gas production. Each site had a redwood tank 26 ft in diameter and 8 ft tall. These tanks had a capacity of over 100 bbl (4,200 gal) each. Both sites, here referred to as Site A and Site B, had a saltwater disposal well, Figs. 1 and 2. Site B had an emergency pit to handle additional produced water in the event of an overflow.
Records of saltwater handling for these sites are not available for the 34 years of operation, but one source indicates that in one month in 1997 the Site A disposal well injected over 200,000 bbl of produced water, and the well at Site B over 150,000 bbl. This allows for an estimate of 4.2 million bbl of produced water injected via the wells at these two sites per year. For much of the time of operation, legal saltwater handling practices included the use of redwood tanks, which were known to occasionally leak. The tanks were not lined, allowing a slow percolation of high-TDS water through the vadose zone (i.e., the section between the surface and the water table) toward groundwater. Redwood tanks were favored for saltwater handling because saltwater does not corrode and destroy them as it would metal tanks. At Site A, the fenced area is about 126 ft by 105 ft, and the leased tract is 2.5 acres.
Closure activities included removal of the redwood tanks and excavation of highly impacted chloride material from beneath the tanks and emergency overflow pit. Operators estimate that over 100 cubic yards of material were dug up and removed during closure activities at both sites.
Initial findings at Site A. As shown in Fig. 1, Monitoring Well A1 (MW-A1) was placed southwest of the edge of the tank excavation. In this boring, caliche was encountered from 2 to 12 ft deep, and caliche and sand from 12 to 18 ft. Fine-grained sand existed from about 21 to 63 ft, and groundwater was encountered at about 55 ft. Total depth was 63 ft. A 2-in. casing was installed with slotted screen from 50 to 63 ft. Chloride concentrations were relatively low and constant from 10 to 20 ft below the surface (190–340 ppm) but rose to 1,260 ppm at 30 ft and remained above 1,000 ppm down to the capillary fringe—here 50 ft below surface. It was inferred that saturated conditions must have existed in the subsurface to facilitate chloride migration.
 |
|
Fig. 1. Site sketch for Site A.
|
|
Subsequent groundwater sampling confirmed groundwater impact. The initial sampling event in January 2002 showed 5,200 mg/L of chloride and 9,425 mg/L of TDS in the groundwater, Table 1. Concentrations exceeded those permitted by the state’s Water Quality Control Commission (WQCC) for chloride, TDS and benzene.
| TABLE 1. Groundwater quality data, MW-A1, 2002 |
 |
|
Initial findings at Site B. The same sampling procedure employed at Site A was conducted at Site B. Caliche and caliche with sand were encountered from 2 to 18 ft deep, similar to lithology encountered at Site A. Sandstone was encountered from 18 to 21 ft, and sand from 21 to 63 ft. The well was completed with 2-in. casing with slotted screen from 50 to 63 ft, and groundwater was encountered at about 52 ft.
At Site B, chloride concentration increased from 10 ft below the surface to 20 ft, with the highest concentration (1,900 ppm) observed between 20 and 30 ft. The chloride concentration declined below 30 ft toward the capillary fringe. Given the soil profile indicating that the bulk of chloride was located about 25 ft above the capillary fringe, it was concluded that saturated conditions were less likely at this site and that most chloride did not reach groundwater. A monitoring well (MW-B1) completed in this boring yielded groundwater data showing an initial TDS of about 1,000 mg/L, supporting this conclusion. A dramatic increase in chlorides and TDS was observed at Site B, with chloride increasing by seven times and TDS jumping by five times over the initial 11 months of monitoring, Table 2. Here too, concentrations exceeded WQCC standards for chloride, TDS and benzene.
 |
|
Fig. 2. Site sketch for Site B.
|
|
| TABLE 2. Groundwater quality data, MW-B1, 2002 |
 |
|
Subsequent characterization. The NMOCD was notified of the vadose zone and groundwater impact at these sites. Additional investigations and remedial work have continued to the present.
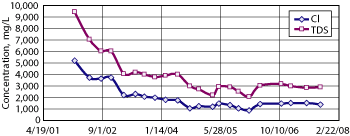
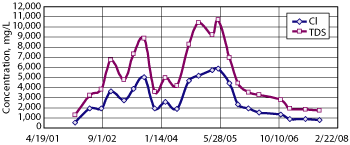
An Investigation and Characterization Plan was submitted to the NMOCD in March 2005, a Stage 1 and 2 abatement plan was submitted in December 2005, and a Vadose Zone Remedy Plan was submitted in November 2006. Quarterly sampling of MW-A1 and MW-B1 from 2002 to 2007 provides data regarding the fate of groundwater impacted by years of intermittent produced water releases, Figs. 3 and 4.
 |
|
Fig. 3. Chloride and TDS at Site A, MW-A1.
|
|
 |
|
Fig. 4. Chloride and TDS at Site B, MW-B1.
|
|
Observed dissolved solid concentrations at Site A have declined since sampling began, although a relatively steady state has been observed since 2005. The water quality since 2002 shows some periodicity, with drops and gains over each year, possibly due to changes in regional rainfall or pumping rates. Since the soil boring for this site showed the highest chloride concentrations near the capillary fringe, leaks from the redwood tank may have caused saturated conditions in the subsurface that drove chloride down into the groundwater. It is also possible that leakage stopped earlier and flushing occurred, driving chloride deeper. As Fig. 3 shows, chloride concentrations dropped significantly from January 2002 to February 2003, from 5,200 to 2,200 mg/L.
After 2003, declines in chloride and TDS concentrations are less dramatic. It is hypothesized that groundwater shows the effects of two different surface dynamics. Before 2002, intermittent produced water releases were migrating through the subsurface. After the tank was removed, the excavation that removed chloride-impacted soil from the surface to about 10 ft deep was left open from 2002 to 2007. This allowed rain to flush remaining chloride in the vadose zone from 10 ft deep to groundwater with greater efficiency than would have been possible had the excavation been backfilled. Groundwater concentrations appear to equilibrate with this open excavation scenario by mid-2005.
In August 2007, a barrier to vadose zone flushing was installed (discussed below), and the excavation at the site was backfilled, introducing a third surface dynamic. It is expected that this will stop the infiltration of chlorides from the vadose zone to the aquifer and that concentrations in groundwater will drop again in coming years. Even though no vadose zone barrier was installed at the site until 2007, the most recent groundwater sampling event in September 2007 showed a drop in TDS concentration by almost 7,500 mg/L (over 80%) in the past five years.
Site B has shown more varied TDS levels. As Fig. 4 shows, TDS at Site B climbed from 1,000 mg/L in 2002 to over 10,000 mg/L in 2004 and 2005. This climb caused speculation that Site A was hydraulically connected to Site B such that observed surges in Site B’s chloride were due to impacted groundwater coming from Site A. In 2006, a monitoring well, MW-A2, was placed between Sites A and B, but TDS and chloride levels in this well were at background concentrations and indicated neither groundwater impact nor a strong hydraulic connectivity between the sites. It was concluded that observed groundwater impact at each site was caused by localized surface releases.
Subsequent speculation concludes that the excavation of the tank and emergency pits at Site B followed by years without backfilling them allowed storm water to flush the chloride mass in the subsurface down to groundwater. Chloride and TDS data has been difficult to correlate between the two sites. TDS levels appear to be declining since 2005. As discussed regarding Site A, the surface dynamics at Site B have changed three times since 2002—first with the termination of historic leaks through the removal of the tank and emergency pit, then with the open excavation, and finally with the installation of an Evapo-Transpiration (ET) barrier in August 2007. Again, the effects of the installed barrier are expected to be seen in groundwater data over the next two years.
All of the monitoring wells are sampled quarterly and analyzed for Volatile Organic Constituents (VOCs) including Benzene, Toluene, Ethylbenzene and Xylenes (BTEX). Water is also analyzed for TDS, chloride and sulfate.
VADOSE ZONE REMEDY
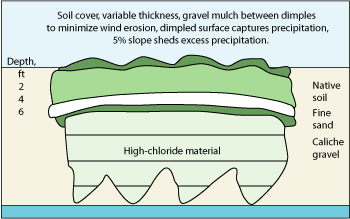
In late 2006, simulations of groundwater impact based on differing landfill closure models were used to select a proposed vadose zone remedy for the sites. The plan included the use of an ET barrier to prevent vertical flux of chloride in the unsaturated subsurface above the water table. This barrier would include 18 in. of caliche gravel below 12 in. of sand below 36 in. of topsoil, Fig. 5.
 |
|
Fig. 5. Proposed vadose zone remedy for Sites A and B.
|
|
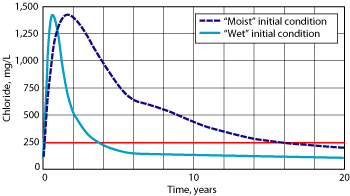
The topsoil would be seeded with native vegetation, which would pull moisture back toward the surface through the root zone. Vegetation would be encouraged by planting it in dimpled areas contoured to capture rainwater, and the entire cap would be domed or crowned to allow for surface water to slough off the area above contaminated soil. Model results predicted a rapid drop in chloride concentrations in the aquifer after installation of the ET barrier, Fig. 6.
 |
|
Fig. 6. Predicted chloride concentration in the aquifer with an ET barrier at Site A.
|
|
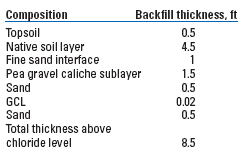
Additional soil bores in April 2007 showed that the subsurface still contained significant levels of VOCs, and the NMOCD requested amendments to the vadose zone remedy. A proposed remedy amendment included the addition of a Geosynthetic Clay Liner (GCL) beneath caliche gravel as part of the backfill plan and a thicker installation of topsoil to allow for deeper root zones. The GCL is about 0.5 in. thick and is composed of bentonite clay between two plastic sheets that may be rolled out on a smooth surface. These amendments were approved, and the excavations at these sites were backfilled according to the revised plan in June 2007.
The required changes resulted in added digging in the excavations to make them deep enough to hold the 8.5 ft of proposed backfill above chloride-impacted soil at the sites. The NMOCD had expressed concern that a gravel layer would not be a sufficient capillary break or barrier to downward moisture flow from the surface. The added GCL was placed below the gravel material, and the excavations were backfilled as detailed in Table 3. At both sites, topsoil was conditioned with decomposing hay to enhance re-vegetation and the area above the excavation was domed to shed excess water.
| TABLE 3. Backfill design to close excavation at Sites A and B |
|
|
|
POINT SOURCE TREATMENT SYSTEM AT SITE A
A treatment system was proposed for both sites in early 2005. The operator did not propose a system large enough to actively restore groundwater in the area, and thus relied on natural attenuation to address the bulk of groundwater impact at the sites. Planning to use the existing monitoring wells at each site for supply, the proposed system design called for a system capable of producing 1,000 gal/day of clean water for irrigation or livestock consumption.
Given water quality at the sites, this system needed components to substantially reduce suspended solids, VOCs and dissolved inorganic constituents. The goal was to create a relatively low-cost, low-maintenance system that could be powered with solar energy or conventional electricity to replace the source of water at the location of contamination.
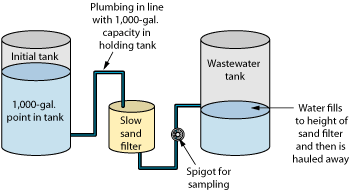
System design. Designs were considered for systems capable of producing 1,000 gal of freshwater daily at each site using a prefabricated RO unit designed to convert seawater to potable water on yachts. The yacht unit had the advantage of being prefabricated, tested and simple to maintain. The proposed treatment train included an initial tank to allow for VOC volatilization, a Slow Sand Filter (SSF) to remove suspended solids and provide additional degradation of the VOCs, and an RO system to substantially decrease TDS. The design called for a large tank to collect waste from the RO system and a stock tank to collect treated water.
Large, 100-bbl tanks were considered for the initial tank and the wastewater tank. Design was challenging because in most RO applications, a high volume of treated water is required and access to electricity and maintenance is relatively unlimited, whereas in this case, a small volume of treated water and low energy and maintenance demands were desired. Finding a nearby RO vender that was available to help with setup and ongoing maintenance was difficult. Furthermore, maintenance requirements were found to increase with a unit’s recovery rate. No RO unit capable of treating more than 50% of the water intake was available in a prefabricated system requiring little maintenance. Robust package RO systems designed for use on yachts or home use have a recovery rate of about 25%; i.e., for every 100 gal of intake they produce 25 gal of treated water and 75 gal of concentrated waste.
RO units for yachts are designed to treat seawater, which contains 20,000−30,000 mg/L of salts. The feed water at Sites A and B showed TDS up to 10,000 mg/L, suggesting that a unit designed to treat brackish water would be more suitable. The tank size and RO recovery rate would affect how often the waste tank would need to be emptied. Site A is over 50 mi from an operational saltwater disposal or oil and gas production system, and water hauler trucks can carry 100 bbl at a time. As a result, large tanks were preferred because they allowed for fewer trips to remove high-TDS water.
The prospects of a 100-bbl tank standing empty for relatively slow filling with wastewater at remote Site A raised concern. It was feared that a large empty tank would be a likely target of produced water dumping by other operators. It was decided that the tanks on the site would be only 35 bbl in capacity.
An additional complication was that the operator’s goals for the volume of treated water and recovery rate varied dramatically during the design phase. In 2006 it was confirmed that the landowner had no need for treated water. The original purpose of the system was replacement of a water source, but NMOCD had approved an abatement plan that included groundwater treatment.
Canceling the system due to the lack of demand for the water was not considered politically feasible. Water could be placed in a tank for wildlife consumption, and the system treatment volume scaled down. The final capacity for the designed system at Site A treats 50 gal/day for a small stock tank for wildlife consumption.
The water at Sites A and B contains turbidity and particles, hardness, TDS and volatile organics. Each of these can be removed or reduced by a number of known treatment processes.
The following treatment processes were evaluated for applicable constituents:
- For turbidity and particles—settling, slow sand filtration and microfiltration
- For volatile organics—passive air stripping (volatilization) and adsorption
- For hardness—ion exchange
- For TDS—ion exchange and RO.
Simple passive air stripping and settling would be accomplished by running water from MW-A1 into the top of an initial tank and giving it some residence time before sending water to the next treatment step. In fall 2006, a small tank was employed to test volatilization rates of VOCs in feed water from both sites. Water was analyzed upon removal from the wells and then at the end of each week. The operator preferred a system that did not include active aeration beyond the water falling from the inlet into the tank, so the prototype was not stirred or aerated, to test the possibility of allowing residence time alone to remove VOCs in feed water. In this test, initial BTEX levels were found to be lower at Site A than at Site B; observed volatile levels were below detection limits within 6 days for Site A, and within 11 days for Site B water.
Given these results, an initial holding tank with a residence time of 10 days and no active aeration component other than a high inlet into the tank was considered sufficient to remove VOCs from feed water. An SSF was chosen to remove particles and turbidity from water passing from the initial tank. In addition, the SSF would remove additional BTEX by biodegradation to provide added protection against fouling of the RO membrane by oil products.
 |
|
Fig. 7. Components of the initial treatment train.
|
|
Treatment train. In late 2006, a preliminary treatment train was installed at Site A. This included the following components (Fig. 7):
- A small, plastic, submersible DC pump set about 3 ft below the water level in MW-A1
- Electrical wires run from the pump to a small storage shed
- A DC/AC converter to allow AC power at the site to run the DC pump
- A timer capable of running on either AC or DC power to operate the pump
- A 1,500-gal initial tank to hold water from the well for 10 days
- A small, 400-gal/day SSF fitted with a port to allow sampling of outflow
- Another 1,500-gal tank to hold effluent from the sand filter.
The initial and waste tanks and the SSF were placed in a plastic-lined area diked to 2 ft high to contain any accidental releases. Because the pump had to fit down a 2-in.-diameter monitoring well, it was not designed for continuous use but rather for purging. The pump produced about 0.9 gal/min. and could not be run for more than 15 min. at a time to prevent burnout. Therefore, the timer was set to run for 10 min. every other hour. This allowed for collection of about 108 gal/day of water.
This system ran for about 6 weeks beginning in October 2006 at 100 gal/day, at which time the sand filter clogged. It was determined that, at that rate, the SSF would need “harrowing” about every 6 weeks. “Harrowing” unblocks filter flow by breaking up the schmutzdecke layer (the complex biological layer on the surface of the SSF that provides the effective purification) in the top 2 in. of sand.
Raw water from the well and output from the sand filter were analyzed for BTEX after about 2 weeks of operation, Table 4. Although BTEX concentrations were relatively low in the well discharge, VOCs were higher in the initial tank. The SSF effectively removed close to half of each constituent, but VOCs were still present in its outflow. Later, the treatment train plans were modified to include a Granular Activated Carbon (GAC) filter between the sand filter and the RO unit to collect residual VOCs.
| Table 4. VOC analyses for raw water, water in the initial tank, and effluent for the SSF |
 |
|
In early 2007, components for the entire system were assembled. Due to high barium levels in the feed water, the RO vender recommended an ion exchange water softener to reduce hardness, including magnesium, calcium and barium.
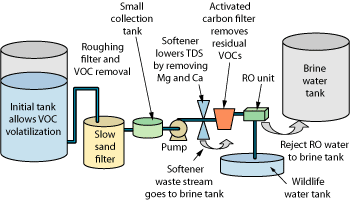
The assembled system employed residence time, an SSF, a small tank to collect water connected to a pump and pressure bladder, a water softener, a GAC filter, a 5-micron filter and an RO membrane selected based on feed water characteristics and the system’s low volume goals, Fig. 8. Timers run the system, which is checked by electric float valves in the initial tank and the wildlife tank to shut down the system should either of them come in danger of overflowing.
 |
|
Fig. 8. Components of the full treatment train.
|
|
System operation. Since the complete system was launched at Site A in January 2007, operation has encountered difficulties. Due to the site’s remoteness, the system was originally checked weekly. After 4 weeks of successful operation, in March 2007, the membrane in the RO unit no longer passed water and had to be replaced. When the membrane was replaced, the micron filter was replaced and a larger GAC filter was added. The system ran for another 4 weeks and failed in late May. During a routine system check, the fittings in the pipes were all found to be loose. The small collection tank had drained, causing the pressure pump to turn on and run for an unknown amount of time, apparently burning out the check valve. The membrane, micron filter, pressure switch and check valve in the pressure pump were all replaced.
A sample from each of the failed membranes from operation in March and May 2007 was extracted for observation with a scanning electron microscope. Both samples exhibited high levels of calcium; the sample from March showed higher levels of magnesium than the one from May. As both samples were analyzed in June, the hold times were very different. It is unknown whether the differences in crystalline structure seen on the two membranes are due to differences in scaling in the section of the membrane observed, or in crystalline development influenced by hold times. The feed water contains relatively high levels of calcium and magnesium (201 and 54.8 mg/L, respectively). Observation of scaling led to the conclusion that the softener either was not operating correctly or was insufficient for the feed water’s hardness load.
The softener’s internal regeneration clock was restarted every time the power to the system was turned off, which interfered with the scheduled regeneration. Field analysis showed a hardness level above 400 in the inflow and about 180 on the outflow. The softener was indeed functioning, but not at the required efficiency. Since the softener capacity was sufficient for the feed water hardness, it was concluded that additional regeneration cycles should bring the system back into order. Manual regeneration was added to the weekly system maintenance schedule. Directly after regeneration, field tests showed the softener was reducing hardness from more than 400 to less than 40, the lowest reading on the field test kit. Testing hardness of softener influent and effluent was added to the weekly data collection duties of field personnel to track softener performance.
During operation in August 2007, the system was set to draw in about 400 gal/day of water to increase the treated volume. With a 30% average recovery rate, this produced about 120 gal/day of treated water. This also substantially decreased the feed water residence time in the initial tank, from about 10 days to 2.5 days. Hydrocarbon levels increased in the initial tank, and the water took on a dark brown color; a sheen developed on the surface. BTEX observed in May 2007 sampling was higher than in January 2007. Furthermore, increased harrowing of the SSF (every other day) was required to keep the filter from getting clogged.
Increased hydrocarbon in the initial tank was likely due to a combination of increased drawdown in the pumping well and substantially shorter residence time in the initial tank. Operators concluded that increasing the pumped water flowrate only inhibited system performance, and that the RO system works best when calibrated to about 30% recovery. Extraction rates were readjusted to about 120 gal/day, allowing for about 36 gal of treated water each day at the current efficiency.
Troubleshooting. Since operation began with a small portion of the treatment train in October 2006, various features to simplify system operation have been added:
- Heating and cooling components for the system storage shed
- Flowmeters for intake and outlet
- Modified operation datasheets
- Electrical float switches
- A wildlife ladder in the stock tank to prevent accidental drowning of small animals
- Additional micron and GAC filters
- Additional sampling ports
- Additional maintenance including regularly scheduled regeneration of the softener and harrowing of the sand filter.
The operator and maintenance workers displayed a repeated preference for reliable, predictable system components. Though the SSF was considered a good fit for the system in that it doesn’t use energy or have moving parts, the operator found it difficult to work with due to the ambiguity in determining when it would become blocked based on fluctuations in water quality, and because its malfunction interrupts the entire system by blocking water flow to the rest of the treatment train. The operator would prefer a roughing filter if it would be more reliable, even though it would increase the overall treatment system’s electrical consumption. The ion exchange, pressure bladder and check valve were also sources of consternation due to uncertainty about how they operate and why they were necessary.
CONCLUSION
The idea of a small, inexpensive, energy-efficient groundwater treatment system for TDS-impacted water in remote areas for beneficial use was appealing to both the operator and state regulators. The reality, however, proved to be difficult. Despite efforts to keep the treatment train simple, the variety of constituents of concern in groundwater—together with efforts to automate the system and keep energy usage low, and the need for safeguards against overflow—added complexity that made the system hard to maintain. In the end, the operator came to question whether the environmental benefit of the system outweighed environmental costs; energy use to run and manage the system was substantial, and waste disposal concerns were created. Running the system off solar power was never considered feasible. As troubleshooting and system modifications continue at Site A, and groundwater quality at both sites continues to change due to biodegradation, dilution and dispersion, a treatment system has not yet been chosen for Site B. The operator has petitioned the regulator to allow for cessation of system operation at Site A in favor of allowing the ET barrier and natural attenuation work on groundwater cleanup alone. 
|
THE AUTHOR
|
| |
Katie Lee is in her sixth year as an environmental consultant at R.T. Hicks Consultants in Albuquerque, New Mexico. Her work includes environmental support to the oil and gas industry in southeastern New Mexico, environmental assessments of commercial real estate and issues pertaining to regulatory compliance. She has a bachelor’s degree in economics and a master’s degree in water resources from the University of New Mexico.
|
|
|


