After both the best and worst times in a generation, evidence of a modest recovery heartens the US land drilling industry; but gas production issues in a soft-demand market appear to be systemic.
Richard Mason, The Land Rig Newsletter
The land drilling sector followed the historic price swings during the last year, experiencing the best of times in decades in the summer of 2008, followed by the worst of times in a generation. For survivors, oil and gas price volatility added more spice during the last year than is normally seen in a career.
The late 2008 collapse in global economic activity and energy demand, coupled with deflating oil and gas prices, caused oil and gas operators to reduce capital expenditures and adjust to revenue flow that was 70% lower in the first quarter of 2009 than had been the case just nine months before.
US oil and gas revenues, as recorded by the US Energy Information Administration, fell from a peak of $46.7 billion monthly in July 2008 to $13.5 billion in February 2009, a decline of 71%. Any business associated with an industry that loses 70% of its revenue flow in nine short months will experience repercussions.
For the US land drilling sector, those repercussions involved operator rig capitulation as oil and gas companies released rigs by the hundreds from December 2008 until mid-May 2009. Widely followed public tallies such as the Baker Hughes Rig Count fell 57% from late September 2008 to June 2009.
But the rig count fell faster and farther than is generally understood. The Land Rig Newsletter studies of onshore rigs drilling only for oil or gas indicate activity dropped from a peak of 2,085 rigs in October 2008 to 774, when the rig count bottomed in May 2009, a decline of 1,311 units, or 63%. The magnitude of the drop rivals the 1986 oil and gas industry collapse on a percentage basis. Furthermore, rig count decline would have been as much as 300 units lower were it not for multi-year term contracts coupled with operator hedging. The latter artificially supported the economics of gas drilling in a glutted market and kept rigs active that otherwise would have been lain down if gas prices were settled in the spot market.
In January 2009, drilling activity was declining by 14 units per day, a remarkable number in that it shows how quickly the industry can shut down. That number is in sharp contrast to the opposite side of the cycle. The most the industry has added during high drilling demand scenarios over the last four years is roughly three rigs a day. So it’s far easier to let rigs go than to bring them back, a phenomenon that will have future implications when oil and gas markets tighten.
A VERY MODEST RECOVERY
While a modest recovery moved into its early stages as the second half of 2009 got underway, it is important to note that this is recovery on a relative basis and best understood by examining a laundry list of devastating numbers. The collapse in domestic drilling represents a loss of 28,000 direct rig-related jobs, many in rural areas where oilfield jobs rank among the highest-paying employment.
In October 2008, more than 245 contractors had one or more rigs employed in the US. In May, the number fell 44% to 136 drillers. It meant that more than 100 contract drilling companies had zero rigs active with some entering their fifth straight month of zero utilization. Telephone conversations by the author still found contractors who had yet to drill their first 2009 well as the second quarter wound to a close.
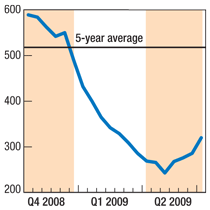
Similarly, the number of operators employing one or more land rigs fell from 589 companies in October 2008 to 243 when the rig count bottomed in May 2009, Fig. 1. This 59% decline in active oil and gas companies was unprecedented.
 |
|
Fig. 1. Oil and gas companies employing one or more rigs.
|
|
Slowing demand for drilling services was reflected in pricing for drilling rigs. Spot market rates fell between 40 and 50% and were down on average by roughly 25% for all day rates when factoring in legacy term contracts. For many contractors, the phone just didn’t ring. Others found operators kicking tires on pricing in the second quarter of 2009, but reluctant to commit on work. When they did, a dozen or more contractors found themselves bidding against peers for a project of only two or three wells.
Grass-root estimates from contractors indicated that the number of drilling jobs available for bid at market bottom in the second quarter of 2009 fell to about 100 nationwide, if one removes jobs associated with oil and gas companies that own their own drilling divisions. As a result, a few contractors bid equipment at cash operating costs. For example, reports of 1,500-hp rigs working for under $12,000 a day, though rare, circulated in coffee shops and trade association gatherings. A similar rig commanded $20,000 to $22,000 in October 2008, and $22,000 to $25,000 in 2006.
The plight of the 1,500-hp rig illustrates the devastating nature of the collapse. Demand for 1,500-hp units had exhausted the available supply of rigs in this class as recently as June 2008, as excitement reached frenzied levels in the newly discovered Haynesville Shale. The event prompted a new surge in newbuild, higher-spec technology rigs as a major part of the 90 newbuilds announced in the second quarter of 2008. At peak, this rig class was essentially fully utilized with 373 of the 434 rigs in this class working. Nine months later, oil and gas operators had their pick from more than 230 idled 1,500-hp units.
Those numbers provide context for viewing evidence that the worst was behind the land drilling industry as the second half of 2009 got underway. For one, revenue flow into the industry improved after bottoming in February, leading to a modest improvement in rig count a few months later, as the second quarter ended.
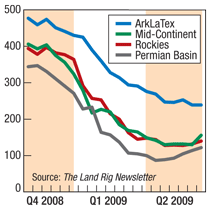
Figure 2 captures the rig count regionally from the October 2008 peak through the first half of 2009. Gas-dominated regions such as the ArkLaTex (Barnett, Fayetteville and Haynesville Shales) and the Rockies (Piceance and Jonah/Pinedale) flattened in the second quarter after steep declines that coincided with the first of the year. In contrast, rig counts moved up noticeably in oil-based regions such as the Permian Basin and Mid-Continent during the second quarter, stimulated largely by a rapid climb in oil prices. The irony is that while industry observers focused on gas markets and projected that lower-spec rigs would stack out permanently, it is, in fact, lower-spec legacy mechanical rigs that are leading rig counts off the bottom while the big units remain stacked.
 |
|
Fig. 2. Regional rig counts.
|
|
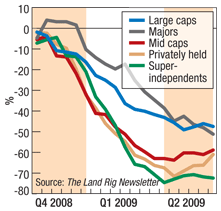
Figure 3 illustrates rig use patterns by operator class. Rig counts are normed to reflect percentage changes from the October 2008 peak rather than absolute rig counts. All operator classes are down substantially on rig employment; however, super-independents were largely unhedged. Rig employment for this group was down 70% from peak as second-half 2009 got underway. One example is Devon Energy Corp., previously the most active driller in the Barnett Shale. When gas prices fell below economic thresholds in the Barnett about the first of the year, rigs stacked out across the board. Devon went from rig activity in the high 30s to less than six in July 2009.
 |
|
Fig. 3. Change in count by operator class.
|
|
Both majors and large-cap independents declined the least in rig employment on a relative basis. The large caps were more widely hedged and have been active in hedging into 2010 as the second quarter drew to a close. Conversely, the pullback in rig employment among the majors is of special note, since this group historically has been stable in aggregate rig count, because the large multinationals were program oriented rather than commodity price driven. The fact that rig count has dropped for this operator class signals that this pullback is materially different from those that occurred over the last decade.
Privately held operators historically have had the most volatile rig employment. That volatility was evident as rig employment fell more than 70% from peak to trough. However, this group, which is generally associated with conventional vertical oil drilling, has followed higher oil prices back into the market and is leading rig count off the bottom.
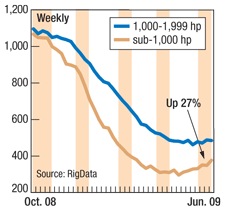
Figure 4 divides rig count into two separate classes based on drawworks horsepower. Sub-1,000-hp rigs constitute the first class. These are typically lower-spec legacy mechanical units and are often associated with conventional, vertical drilling with oil as a major target in areas like the Permian Basin, Mid-Continent or Rockies. Sub-1,000-hp rigs account for 60% of oil-directed drilling, while larger-spec rigs account for 67% of gas drilling. Of note, the rig count bottom coincided with the bottom in employment for sub-1,000-hp rigs. Similarly, smaller, legacy mechanical units are leading rig count off the bottom as privately held oil and gas operators, stimulated by higher oil prices, return to the drilling market.
 |
|
Fig. 4. Rig employment by horsepower.
|
|
Employment for larger-spec rigs, which are defined as rigs with between 1,000 and 1,990-hp drawworks ratings, fell more slowly than their smaller spec counterparts, helped in part by multi-year term contracts and operator hedging. These rigs are more often associated with major unconventional gas plays and work for public independents. The takeaway from the flattening rig count in this class is that there is a base level of drilling in the market, which is supported in part by operator hedging and, recently, joint venture arrangements, which have provided enough cash flow to keep these rigs turning to the right in a handful of unconventional plays.
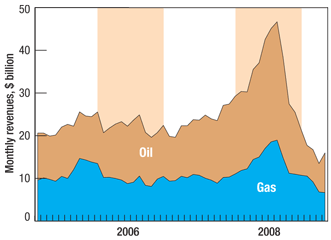
Figure 5 models US oil and gas revenue flows using EIA data on production and wellhead pricing between January 2005 and March 2009, the last month for which data was available at press time. Last year’s stellar run in oil prices created a record-setting spike in industry revenues. At peak, oil accounted for 58% of industry revenue flow. At the risk of over-simplification, oil revenues principally benefit the majors and smaller, privately held oil and gas operators. In contrast, gas revenues are biased toward the public independents.
 |
|
Fig. 5. Oil and gas revenue model.
|
|
Rig count rolled over about 90 days after oil and gas revenues peaked in 2008 and started up about 90 days after the revenue trough. Recently, revenue flow has diverged with gas-generated revenues drifting lower as the market confronts an oversupply situation in the wake of stubborn production and falling demand while oil revenues move higher. On a mark-to-market basis in late June 2009, revenues are biased two-thirds toward oil and one-third toward gas in this revenue model.
Nonetheless, revenues have fallen to 2004 levels. It is reasonable to assume that if operators live within cash flow for the foreseeable future, as many public firms have promised shareholders, the industry should see a return to rig count levels last evident in 2004. Rig pricing is very close to 2004 levels on the spot market. Ultimately, rig count fell within a band of 1,250–1,500 rigs during a similar revenue flow level a half decade ago, though the comparison is complicated by the fact that demand for drilling services exhausted the rig supply in early 2005, leading to substantial day rate increases coupled with a major retooling effort.
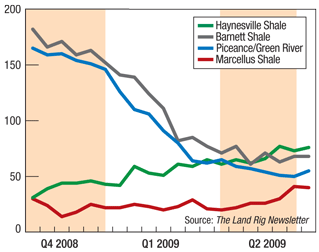
Figure 6 shows the rig count in four headline unconventional plays: three major shales and combined rigs for tight sands in Colorado’s Piceance Basin and Wyoming’s Greater Green River Basin. Two trends are evident. The first is the collapse in rig count in both the Barnett Shale and tight sands plays as gas prices fell below economic thresholds. For context, the Rockies tight sands count, which is predominately directional drilling, and the Barnett Shale are about equal. Both collapsed in tandem after the first of the year, falling almost two-thirds to maintenance level activity. Until regional gas prices improve, rigs in both areas will remain at maintenance levels.
 |
|
Fig. 6. Unconventional rig count.
|
|
One signal for a potential turnaround in the gas market will occur when gas production rolls over in the Barnett Shale, the largest unconventional gas-producing region in the domestic market. At the end of 2008, gas production was growing at the rate of 100 MMcfd per month in the Barnett, and it topped the 5-Bcfd level in early 2009. Current production estimates vary from 5 to 5.5 Bcfd even with the decline in drilling.
Another trend is expansion in drilling activity in the Haynesville and Marcellus Shales. On a nominal basis, the Haynesville is now the leading unconventional play in the US. Rig count in the Haynesville represents activity in seven North Louisiana parishes and does not include activity in East Texas where differences in geologic nomenclature make tracking Haynesville-specific rigs difficult. Similarly, Marcellus counts represent drilling only in Pennsylvania, not yet in northern West Virginia or New York.
Lessons from the past year’s events? It remains an oil and gas industry. Each market is subject to different influences. Rarely does the industry witness the stars aligning beneficially for both sectors at the same time as was seen in 2008, or maliciously as was the case in the first half of 2009. At the moment, higher oil prices are stimulating that drilling segment, while the gas-directed rig count faces further challenges.
The industry has witnessed a basketful of in-depth analyses addressing the number of rigs necessary to sustain gas production. That number is theoretical at best. A more reliable metric can be found in the revenues available to operators. Revenue flow will determine how the drilling industry finishes the second half of 2009. Oil prices above $60 could attract another 150 rigs into the market by year end, although oil in the low $50 range would likely create a W-shaped bottom in activity, with the rig count drifting back from current levels. A majority of these units will be legacy mechanical sub-1,000-hp units.
Natural gas is a more difficult cipher. As the second half of 2009 got underway, natural gas storage had exceeded 2.8 Tcf and was on its way to record levels. Nonetheless, several operators had used the futures strip during the second quarter to hedge production into 2010, or had traded acreage for developmental capital, indicating that the gas-directed rig count could add another 100 units before year end. But in a glutted market, expanded drilling efforts are setting the gas-directed rig count up for a W-shaped bottom. The problem with gas is systemic at the moment, thanks to ample production from the new shale plays and deflating demand. In essence, the industry, to date, has been idling the wrong rigs and continues to allocate assets to nascent, high-production shales. That effort postpones meaningful recovery in gas-directed drilling until domestic production rolls over organically. That inflection point will be difficult to determine, since operators will be shutting in gas production as storage builds in late 2009.
Consequently, gas drilling is not likely to see meaningful improvement until the second half of 2010. 
|
THE AUTHOR
|
| |
Richard Mason is publisher of The Land Rig Newsletter, a monthly publication that provides trends analysis for the land-based contract drilling sector of the oil and gas industry. He previously worked 10 years as a field historian for the Texas Tech University archives, collecting historical materials on petroleum, agriculture and irrigation development in the American Southwest. Mr. Mason is a 1974 graduate of Ohio University with a bachelor of arts degree, with honors, in history.
|
|


