What’s new in exploration
Lessons from the Barnett Shale imply caution in other shale plays
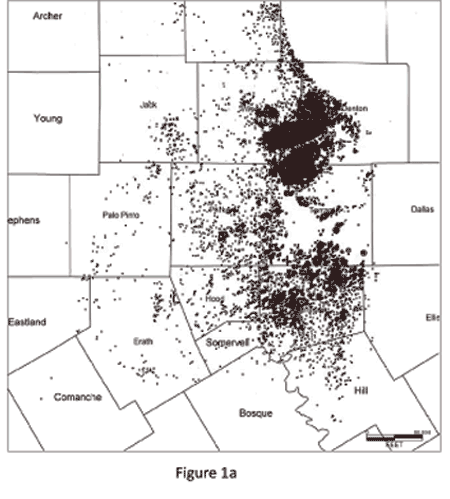
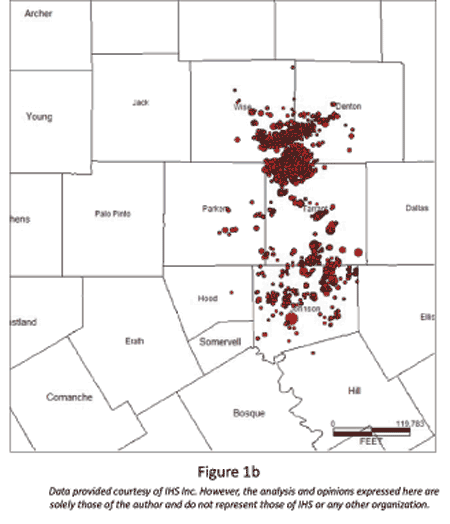
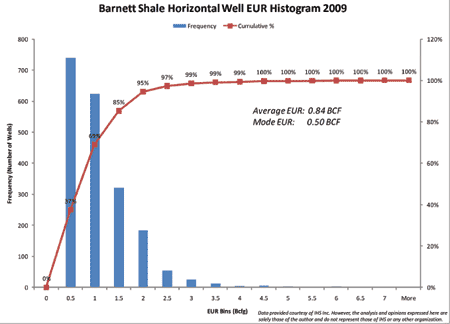
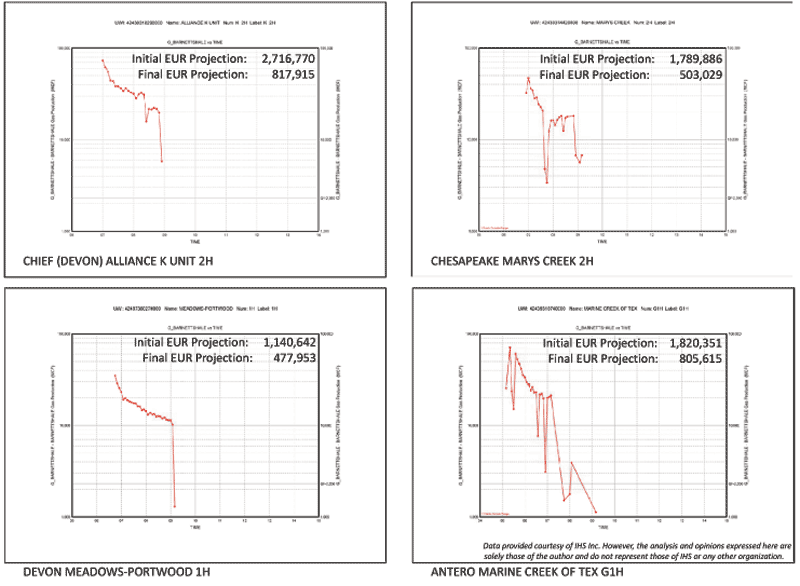
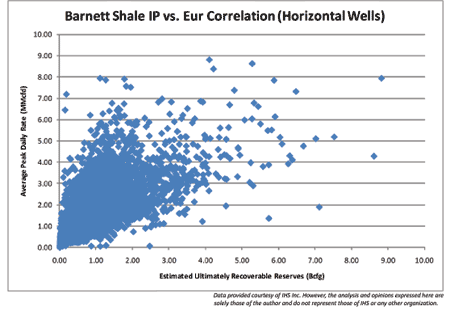
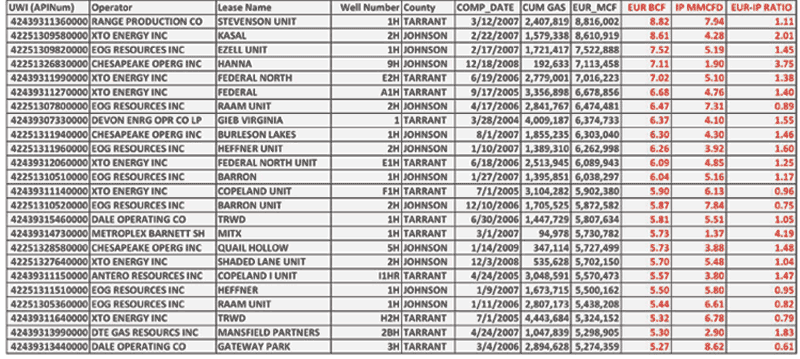
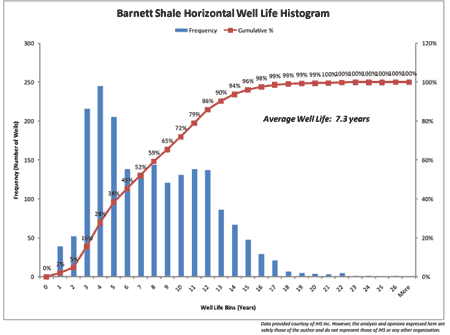
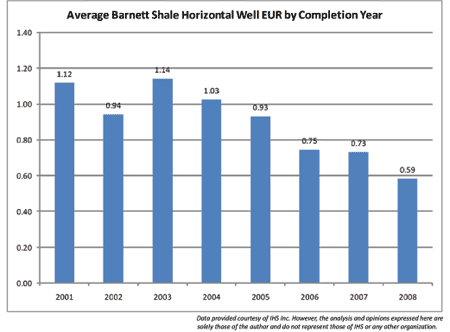
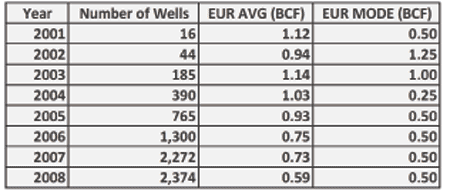
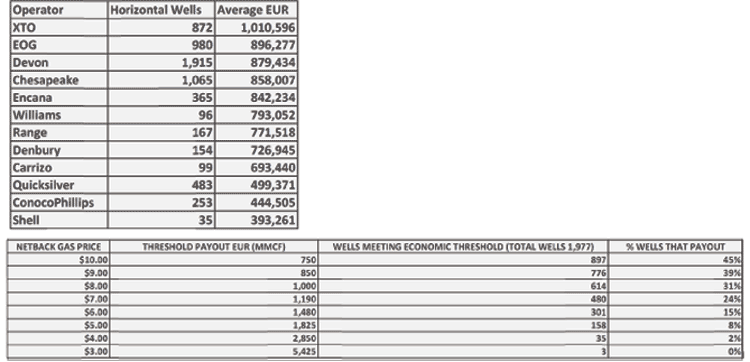
Lessons from the Barnett Shale imply caution in other shale plays The Potential Gas Committee said in late June that shale gas has increased the US resource base to more than 1,800 Tcf. Shale players are now more confident than ever that they are in the right business, while their executives and stock investment analysts proclaim that the “miracle” is that high capital costs combined with low gas prices somehow result in profit. Since little is known about the commerciality of new shale plays like the Marcellus and Haynesville, I decided to see what could be learned from the robust production history of the Barnett Shale. What I found surprised me. Most reserve predictions based on hyperbolic production decline methods were too optimistic when compared with production performance. There is little correlation between Initial Production (IP) rates and Estimated Ultimate Recovery (EUR). Average well life is much shorter than predicted, and the volume of the commercially recoverable resource has been greatly overestimated. Core areas of the play do not have appreciably higher EURs than the play overall, and the EUR from horizontal wells is not significantly greater than from vertical wells. The Barnett Shale was the first shale gas play to be commercially developed, and it is the standard of comparison for this play type. There are now almost 12,000 producing Barnett wells, of which two-thirds are horizontal and one-third are vertical. Cumulative gas production is 5.64 Tcf, of which 3.62 Tcf comes from horizontal wells and 2.02 Tcf from vertical wells. In this column in November 2007, I projected EURs for almost 2,000 horizontal wells in the Barnett Shale. At that time, these were the only horizontal wells with enough production history to evaluate. Now, with two additional years of production, I updated and revised the decline curves for the same control set of 1,977 wells. The overall EUR decreased 32% from my previous estimate, and the average per-well EUR fell from 1.24 Bcf to 0.84 Bcf. The reason is clear: Most wells do not maintain the hyperbolic decline projection indicated from their first months or years of production. Production rates commonly exhibit abrupt, catastrophic departures from hyperbolic decline as early as 12−18 months into production and, more commonly, in the fourth or fifth years for the control group. Workovers and additional fracture stimulations may boost rates to previous levels but rarely restore a well to its initial decline trajectory. More often, a steep hyperbolic or exponential terminal decline follows attempts to remedy deteriorating performance. This observation casts doubt on the common practice of “group curve fitting” to predict EUR from early production in newer shale plays. I decided to examine another common play evaluation technique: prediction of EUR from IP. I projected decline curves for all the horizontal wells in the Barnett, and the resulting cross-plot of IP versus EUR provided a broad range of EURs that might be associated with a particular IP. For example, the well with the highest EUR in the Barnett Shale (8.8 Bcf) has a good correlation with IP (7.94 MMcfd). The next-best well has a EUR of 8.6 Bcf and a poor correlation to an IP of 4.28 MMcfd, and the fourth-best well has a EUR of 7.1 Bcf and an even poorer correlation to the IP of 1.9 MMcfd. In the end, I would prefer a high IP to a low one but, since about half of the EUR is produced during the first year, a well’s early decline rate is more important than IP in predicting reserves. Operators often state that shale plays have about a 30-year production life. But I found that the average well life for horizontal wells is about 7.5 years, although the mode is 4 years. Many wells should have 8−12 years of production, but few will extend beyond 15 years. About 75% of predicted EUR in horizontal Barnett wells has been produced by year 5. The average EUR for all horizontal Barnett wells is 0.81 Bcf (the mode is 0.5 Bcf/well). This is about one-third of the 2.5-Bcf/well average predicted by many operators. My decline projections indicate that only about 300 horizontal wells in the play (4% of total) will reach or exceed a 2.5-Bcf threshold. Focusing on the core areas or “sweet spots,” the average EUR for wells in the Tarrant County core area is 1 Bcf, and 0.84 Bcf in the Johnson County core area. The US Geological Survey estimates technically recoverable Barnett gas resources of 26 Tcf, which many operators believe is too low. My calculations suggest that Barnett EUR, based on 11,817 horizontal and vertical wells, will be about 8.8 Tcf. An additional 23,000 wells would be required to reach 26 Tcf, at a cost of over $75 billion for leasing, drilling and completion alone. A final surprise is that horizontal wells do not have significantly higher EUR (0.81 Bcf) compared to vertical wells (0.62 Bcf). Horizontal completions only result in a 31% improvement in reserves for about 2½ times the cost. Put another way, the nominal unit cost of gas from a horizontal well is about $4.30/Mcf compared to $2.05/Mcf from a vertical well. When I state concerns about the economics of shale plays in the current low-price gas environment (World Oil, January 2009), operators sometimes dismiss them if they are hedged at higher gas prices. If every operator in the Barnett Shale was hedged at a netback gas price of $8/Mcf, 31% of horizontal wells would break even or make money. At $6/Mcf, only 15% of wells would reach this commercial threshold. I am troubled that public companies and investment analysts make fantastic claims about the rates and reserves for new shale plays without calibrating them to the only play that has significant production history. Almost every assumption used by the industry to support predictions about the Haynesville or Marcellus Shale plays is questionable based on well performance in the Barnett Shale. While the Barnett Shale does not perfectly predict what will happen in other plays, it seems reasonable to temper and calibrate our uncertainty with what is known. There are many lessons we can learn from the Barnett Shale, and they all suggest a cautious approach to developing new shale plays.
IHS provided information that was used in this evaluation. Their support of this column is greatly appreciated.
|
||||||||||||||||||||||||||||||||||||||
- Prices and governmental policies combine to stymie Canadian upstream growth (February 2024)
- U.S. producing gas wells increase despite low prices (February 2024)
- U.S. drilling: More of the same expected (February 2024)
- U.S. oil and natural gas production hits record highs (February 2024)
- Quantum computing and subsurface prediction (January 2024)
- U.S. upstream muddles along, with an eye toward 2024 (September 2023)
- Applying ultra-deep LWD resistivity technology successfully in a SAGD operation (May 2019)
- Adoption of wireless intelligent completions advances (May 2019)
- Majors double down as takeaway crunch eases (April 2019)
- What’s new in well logging and formation evaluation (April 2019)
- Qualification of a 20,000-psi subsea BOP: A collaborative approach (February 2019)
- ConocoPhillips’ Greg Leveille sees rapid trajectory of technical advancement continuing (February 2019)


