The method makes no assumptions regarding ultimate recoverable oil. Neither are assumptions made about future discoveries, and reserves growth plays no part.
H. C. Juvkam-Wold and A. J. Dessler, Texas A&M University, College Station, Texas
When are we likely to run short of oil? How much oil do we have left? When will we reach “peak oil?” These are questions that keep coming up in the news and elsewhere, especially since oil prices briefly climbed well above the $100/bbl mark.
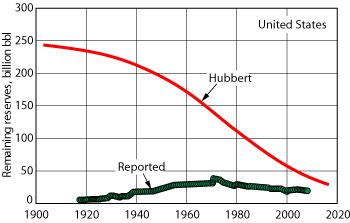
Oil reserves usually refer to oil that we know, with a high degree of certainty, can be produced at today’s prices with today’s technology. This definition can lead to misleading expectations about future production. For example, US conventional crude oil reserves have always been reported to be about 40 billion bbl or less, and are currently listed at just above 20 billion. However, we have already produced in excess of 200 billion, so how much confidence can we place in the current 20 billion estimate?
In this paper we present a method of oil reserves estimation based purely on historical production data. It follows, in part, a method pioneered by the famous M. King Hubbert.1,2 No assumptions are made concerning price, geology, politics, technology, ultimate recoverable oil or future reserves growth, and yet we believe that our estimates are realistic. These factors are either contained in the Hubbert equation, or they are not very important. The resulting prediction for remaining reserves is about 40 billion bbl for the US and 1,400 billion bbl for the world.
INTRODUCTION
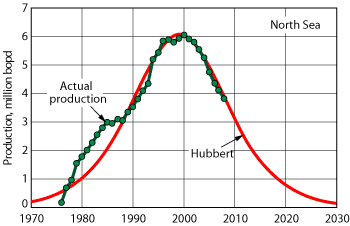
The history of oil production versus time for given areas often tends to follow a bell-shaped curve. An exceptionally good example is North Sea oil production, shown in Fig. 1. This plot, and all of the ones following, are reporting on the production of crude oil and lease condensate only. It is important to remember that production of natural gas liquids, heavy oil, tar sands, alcohols and other non-conventional hydrocarbon liquids is not included.
The red curve in Fig. 1 is a Logistic Distribution. The equation for this curve is the derivative of the Logistic Curve used by M. King Hubbert.
 |
|
Fig. 1. Logistic Distribution of North Sea oil production.
|
|
The derivative curve is P = dQ/dt, where

and where P is crude oil production (billion bbl/yr); Pm is the production at peak (billion bbl/yr); t is the time or reference date, in years; tm is the year of peak production; b is the factor describing the slope (billion bbl/yr); and Q is the cumulative production in billion bbl at time t.
This curve can be made to fit the production data remarkably well. In the early part of the plot, production is increasing exponentially, then tapers off and reaches a maximum when half the crude oil has been produced. From this plot it is not immediately obvious what future production will be, especially if there is a fair amount of data scatter. The production data in Fig. 1 can also be fitted to a similar-looking Gaussian (normal) distribution.
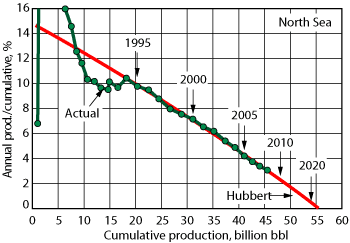
We can re-plot the North Sea data in a different way. Figure 2 is a plot of the ratio of annual production divided by cumulative production on the y-axis versus cumulative production on the x-axis. Cumulative production is the total amount of oil that has been recovered up to a given time. The plot essentially shows the annual rate of growth of cumulative production. At some point in the production life, the data in this type of plot tend to settle down into a linear plot (since 1994 in this case). When this plot (extrapolated) reaches the x-axis, the production rate has dropped to zero, and we have reached ultimate cumulative production. According to Fig. 2, the North Sea has produced about 46 billion bbl, and has about 10 billion bbl to go! Figure 1 suggests that by 2020 the production rate is projected to be less than one-fourth of what it is now.
 |
|
Fig. 2. Growth rate of cumulative production.
|
|
Once we have established the slope of the line in Fig. 2, we can use this plot to estimate both future production rates and remaining reserves.
If we are lucky enough to find more oil reserves in the North Sea, then the plot may change, but the big reserves are usually easier to find, so we tend to find them first. Note that we have also included the Logistic distribution in Fig. 2. The Logistic projection (red) is linear over essentially the entire production history and, since 1994, the actual production data closely follow this line. The Hubbert line is, basically, the integral of the equation shown above. At the present time, while the North Sea production rate has been declining since 2000, cumulative production is increasing by about 3% per year.
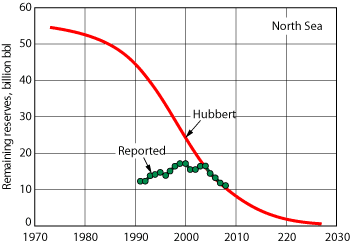
Figure 3 shows a plot of remaining reserves versus time for the North Sea. The values calculated from the Hubbert equation are shown in red, and the published reserves3 are shown in green. Eventually, the two plots will have to come together, after 2004 in this case. It would appear that the Hubbert reserves have been, over time, by far the most realistic, even if they do not follow generally accepted reserves calculation procedures. Note the “reserves growth” in the reported reserves prior to 2000.
 |
|
Fig. 3. North Sea crude oil reserves.
|
|
Not all regions give plots as consistent as the ones shown above, but the technique discussed here is still powerful and often realistic. In the next section we show more examples using the same procedure.
MORE EXAMPLES
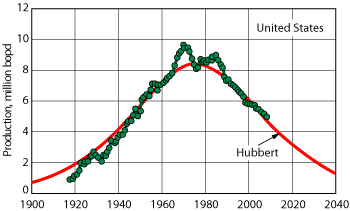
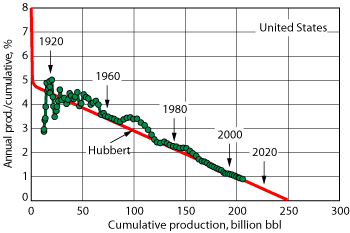
Figures 4 through 6 are similar plots for the United States. In spite of some scatter in the data, Fig. 4 shows that production peaked around 1970, as predicted by Hubbert,1 and is now about one-half of the peak production. In Fig. 5 we again have the linear trend, indicating that the US has produced more than 200 billion bbl and has roughly another 40 billion to go (from 210 to 250 billion bbl).
 |
|
Fig. 4. US crude oil production.
|
|
 |
|
Fig. 5. Growth rate of cumulative production.
|
|
 |
|
Fig. 6. US crude oil reserves.
|
|
In Fig. 5 the production trend has followed the straight line for the last 50 years! This is true in spite of variations in the price of oil by a factor of 30, rig counts varying between 500 and 4,000, new exploration techniques, new discovery areas such as Alaska and the Gulf of Mexico, and horizontal drilling techniques! Each year the US is now increasing the cumulative production by about 1%. Also, it would appear that we have already produced more than 80% of the conventional oil that the US is likely to produce.
If we re-plot Fig. 5 using data only after 1950, and plot an Excel Trendline for these data, we get an amazing correlation of R2 = 0.9850. As suggested above, early in the production life, the data points have not settled into the linear trend.
Figure 6 shows US oil reserves versus time. Again, there is a large difference between the reserves calculated from the Hubbert equation and the reported values.3 Note that the reported reserves do not vary much with time. They peak at around 40 billion bbl, in spite of the fact that the US has already produced over 200 billion bbl. Again the two curves are approaching each other, as is the case for the North Sea.
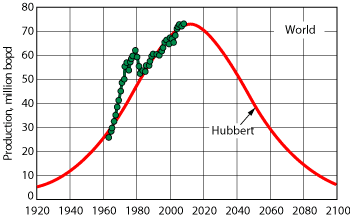
Peak production (peak oil) has received much press, and conclusions vary widely. Some “experts” say that we have already passed the peak. Others say that we are decades away from the peak. It is generally accepted that much of the remaining reserves are in OPEC countries where political factors often influence production rates and reserve estimates. Also, new projects are gradually coming onstream around the world, so the jury is not yet in on this one.
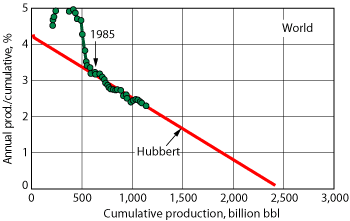
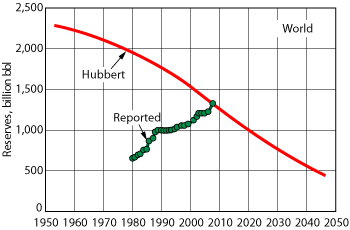
Figure 7 indicates that we are not clearly past peak oil for the world, so we should not place too much confidence in the extrapolated plot. However, Fig. 8 suggests that, if the current trend continues, the intersection with the cumulative production axis occurs at about 2.5 trillion bbl, suggesting that we may have another 1.4 trillion bbl of conventional crude to go. This estimate is speculative, but has some merit because the current linear trend started around 1985. However, to continue this speculation, Fig. 9 shows reported3 and calculated world reserves of conventional crude oil. The dramatic growth in reported reserves is clear. Perhaps we are less likely to see much reserves growth in the future because the curves now intersect.
 |
|
Fig. 7. World crude oil production.
|
|
 |
|
Fig. 8. Growth rate of world cumulative production.
|
|
 |
|
Fig. 9. World crude oil reserves.
|
|
Reported reserves mean the reserves calculated under established rules and reported in Oil & Gas Journal, World Oil, the BP Statistical Review and other places. These “reserves” have often grown or remained relatively constant over the years (as in the case of the US), and are not indicative of the remaining oil to be produced. By calculated reserves we mean the ultimate cumulative production minus the oil produced to date, using the correlations from the Hubbert equation and the plots above. Here the reserves are reduced by one barrel every time a barrel is produced. This is not an established reserves calculation procedure, but perhaps it should be.
SUMMARY
This brief article represents our thinking and is based on many years of experience, numerous books, magazines and technical papers, countless discussions with a number of people and detailed analysis on a worldwide basis. We have presented a robust theory for determining oil reserves based purely on historical oil production data, as reported in various journals and on various websites.
The technique of presentation was pioneered by M. King Hubbert, and was later explained and expanded by Kenneth S. Deffeyes, Professor Emeritus at Princeton University. His book Beyond Oil: The View from Hubbert’s Peak4 explains the approach used in Figs. 1 and 2. The procedure works especially well when applied to a fairly large region where a substantial amount of drilling and production have been done, and where the production has reached its peak. The process is not applicable to single wells, small areas or where production is just beginning.
Much has been written about the “Hubbert linearization method” (Fig. 2) at various websites,5,6 and some authors suggest that the method is not valid, but it is difficult to argue against the fit to actual production data in the cases presented here.
Contrary to what is often claimed by critics of Hubbert’s methods, in our approach we have made no assumptions regarding ultimate recoverable oil. No assumptions about future discoveries are made, and the concept of reserves growth plays no part. We regard the fit of actual production data to the theory, as shown in this paper, to be a demonstration of the validity of the Hubbert equation for estimating ultimate recoverable reserves.
We estimate that the conventional oil remaining to be produced in the US is at least 40 billion barrels. For the world the number is about 1.4 trillion barrels. 
|
THE AUTHORS
|
 |
H. C. Juvkam-Wold is a professor in the Harold Vance Department of Petroleum Engineering at Texas A&M University in College Station, Texas, where he occupies the John Edgar Holt endowed chair. He has more than 20 years of oil industry experience and has earned SB, SM and ScD degrees in mechanical engineering from the Massachusetts Institute of Technology. He is a registered professional engineer in the state of Texas.
|
 |
A. J. Dessler is an adjunct professor of atmospheric sciences at Texas A&M University. He spent 26 years at Rice University as professor of space physics and astronomy, including 15 years as Department Chair. He has worked a total of 38 years in space physics in industry, government and academia. He earned his BS degree from the California Institute of Technology and his PhD from Duke University, both in physics.
|
|
|
| |
|


