High production and low risk were achieved by encouraging sand production.
Patrick M. Collins, Petroleum Geomechanics Inc., Calgary; Maurice B. Dusseault, University of Waterloo, Ontario; Darcy Dorscher* and Ed Kueber†, Nations Energy Company Ltd
In 2000, Nations Energy Company initiated Cold Heavy Oil Production with Sand (CHOPS) in new areas on the flanks of the developed central part of Karazhanbas Field (also called Karazhanbasmunai-or “KBM”), a giant, shallow heavy oil field in western Kazakhstan. Progressive Cavity Pumps (PCPs) are used to lift the oil, and sand is allowed to enter perforated zones. Production of 38,000 bpd was reached by January 2004, an increase of over 25,000 bpd within four years. Sand flux is far lower than in Canadian cases because of the field’s lower oil viscosities; water flux is higher due to higher water mobility and active flank water.
CHOPS is an economic success at KBM, allowing recovery factors of 8-15% from zones as thin as 10-33 ft, for which thermal technologies are not economically viable. In the thickest zones, there are plans to follow CHOPS with steam stimulation to take advantage of the enhanced permeability and compressibility generated by the CHOPS process.
INTRODUCTION
CHOPS is a primary production technology recently developed in Canada, involving intentional formation sand production to increase heavy oil rates at low cost and without thermal stimulation. About 10,000 wells in Canada use CHOPS, yielding a total of about 500,000 bpd, about 15% of the country’s total. Issues relating to sand in the fluids, pumping, separation, transportation and disposal have been solved, and operating costs are less than half of those for cyclic steam stimulation or steam-assisted gravity drainage.
The giant Karazhanbas oil field, on the Buzachi Peninsula in the northern Caspian Sea, possesses many characteristics conducive to successful CHOPS. The shallow targets are high-porosity unconsolidated sandstones containing heavy oil with methane in solution. Active bottom water is absent, the production zones are homogeneous and flat-lying, oil saturations are high, and mobile water streaks appear to be absent.
History. KBM was discovered in 1974 and became the largest shallow viscous oil field exploited in the USSR. Various techniques were used to reduce the viscosity to 1-10 cP from 350-450 cP to make production economic. Nations Energy took over KBM operations in 1997 and initiated several aggressive development plans. Up to Jan. 1, 2003, more than 1,700 wells had been drilled in the field, including 1,138 production wells and 441 injection wells. Most are located in the developed areas, in the field’s central and western portions.
By this time, KBM had produced a total of 122 million bbl (18.3 million metric tons, mt) of oil, about 7.7% of the Original Oil In Place (OOIP), and 56.3 million mt of total fluids.
Geology. KBM contains heavy oil (~400 cP) in seven zones up to 130 ft thick in unconsolidated sands with porosities from 28% to 32%, permeabilities of about 0.5 D, and an arkosic lithology with angular grains. There is no free gas cap.
The KBM structure is a gentle, anticlinal fold situated in the structurally high portion of the Buzachi uplift, bordered by the Precaspian Basin to the north, the southern Caspian Basin to the south, and the North Ustiuit Basin to the east.
A complex fault system exists, with a large major fault zone striking 105°-285° separating the top of the structure into a southern elevated block and a northern down-thrown block-a subtle horst-graben system. This fault zone is a series of imbricated faults striking ENE-WSW; it seems to have controlled regional fluid transportation and oil accumulation in structural highs. The fault system dips to the north, with the largest throw-490 ft-in the west, fading to 130 ft in the east.
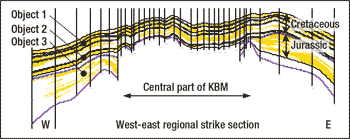
Structural data are vital to planning CHOPS and extending it into flank areas because of active water zones on the flanks. KBM has many sands; some are oil-bearing reservoirs of potential economic interest. These potential reservoirs are grouped into three “objects” in order of increasing depth and age, Fig. 1:
- Object 1 consists of Horizons A, B and V.
- Object 2 consists of Horizons G, D.
- Object 3 consists of Horizons J1 and J2 (Jurassic).
 |
|
Fig. 1. West-east cross-section of the central KBM.
|
|
The thick and permeable A, G and J1 horizons represent ~95% of OOIP, and are economic with current technology.
Before 2000, development focused on the central portion of the field. Flank resource delineation in complicated regions started in June 2000, and large-scale drilling and development began after 2001. The flanks are the monotonously dipping limbs of the anticlinal structure; the new development areas (Objects 1-3) are in these periclinal zones.
NEW DEVELOPMENT PLAN
The new development plan targeted the lightly developed eastern flank. Initially, 29 new wells were drilled and placed on cold production before implementing thermal stimulation. Goals were to provide more detailed and accurate information to guide development, to test new production equipment, and to determine if KBM zones would respond well to CHOPS. Well performance was encouraging, so by June 2003, 23 new wells drilled in the eastern flank were also producing with CHOPS.
The average oil rates in Objects 1, 2 and 3 are 277 bpd, 136 bpd and 147 bpd, respectively. Average initial oil rates in all Objects were in excess of 15 bpd per ft of net pay. The average watercut of newly drilled wells is about 20% (ranging 10.7-32.6%). For comparison, watercuts in steam stimulation usually exceed 80%.
By June 2003, 7.76 million bbl oil had been produced in the new areas. Recovery factors are 0.7% and 2.5% in Objects 1 and 2, 4.2% in Object 3 East and 1.6% in Object 3 West.
KBM RESERVOIR FLUIDS
At 18-20°API, KBM is at the lighter end of oil gravities for CHOPS. Solution gas produced from the field is 93-97% methane, 0-3% N2, and the remainder C2+. Traces of carbon dioxide (< 0.3%) are present.
The bubble point pressure in the KBM wells is below the reservoir pressure at the time of drilling. Originally, KBM was overpressured, with CH4 solubility below saturated conditions, and no free gas. This is good news for CHOPS implementation, as the foamy oil drive mechanism will be at its maximum potential.
Gas-Oil Ratios (GORs) from 63 wells show lower values as development progressed because of degassing and because high-temperature steam effects drove gas from solution. The reservoirs appear to have bubble-point pressures below the virgin reservoir pore pressure, Table 1.
| TABLE 1. KBM gas-oil ratios and solubility |
 |
|
In CHOPS wells in Canada, GOR tends to climb only very slowly. This means that a continuous gas phase is not being developed because of high viscosity and associated low gas diffusivity. It is likely that KBM will see GOR values rising with time in CHOPS wells, but more slowly than in conventional exploitation. In the past 1.5 years, large increases in GOR have been observed in some wells that have since been shut in.
Oil viscosity is also higher in the developed areas, probably because of degassing, Table 2. In situ viscosity of heavy oil is extremely temperature sensitive. This factor, plus the gas in solution, leads to differences in viscosities between formations.
| TABLE 2. KBM dead oil viscosities |
 |
|
HOW CHOPS WORKS
Heavy oil production rates in Canada are as much as 20 times larger when sand production is encouraged. CHOPS is based on the following principles:
- Formation sand is deliberately produced with the fluids.
- Well completions encourage sand influx.
- No sand control is used.
- PCPs are preferred to cope with continuous sand influx.
- Production rates drop dramatically if sand production stops.
- Aggressive well workovers encourage renewed sand influx.
There are several mechanisms responsible for the production rate enhancement observed in CHOPS wells:1,2
Remolded zone. Sand withdrawal through liquefaction and transport to the well creates voidage within the horizon, most likely a channeled and remolded zone filled with a slurry of sand, water, oil and gas. The zone increases permeability, and the well behaves as if it has an increasing radius. Production enhancement from this effect alone should approach a factor of 4 to 5, but later in the life of the well, after large quantities of sand (1,000-15,000 bbl/well) have been produced.
Foamy oil drive. CHOPS uses foamy oil drive from solution gas with intentional sand production.3 Wells are subjected to aggressive drawdown, and gas exsolves as bubbles in the porous matrix. However, a continuous gas phase is not formed; the gas remains as bubbles that expand in response to pressure decline during flow. Hence, the bubbles act as an “internal drive,” driving the slurry to the well at a velocity greater than predicted by conventional liquid flow theories.
In the more viscous oils, GORs remain constant, and virgin pressures may be encountered during infill drilling only a few hundred meters from existing producing wells. With production, gas bubbles continue to expand and exsolve, providing a pressure support buffer that conserves gas pressures further within the reservoir. This is important for CHOPS because delayed gas depletion means that as long as the process continues to propagate away from the well, drive energy from the solution gas can be accessed.
Foamy oil develops in a zone that propagates outward from the well, following the growth of the disturbed and remolded zone. This extends the zone of highest pressure gradient far from the well, where it destabilizes more sand. Operating below the bubble point means a dramatic increase in production rate and recovery.
Elimination of skin effects. Heavy oil reservoirs can have high skin effects due to plugging of pore throats with precipitated asphaltenes and mobilized fine-grained particles and clays. CHOPS continually shears and disturbs the sand grains, which prevents pore throat plugging. As the disturbed zone of hyper-porosity and -permeability extends away from the wellbore, the wellbore skin becomes increasingly negative.
MODELING CHOPS
Many CHOPS processes cannot be fully modeled by conventional simulators. These processes include:
- Liquefaction of the matrix with large porosity changes
- Stress-strain yield coupled with fluid flow
- Transient compositional conditions for foamy oil drive
- In situ slurry flow
- Continuously changing boundary conditions
- Massive changes in physical parameters because of dilation and liquefaction
- Stress redistribution4,5
- Sampling and testing results of uncertain reliability.
Many history matches of the behavior of laboratory sand packs and field data have been carried out, but with a number of uncontrolled or ill-constrained parameter modifications. It is uncertain whether these lab processes have a useful relationship with in situ mechanisms.
Modeling by analogy. Although physical simulation of CHOPS is available,6 the approach used to predict CHOPS well behavior in KBM was empirical, using analogous well and field behavior.
This analogical approach requires quantification of the ranges of the subject reservoir’s pertinent characteristics: geology, fluids and fluid flow parameters. Next, databases must be searched for existing CHOPS fields with comparable characteristics. If many analogs exist, a subset of those with documented well histories is selected. The histories should include individual well production rates (oil, water and preferably sand and gas) and workovers. For analogs with too many wells to reasonably analyze in an appropriate time frame, a subset cluster of wells is selected over a specific area (e.g., 2-4 sq km). Ideally, the resultant short list of analogs would have reservoir characteristics that bracket those of the subject reservoir.
Based on comparisons with the analogs, one can estimate the “typical” production of oil, water, gas and sand for the new case. This approach to modeling and prediction is extremely robust because it is based on actual historical data, and makes few assumptions. However, it must be used with caution and recalibrated as data are collected from a new project.
CHOPS AT KBM
CHOPS began at KBM in mid-2000. CHOPS wells are completed in single zones within the Cretaceous and Jurassic horizons and in an area not exploited by other techniques.
Oil rates ramp up to 200-400 bpd, which is high compared with typical Canadian CHOPS well rates of 100-130 bpd. This is likely due to the lower viscosity of KBM heavy oil.
Water incursion has not adversely affected oil production. This is encouraging, since there are large sources of edge water, both from steamflood in the central area and from water disposal necessarily within 1,640 ft of surface. This continued disposal of water into the perimeter will result in continued water breakthrough to the CHOPS wells. A better approach to water use and disposal is needed.
Maturing CHOPS wells have already produced an average of over 250,000 bbl of oil each from the J1 zone, without steam injection and at commercially viable rates. Ultimate CHOPS output from these wells should be 50-100% higher.
Net pay was expected to correlate with the oil rate. However, only a weak relationship was seen. Parameters such as permeability and the progressive enhancement of well productivity due to the CHOPS process resulted in considerable deviation from the anticipated straight-line trend.
Cumulative sand production correlated fairly well with cumulative oil production. This is particularly true at low levels of cumulative oil production, which may reflect the fact that there is lower variability of cumulative sand production for the wells’ early life. Later, when CHOPS is mature, continued oil production takes place with lower sand rates, and these may vary considerably among wells.
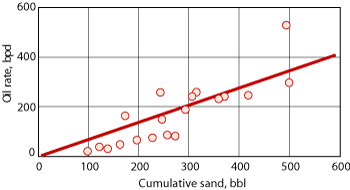
However, Fig. 2 shows that a good relationship exists between the oil rate and cumulative sand production.7 This was the strongest relationship found in this analysis, and demonstrates that CHOPS is being successfully applied at KBM. The implication of this relationship is significant: For optimal well performance, sand production must be encouraged.
 |
|
Fig. 2. Oil rate vs. cumulative sand production at KBM.
|
|
If cumulative sand production measures the health of a CHOPS well, then the sand cut is its pulse. Without continual sand production, the CHOPS process will falter and possibly stagnate. Sand production must be measured on a well-by-well basis so remedial workovers can be done to reinitiate sand production when required.
Since high sand cuts occur early, when CHOPS has had little time to enhance well performance, this would result in a poor or negative correlation with oil rates. Well productivity data showed a high scatter of data points, with almost no correlation to the sand cut.
Watercut was expected to have two opposite effects: Water influx would interfere with the oil production, suggesting a negative correlation, but would occur later in the life of the well, when cumulative sand production and oil rates are higher, suggesting a positive correlation.
The data showed no strong correlation between the oil rate and the water rate. It was reassuring that high oil rates were maintained at high watercuts, since it means that the onset of significant water production does not mean that the well will have to be shut in. The fact that KBM oil’s viscosity is low means that the oil/water mobility ratio is low, and this is advantageous when water production also occurs. It suggests that waterflooding would be advantageous, as was later planned for sands thinner than 23 ft.
The best producer of the CHOPS project, Well 4834, has produced about 500,000 bbl, twice the average for the mature CHOPS wells. It is adjacent to the central area of the KBM Field, where extensive steamflooding has occurred. Downdip, Wells 4529 and 4670 have typical oil production, but their water production is even higher.
CANADIAN ANALOGS
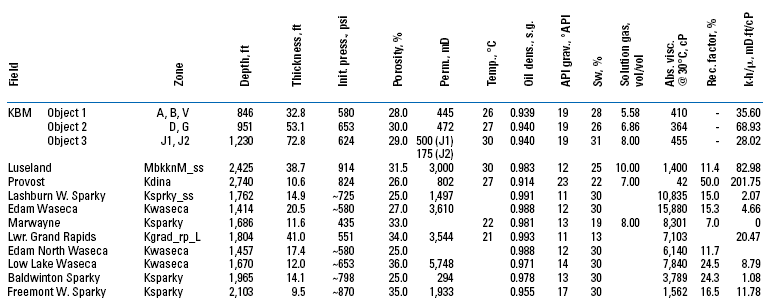
To assess the suitability of CHOPS to KBM, Canadian data were examined to select a set of analogs, Table 3.
TABLE 3. Comparison of KBM with Canadian CHOPS fields (2003 data)
Click table to enlarge. |
 |
|
Ten Canadian CHOPS analog fields were chosen to bracket the range of KBM viscosities. A number of lessons were learned from these analogs:
- Where horizontal wells coexisted in the same formation, CHOPS was more economical and had higher recovery factors.
- Not all wells are successful: 10-30% of the CHOPS wells may be uneconomical.
- There is high uncertainty in the predictability of well rates, well cumulative production, and field behavior.
- Wells show production increases for a period lasting 1-4 years after CHOPS initiation.
- Sand cuts start at 30-40%, declining to 0.5-1.5% after 4-5 months.
- After water breakthrough (volumetric water-oil production ratio > 3), aggressive production can result in higher recovery factors due to viscous drag if sand influx can also be sustained.
- The final phase of CHOPS well life is usually characterized by rapidly increasing watercuts and drops in oil rates.
- An average CHOPS well can be expected to produce from 63,000 bbl to 190,000 bbl of oil (and exceptionally to 630,000 bbl) in a life span of 5-10 years.
- Recovery rates are higher with lighter, low-viscosity oils.
- The GOR should remain stable, since the gas is co-produced with the associated oil.
- Higher GORs for a mature CHOPS field indicate a continuous gas phase and the end of foamy oil drive.
- Sufficient solution gas must exist for successful CHOPS implementation. This should be remembered in converting old production areas to CHOPS, when shutting in high-GOR wells, and in preserving reservoir pressures.
- Ultimate recovery factors range from 14% to over 20%, and in the low-viscosity Provost Field analog, almost 50%.
- Zones as thin as 8 ft have been economically produced.
- Aggressive completions stimulate a stronger development of the foamy oil drive mechanism and a greater sand flux.
- The well’s rates and lifting capacity must be continually reassessed to ensure optimal water, sand and oil production.
KBM properties are generally better than Canadian oilfield properties, with the exception of lower permeability. Once a well has been drilled and paid for, it may be feasible at KBM to move uphole and exploit zones as thin as 8-11 ft.
Recovery factors in KBM were expected to be 25-35%, before EOR. Field performance to date has been lower, with recoveries varying from 8% to 15%. The onset of significantly higher GORs in some wells reduced some well pressures to 145 psi, at which point the wells were shut in pending EOR. In contrast, the recovery factor in the central (old) area of the field where CHOPS was not applied was 7.7%.
PREDICTIVE MODEL
The complex physics associated with CHOPS renders conventional reservoir simulators useless. At present, the best method of predicting CHOPS performance is empirical.
Vogel’s equation. Optimal CHOPS production requires an appropriate bottomhole pressure to maximize oil flowrates. Vogel found that a single dimensionless Inflow Performance Relationship (IPR) was valid for several hypothetical solution-gas drive reservoirs and for a wide range of data. Vogel’s equation is a nonlinear extension to the linear Productivity Index (PI) equation where the reservoir pressure is below the bubble-point pressure, Pbp.
Vogel’s equation was found to apply to any reservoir in which gas saturation increases as pressure decreases. It also applies to wells with a watercut, since the increasing gas saturation will concomitantly reduce the permeability to water. This approach has been successful in wells with watercuts up to 97%.
Knowing the reservoir pressure and the bubble point, Vogel’s equation uses a one-point fitting relationship of a single data point consisting of the oil flowrate and bottomhole flowing pressure (qo(t), Pwf(t)) to extrapolate to oil production rates at different flowing pressures.
Applying Vogel’s equation to KBM. The major assumption made in Vogel’s equation is that variations in the Productivity Index (PI) are attributable to hydraulic impedance caused by the creation of free gas in the pore space, all other factors being equal. As such, the equation is useful for determining the change in production with a change in downhole flowing pressure, which is also related to the rotational speed of the PCP.
However, for KBM, this methodology is only valid for a brief period after the determination of each individual Vogel curve, each of which is uniquely dependent upon the pwf(t) and qo(t) recorded at the time of the test. This is because transient factors other than gas exsolution strongly affect the CHOPS well’s inflow performance, such that after a relatively short time span they dominate the flow behavior. This was evident in the poor fit of field test data to a large number of Vogel curves, one of which was generated for each well. Almost no data points fell along the Vogel curves, even when the watercut was negligible.
Vogel’s equation also assumes a zero or constant skin factor over time. In contrast, CHOPS continuously modifies the reservoir, increasing the PI and resulting in large deviations from Vogel’s equation, as these analyses demonstrated.
In fact, all CHOPS wells in KBM show large increases in PI over time. This corresponds to an increasingly negative skin factor, and is comparable to the effect of a highly successful well stimulation or a radically different completion design. CHOPS clearly increases the well’s productivity over time, either through a process of wormhole growth into the formation, or through the growth of a high-permeability, high-mobility annulus around the wellbore.
Clearly, the Vogel equation can be used as a conservative guide in choosing an appropriate downhole flowing pressure. However, pwf and qo should be re-measured frequently.
Transient PI. The PI is a better indicator of a CHOPS well’s health than the production rates. This is because the PI is largely independent of other factors affecting production rates, such as pump performance, shut-ins and downhole flowing pressure. Plotting PI with time can be used as a well management and optimization tool so that the effects of changes in operating strategy can be quantified and evaluated. Regardless of all other factors, a steadily increasing PI demonstrates that the beneficial effects of CHOPS continue to extend further into the reservoir. When the PI begins to fall, something is interfering with CHOPS and a workover should be considered.
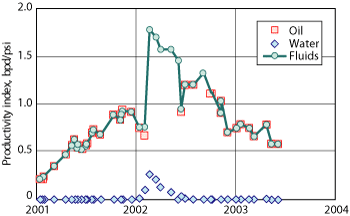
In Fig. 3, the PI is plotted against time for Well 3607. The drop in PI at the end of 2001 corresponds to a drop in the sand production rate at that time. This may have been triggered by a brief episode of water production, or by a partial sand blockage in the near-wellbore area.
 |
|
Fig. 3. Transient productivity index for Well 3607.
|
|
Transient PIs for oil, water and fluids for the 23 KBM CHOPS wells show great variability, reflecting the variability in production rates and sand cuts. In most cases, water does not cause a PI drop, and it is known from KBM data that high oil rates can coexist with high water rates. However, the first occurrence of a significant watercut can reduce PI, as seen in Well 3607, Fig. 3. This may be a capillarity effect.
Effect of exsolving gas phase. In CHOPS, the foamy oil slurry approaching the well has free gas as discrete bubbles that remain mobile, rather than blocking the transmissivity of an array of pore throats. These bubbles act like pistons that displace oil through the pore throats. A continuous gas phase is not generated for most of the life of typical CHOPS wells because the GOR remains nearly constant. Flowrate enhancements from CHOPS overwhelm any hypothetical negative effects from gas.
CHOPS MODEL DESCRIPTION
The CHOPS model is observational and is based upon the transient PI for each well. A linear trendline was drawn through the data points from the onset of the CHOPS process.
The initial ramping up of the CHOPS wells is key to determining the process’s potential, since the reservoir is at virgin geomechanical conditions after drilling, and the large PI increase is a quantifiable measure of the CHOPS enhancement effect. Changes in PI after reaching the peak are less indicative of ideal CHOPS behavior, since many wells have not had any workovers to ensure that sand production continues. This comparison of PIs is an excellent method of evaluating the success of a workover: A strongly positive trendline shows that the CHOPS mechanism has been rekindled.
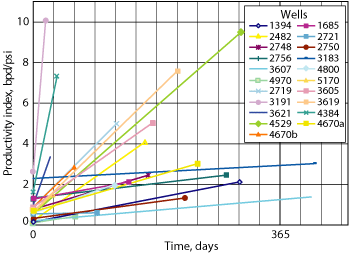
Initial PI behavior. Trendlines consist of a start date and the elapsed time to the peak PI value. The average timespan was 153 days, closely corresponding to the time to peak production. Figure 4 shows the PI trendlines from the 23 KBM CHOPS wells, normalized to the start time.
The start point of the line in Fig. 4 provides the well’s initial PI, and the endpoint provides the nominal peak PI. With these data, a value of the “Folds Of Increase” (FOI) was calculated. This represents the factor by which CHOPS increases a well’s PI. The average FOI was 6.4, which is impressive compared with non-CHOPS recovery processes.
 |
|
Fig. 4. Initial productivity indices.
|
|
Normalized PI behavior. At present, KBM’s lowest recovery factors are in the Jurassic, where the net pay is highest. Generally, the smaller the reservoir thickness, the higher the recovery factor. Notably, when sand production stopped, productivity dropped. This was observed in some wells soon after workovers intended to optimize them by installing larger pumps. After the workover, there was a steep drop in sand production and well productivity. Subsequently, no workovers were done until sand production dropped off naturally.
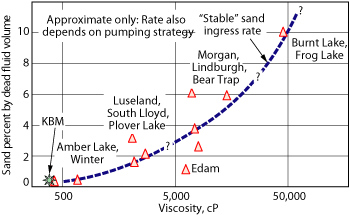
Figure 5 shows roughly the relationship between oil viscosity and sand flux for Canadian analogs reporting a sand flux value. These data are not definitive, because much of the information was reported anecdotally. Nevertheless, it is evident that more sand is associated with higher viscosities, although it is also well-known that the amount of sand is partly a function of more aggressive operational practices of recent years. KBM’s steady sand flux of 0.2-0.3% plots on the Canadian analogs trend.
 |
|
Fig. 5. Approximate sand flux as a function of viscosity at KBM and Canadian cases.
|
|
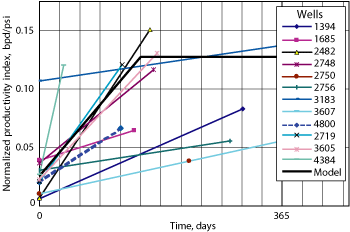
Dividing the PI values by the net pay for each well normalizes the trendlines with respect to the pay thickness. The extreme values, young wells and wells with low PIs but without remedial workovers were excluded, leaving a conservative subset of representative CHOPS PI values, Fig. 6.
 |
|
Fig. 6. Normalized productivity indices.
|
|
The CHOPS model was selected by choosing a bi-linear transient PI profile that approximated the better wells within the mid-range performance. The initial PI of 0.028 bpd/psi/ft increases to 0.131 bpd/psi/ft after 4 months, representing an FOI of 5. In comparison, the well data show average values of 0.035 bpd/psi/ft, rising to 0.198 bpd/psi/ft after 152 days (5 months). The newer wells, with perforation programs designed specifically for CHOPS, are expected to meet or exceed this 4-month PI ramp-up. It is expected that the plateau PI of 0.131 bpd/psi/ft will be assured once more wells have perforation programs appropriate to CHOPS, and providing that workovers are systematically conducted on wells that begin to lose productivity. Many wells will exceed this peak PI, as some already have.
This observational CHOPS model is based on PI, so operating pressures and depletion levels are incorporated directly. By knowing the reservoir and bottomhole flowing pressures and pay thickness, production rates are estimated directly.
KBM OIL RECOVERY PLAN
The performance of KBM’s CHOPS wells varies. When normalized to the pay thickness, this variation is largely due to operational differences between wells. Without a rigorous program of well workovers to stimulate producing wells with stagnating PIs and sand production rates, these wells will be producing sub-optimally.
An examination of the peak oil production rates in a sample of KBM CHOPS wells, divided by the net pay thicknesses, provided the probable peak production rates per foot of pay thickness. In the absence of a larger database, rates were assumed to be uniform for all three Objects in KBM.
A comparison with the analog fields provides some assurance that the estimated rates are reasonable. The Canadian analogs produce at rates between 5 and 96 bpd per ft of net pay, with typical values of 6-8 bpd/ft. The KBM values are expected to be 15 bpd/ft, which is consistent with its lower viscosity of 400 cP.
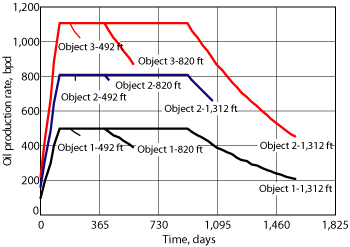
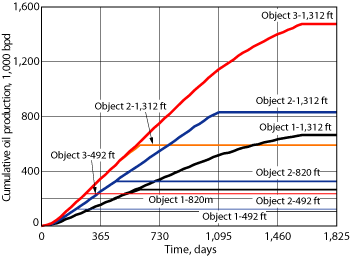
Based on 15 bpd/ft, a production profile was created for the three KBM Objects. For Objects 1, 2 and 3-with thicknesses 33 ft, 53 ft and 72 ft, respectively-three curves were generated for well spacings of 492 ft, 820 ft and 1,312 ft. The rates were ramped up to peak and maintained until 20% of OOIP had been recovered. At this time, a decay of 4% per month was assumed, which would account for reduced reservoir pressure and higher watercuts. Once the recovery factors reached 30%, 23% and 30% for Objects 1, 2 and 3, respectively, it was assumed that the wells would be converted to EOR, Fig. 7. Actual recoveries to date have been lower, about 10%, due to wells being shut in after marked GOR increases.
 |
|
Fig. 7. Predicted single-well oil production rates.
|
|
The rates differ in magnitude because of the different net pay thicknesses for the three Objects. Object 2 ends sooner because the final recovery factor is smaller at 23%, versus 30% for the others. The figure shows that the high rates expected with CHOPS in KBM will deplete the reservoir quickly for the smaller well spacings of 492 ft and 820 ft. Only in the 1,312-ft spacing case do the wells pass into a significant portion of the decline curve.
Figure 8 shows the cumulative recovery from a single well for the nine cases from Fig. 7. The smaller well spacings achieve their target recovery in a year. This is less than the operating life of many current wells; however, the wells now on production may be operating sub-optimally. In addition, water influx will delay oil recovery. Additional oil volumes swept by the produced water will also add to the recoverable oil.
 |
|
Fig. 8. Predicted single-well production rates over time.
|
|
Predicted production patterns. The production well pattern for CHOPS shouldconsider three factors: the orientation of the major horizontal stress, the structural geology and post-CHOPS processes.
The CHOPS process will favor the progress of the disturbed zone of sand, whether it forms a wormhole or an annulus of disaggregated sand, into zones where the sand is most likely to fail. CHOPS will favor growth toward zones with higher reservoir pressures. This effect reduces bypassed oil.
The structural geology is critical when planning well locations. There is compartmentalization along the southern edge of the eastern pericline. The faults have bisected the reservoir horizons at the faults. Differential fault throws have truncated the reservoir horizons at these faults, some of which are transmissive while others are sealing.
For CHOPS, the fault’s position is not that important, as the process itself and the solution gas drive tend to exploit areas of the reservoir at virgin pressures. However, subsequent EOR, such as steamflooding and waterflooding, may not be able to access oil because of poor well locations with respect to sealing faults. When selecting well locations, geology should take precedence over geometric uniformity.
From the previous analysis, the current 492-ft well spacing is small if CHOPS alone is being considered. A 1,312-ft spacing will reduce the oil rates as a function of area; however, more area can be drilled for a given number of wells.
Current spacing in the east-west new-drill areas is 984 ft, with infill drilling down to 492 ft for optimal EOR.
Sand volumes predictions. After the initial production period, sand cuts are stable at about 0.1% by volume. The initial period is relatively brief and initial rates are low, so the higher cuts of up to 7% in this period have little effect on cumulative sand production.
More importantly, sand rates will increase when a routine of workovers on producing wells is established for whenever operations fail. From the behavior of existing CHOPS wells in KBM, an average sand rate of 0.2% should be expected.
Predicted recovery factors. High amounts of produced gas reduce the recovery in a volumetric reservoir. This is because the gas is no longer in the reservoir to expand and displace the oil. Production rates would also be lower, since the expanding gas cushions the pressure drop resulting from production. Preserving the gas in the reservoir also optimizes CHOPS by permitting “foamy oil” flow of discrete gas bubbles within the highly viscous oil. This lowers the effective viscosity of the oil, and accentuates the sand production.
CHOPS should not produce gas with oil above the GOR in the reservoir, which may drop slowly if immobile gas bubbles form in the pore space due to the reservoir pressure drop. Producing CHOPS wells at the current GOR will minimize the net cumulative produced GOR, Rp. Over a CHOPS well’s life, Rp should approximate the average GOR over time.
If we assume that the gas is being co-produced with the oil at the current GOR, then some assumptions about the primary recovery with CHOPS can be made. It was assumed that the produced gas was equal to the initial GOR, and that the conversion to EOR would occur at 145 psi. Using the high value of Rp prevents a gas cap accumulation. The predicted recoveries with CHOPS range from 13% to 20%. If the GOR at EOR conversion is even lower than the assumed values, the recoveries will improve.
One assumption made above is that water is not being co-produced. This is clearly not the case, as some of the most prolific CHOPS wells in KBM are producing oil at substantial rates with high watercuts.
CONCLUSIONS
The KBM case shows that CHOPS can be successfully applied to lower-viscosity oils. Accounting for viscosity differences, KBM wells are behaving as expected, in comparison to Canadian data. Operating far below the bubble point is clearly the best operational practice for CHOPS wells; flow enhancements outweigh any negative aspects associated with relative permeability reductions. Sanding should be encouraged, sustained and reinstated when it ceases, and a good sand management system must be implemented.
Pump optimization should always use recent data, since CHOPS continually alters downhole conditions. It is necessary to develop and maintain excellent geological models, and to reduce uncertainty in core and log parameters.
Studies are needed on the effectiveness of different post-CHOPS EOR technologies. At present, gravity-drainage thermal processes are recommended for thicker zones, and water or polymer flooding for thin zones. 
ACKNOWLEDGEMENT
This article was prepared from WHOC 2008-500 presented at the World Heavy Oil Congress in Edmonton, Alberta, March 10-12, 2008.
LITERATURE CITED
1 Geilikman, M. B. and M. B. Dusseault, “Fluid-rate enhancement from massive sand production in heavy oil reservoirs,” Journal of Petroleum Science and Engineering, 17, February 1997, pp. 5-18.
2 Wong, F. Y. and W. P. Ogrodnick, “Redevelopment of heavy oil assets through technology advances,” paper 211 presented at the 7th UNITAR Conference on Heavy Oil and Tar Sands, Beijing, Oct. 27-30, 1998.
3 Dusseault, M. B., “CHOPS,” Ch. 5 in Warner, H. R., Jr., Ed., SPE Petroleum Engineers Handbook, Vol. 6: Emerging and Peripheral Technologies (EMPT), SPE, 2007.
4 Charlez, P. A., Rock Mechanics Vol. 2: Petroleum Applications, 1st Ed., Editions Technip, Paris, 1997.
5 Rothenburg, L., Bratli, R. K. and M. B. Dusseault, “A poro-elastic solution for transient fluid flow into a well,” unpublished manuscript available from Dusseault on request, 1996.
6 Wang, Y., Chen, C. C. and M. B. Dusseault, “An integrated reservoir model for sand production and foamy oil flow during cold production,” SPE 69714 presented at the SPE International Thermal Operations and Heavy Oil Symposium, Porlamar, Venezuela, March 12-14, 2001.
7 McCaffrey, W. J. and R. D. Bowman, “Recent successes in primary bitumen production,” presented at the Heavy Oil and Oil Sands Technical Symposium, Calgary, March 14, 1991.
.
|
THE AUTHORS
|
|
|
Patrick M. Collins is President of Petroleum Geomechanics Inc. of Calgary, and has engineering degrees from the Universities of Toronto and Alberta. He has over 25 years’ experience in heavy oil and oil sands, and in geomechanics related to drilling and completions. He works as an independent consultant in heavy oil recovery and in geomechanics, and is an expert witness in geomechanics. He can be contacted at collinsp@telus.net.
|
|
| |
Maurice B. Dusseault is a geological engineering professor at the University of Waterloo in Canada. Three years as a roughneck and drilling fluids technician preceded his university education. He has published more than 425 papers. He can be contacted at mauriced@uwaterloo.ca.
|
|
| |
Darcy Dorscher worked at KBM for 6 years, first as Manager of Engineering and Geology and later as Operations General Manager. He has an additional 18 years’ experience in production operations and reservoir, production and facility engineering. He earned his chemical engineering degree from the University of Alberta and is currently in India as the Director of Engineering for Canoro Resources. He can be contacted at ddorscher@canoro.com.
|
|
| |
Ed Kueber worked at KBM for 8 years-the last 5 years as Manager of Engineering and Geology. He has an additional 15 years’ experience in reservoir engineering and production operations. He earned his petroleum engineering degree at the University of Tulsa, Oklahoma. Currently, he is a consulting Petroleum Engineer based in Calgary. He can be reached at ekueber@shaw.ca.
|
|
|


