Seismic from basalt flows in the Deccan Traps shows the difficulty in modeling complex, multi-layered sequences.
Dhananjai Pandey, National Oceanography Centre, UK
Subsurface imaging using conventional seismic reflection techniques is challenging in areas where high-velocity rocks such as basalts are underlain by low-velocity rocks. The seismic image quality worsens in the presence of intercalated sediments within the basaltic rocks. This article presents an example showing possible complications expected in regions characterized by basalt flows. It further attempts to examine the applicability of using locally converted seismic waves to image the basalt layer as well as structures underneath them.
BACKGROUND
Imaging sub-basalt targets is a key problem for the hydrocarbon exploration industry. In large parts of the world, potential oil-bearing Tertiary sediments are considered to be intruded or covered by basaltic sills and lava flows. Some of the vital issues associated with sub-basalt imaging are:
- Complex setup caused by multiple basaltic flows and inter-fingering of sediments within the individual flows
- Strong reflections due to high impedance contrasts at the top and bottom of the basalt flows leads to significant loss of transmitted seismic energy
- Roughness and anisotropic variations associated with basalt.
Thus, the quality of the seismic data recorded in volcanic-covered areas depends upon cumulative impact of the above issues.
In recent years, sub-basalt imaging problems appear to have been overcome partly by acquiring long-offset seismic data, using low-frequency sources and making use of locally converted waves.1,2 Using long-offset data for imaging underneath basalts has been the most favored option. Ziolkowski et al. suggested that, since sound waves travel more easily through thin layers at low frequencies than high frequencies, low-frequency surveys could provide better seismic images in such geological settings.3 Reshef et al. recently presented results describing imaging of sub-basalt targets over land.4 Wang and Singh demonstrated the method for separation of P and S waves from wide-angle seismic data for sub-basalt imaging.5
Despite technical advances in sub-basalt imaging, near-offset data in basaltic areas are yet to be fully used, primarily due to complexity caused by the surface and internal heterogeneity of the basalts. The use of converted waves for near offset data has been proposed as an alternative in homogeneous basalt layers. Through a set of synthetic exercises followed by field examples, a case study is presented, from the Deccan Traps, India, concerning the effect of multiple, thin basaltic lava flows on seismic waveform. With few wave-field modeling exercises, the practical difficulties encountered while working with heterogeneous basalt flows are highlighted. In order to do so, full waveform seismograms, both with and without mode converted waves, are computed to understand the effects of intra-trappean layers. The effects of intercalated sediments on the seismic image are described, and a qualitative comparison is shown between a borehole synthetic seismogram and a field shot gather from this region. Comparison with the field data demonstrates that the effects of multiple thin layering within the basalt can strongly deteriorate the image we seek to interpret and exploit.
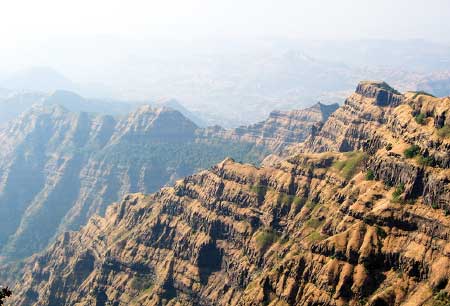
The Deccan volcanic province is one of the largest continental flood basalt provinces on the Earth, covering an estimated area of more than 500,000 km2 in central India, Fig. 1. The formation of this flood basalt province was related to the break-up of the Indian subcontinent from Gondwanaland. The break-up was accompanied by vast outpourings of basaltic lava around the time of the Cretaceous-Tertiary boundary.
 |
|
Fig. 1. (Top) Map of the region showing extent (yellow shaded) of Deccan Traps in Central India. (Bottom) Field image of the Deccan traps. The basalt in this region comprise of several multiple flows instead of single erupted units.
|
|
The thickness of the Deccan Traps varies from few hundreds to thousands of meters. The Deccan Traps consist of several thin flows separated by intra-basalt deposits, instead of a bulk basalt unit, Fig. 1. The Traps are underlain by thick Mesozoic sediments (from 100-4,000 m thick), which can form source rocks. Cretaceous-Tertiary volcanism might have produced requisite thermal conditions and acted as a catalyst in Mesozoic hydrocarbon generation processes in this area. Moreover, sedimentation in marine environments may also have generated favorable conditions for hydrocarbon generation and entrapment for the region.
The stratigraphy of this region is broadly divided into four major units ranging from Precambrian basement through Quaternary/Tertiary sediments.6 Typical sub-basalt imaging problems arise due to existence of Mesozoic sediments beneath the basalt flows.
MODELING VS. REAL DATA
When a P or S wave impinges at an interface, it experiences a redistribution of incident energy in the form of transmitted and reflected P and S wave modes. Mode conversions become efficient at an interface separating two media, where the P wave velocity (VP) in a layer is close to the S wave velocity (VS) of the underlying layer.
Figure 2 illustrates mode converted phases for a layered, homogeneous model. The model is also chosen to represent the broad stratigraphic sequence of the Deccan Trap region.7 For simplicity, only a few ray paths are drawn.
 |
|
Fig. 2. Possible mode conversions in a four-layer basalt model.
|
|
Synthetic seismogram computation. The reflectivity algorithm was used to create synthetic seismograms for velocity-depth models.8 Modeled responses, with single layered and multi-layered basalt structures, were computed (with and without mode conversion in turn) and compared. Receiver spacing of 0.1 km was used with minimum and maximum offset ranging from 0.1 km to 40 km, respectively. A Ricker wavelet with dominant frequency of 10 Hz was used as the source. The relatively low-frequency wavelet was selected to obtain the deeper penetration of the signal. Using this wavelet as the source provides the seismic wavelength for P waves ranging between a minimum of 0.2 km (in layer L1) and a maximum of 0.5 km (in layer L4) in the model. A trapezoidal frequency band (1-2-30-40) was specified for the seismograms. The time sampling interval of 0.008 sec was used, while each trace consists of 4,096 samples.
Thus, the highest frequency that can be stored in this data, or the Nyquist frequency, is 62.5 Hz. Choosing a large value for the number of samples per trace eliminates temporal aliasing and the wrap-around effects. The attenuation factor is an important parameter in the reflectivity algorithm. Based on field observations, the P wave attenuation factors (QP) for basalt layer was chosen to be 50, whereas QP = 100 was chosen for the basement rocks.9,10
To understand the effects of multiple lava-flow sequences on the seismic data, the full waveform response is obtained, allowing all possible mode conversions for a hypothetical velocity-depth profile. Secondly, seismograms with no P-S conversions are computed. The latter response is subtracted from the former to obtain the amount of converted energy through that particular velocity-depth model. This approach demonstrates that a great deal of energy travels as converted mode; however, due to severe complex nature, identification may be a challenging task.
Single vs. multiple basalt flows. Figure 3a shows the four-layered, homogeneous model used to represent the single-layered basalt subsurface. The notations L1, L2, L3 and L4 correspond to four different layers. From the top these represent: Quaternary sediments (VP = 2 km/s), basalt layer (VP = 4.5 km/s), Mesozoic sediments (VP = 3.5 km/s) and basement (VP = 6 km/s), respectively. The S wave velocities for all layers were computed using an empirical relationship. The P wave velocity in the Quaternary sediments is chosen to be almost equal to the S wave velocity in the basalt layer underneath, allowing efficient mode conversions.
The basalt layer in the model consists of a 0.3-km thick, single unit beneath the 0.6-km thick overburden. The basement (L4), which is overlain by 1.8 km-thick Mesozoic sediments (L3), is 2.7 km below the surface. Figure 3b shows the full-waveform synthetics (allowing all mode conversions) for the model in Fig. 3a. Seismograms with no mode conversion were also computed for the model and subtracted from those shown in Fig. 3a. Figure 3c displays the amount of mode-converted energy for the residual wave-field of this model. The gathers are displayed with reduced travel-times using a linear moveout velocity of 4.5 km/s (basalt layer velocity).
 |
|
Fig. 3. (a) The four layer velocity-depth model with basalt layer (L2) as a bulk unit. (b) Full waveform seismogram with all possible mode conversions (P-S and vice-versa). Various arrivals are labelled as mentioned in text. (c) The amount of converted energy for the velocity-depth model shown in Fig. 3a. The residual wave-field is obtained by subtracting the response having no mode conversions allowed from that with all mode conversions (Fig. 3b). This process provides a direct clue about possible mode conversions from a known velocity-depth model.
|
|
Due to a low-velocity layer (L3) underneath the basalt layer (L2) in the model, step backs (travel-time skips due to velocity inversion) in the first arrivals are clearly observed. An artifact (as labeled in Figs. 3 and 4) is due to a very high apparent velocity at near offsets, and can be attributed to the upper limit of the specified phase velocity window, in the reflectivity algorithm.
Based on the analyses of the synthetic seismograms, various primary (P1, P2, P3, P4 and P5) and converted (S1, S2, S3 and S4) phases can be identified and labeled in the composite diagram, Figs. 2 and 3. The labelled arrivals can be described as:
- P1: Reflected P wave from the interface between L1 and L2 (PP)
- P2: Refracted P wave from the layer L2
- P3: Reflected P wave from the interface between L2 and L3
- P4: Reflected P wave from the interface between L3 and L4
- P5: Refracted P wave from the layer L4
- S1: Converted refractions from L2 (PPS)
- S2: Converted reflections from base of L2 (PSSP)
- S3: Converted refractions from top of L2 (PSP)
- S4: Converted reflections from top of L4 (PSPPSP).
The assumption of the single-layered basalt therefore allows one to identify various converted phases simply. However, a more realistic approach would be to observe the additional complexity produced due to the multiple thin flows.
Mode conversion in a multi-layered basalt model. As opposed to the previous case, the single-layered basalt structure is replaced by a model that consists of multiple, thin layers of basalts and sediments. The new model has six alternating basalt and sedimentary sequences, each of which is 50 m thick, Fig. 4a. The modeling parameters for the new model remain unchanged. Thus, the composition of the two models differs in terms of single- and multi-layered structure only. In reality, individual sequences are much thinner than 50 m and computing full-wave-field response using small values could be difficult. Therefore, thick flows are used to demonstrate mode conversion in the multi-layered basalt environment.
 |
|
Fig. 4. (a) Velocity-depth model with multiple basalt flows (L2) instead of bulk unit. (b) Full waveform seismogram with all possible mode conversions. (c) The amount of converted energy for the velocity-depth model shown in Fig. 4a.
|
|
Figure 4b shows the higher degree of complexity in the full wave-field response due to inter-fingering layers. The waveform records large amounts of scattered energy as compared to the single-layered basalt case. Comparing the residual wavefields from the single-layered and multi-layered models highlights the complexity of the multi-layered case, Figs. 3c and 4c.
In the second model, the amount of converted energy is much larger than the first, suggesting a greater degree of mode conversion at each intra-basalt interface. The synthetic gathers demonstrate that in the case of intercalated sediments, the sub-basalt arrivals are masked by the converted phases as well as inter-bed multiples associated with them. The fine-scale structures within the basalt layer introduce different levels of short period ringing events in mode-converted and non-mode-converted wave-fields. The large amount of converted energy obscures the primary arrivals. Converted reflections from the base-basalt interface are eventually suppressed beneath the multiple and noisy events. Converted refractions however, can be identified in both cases (S1 and S3 respectively from L2 and L4). This provides additional constraints for S wave velocity in the model.
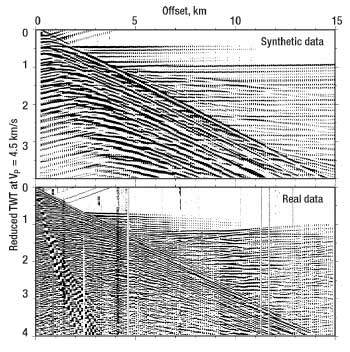
Multi-layered basalts in the field are far more complex than data from hypothetical models previously examined. Synthetic seismograms in similar fashion as those above were obtained using borehole data from wells instead of hypothetical velocity-depth models. Figure 5 shows a direct comparison of the computed seismogram from well data and a field shot gather crossing the borehole. Simplified borehole data are used to represent 10 m-thick intra-basalt units. The synthetic seismogram computations using borehole sonic log data show the difficulty in identifying converted waves on the shot gathers. Scattering from rough interfaces has detrimental effect on imaging sub-basalt targets by creating a distortion to the wave-front. Presence of higher degree of heterogeneities masks the seismic image in such cases, and leaves very limited options of identifying converted modes for sub-basalt imaging.
 |
|
Fig. 5. Synthetic seismogram computed using borehole data from a nearby well. The borehole data were smoothed to represent several thin flows (top). A field shot gather (bottom) showing close similarity with the synthetic seismogram shown on top. The seismic profile passes through the borehole location.
|
|
The results from comparing a synthetically generated seismic model and a shot gather from a wide-angle profile show that:
- Considerable noise is introduced in the shot gather, which makes identification of arrivals on a raw shot gather almost impossible, even at large offsets.
- Some coherent noise exists, which appears to be like reflected arrival, however, it may not be a reflection from a geological interface.
The comparison emphasises that if similar fine-scale structures as shown in the sonic log are present in a region, it would be extremely difficult to identify the mode-converted energy.
CONCLUSION
A number of model-dependent forward modeling studies have been reported elsewhere and have shown that converted waves can be used under optimal conditions. Many such studies have been theoretical by assuming the basalt layer as a single homogeneous layer; however, this study relates the problem closely to field data as observed in the Deccan Traps. Here, it is observed that multiple flows within the basalt layer and the sediments trapped between them can significantly destroy the subsurface image. Therefore, converted waves used for interpretation and exploitation for sub-basalt imaging in a geological setting like Deccan Traps are highly difficult to identify.
Destructive interference from various mode conversions could also be coupled with the multiples themselves and might result in producing an extremely complex wave-field. Despite difficulties, the synthetic seismogram modeling presented in this article provided a good understanding of the nature of intra-basalt structures in Deccan Traps and their effects on field data, and demonstrated that in simpler basalt structures, converted phases can be reasonably identified and used for seismic image enhancement. Development of imaging techniques to deal with complex and realistic situations is desired due to the complex seismic data produced from the relationship between low- and high-velocity strata. 
LITERATURE CITED
1 Purnell, G. W., “Imaging beneath a high-velocity layer using converted waves,” Geophysics, 57, No. 11, 1992, pp. 1444-1452.
2 Eccles, J., White, R. S., Robert, A. W., Christie, P. A. F. and the iSIMM team, “Wide angle converted shear wave analysis of a North Atlantic volcanic rifted continental margin: constraint on sub-basalt lithology,” first break, 25, 2007, pp. 63-70.
3 Ziolkowski, A., Hanssen, P., Gatliff, R., Jakubowicz, H., Dobson, A., Hampson, G., Li, X. Y. and E. Liu, “Use of low frequencies for sub-basalt imaging,” Geophysical Prospecting, 51, No. 3, 2003, pp. 169-182.
4 Reshef, M., Shulman, H. and Z. Ben-Avraham, “A case study of sub-basalt imaging in land region covered with basalt flows,” Geophysical Prospecting, 51, No.3, 2003, pp. 247-260.
5 Wang, Y. B. and S. C. Singh, “Separation of P- and S-wavefields from wide-angle multicomponent OBC data for a basalt model,” Geophysical Prospecting, 51, No. 3. 2003, pp. 233-245.
6 Biswas, S. K., “Rift basins in western margin of India and their hydrocarbon prospects with special reference to Kutch basin,” American Association of Petroleum Geologists Bulletin, 66, No. 10, 1982, pp. 1497-1513.
7 Pandey, D. K., Sinha, M., MacGregor, L. and S. Singh, “A multidisciplinary geophysical study for sub-basalt imaging in the central western India,” Journal of Conference Abstracts, Sub-basalt Imaging Workshop, Cambridge, UK, April 9-11, 2002.
8 Fuchs, K. and G. Muller, “Computation of synthetic seismograms with the reflectivity method and comparison with observations,” Geophysical Journal of Royal Astronomical Society, 23, 1971, pp. 417-433.
9 Christie, P., Gollifer, I. and D. Cowper, “Borehole seismic studies of a volcanic succession from the Lopra-1/1A borehole in the Faroe Islands, NE Atlantic” Geology of Denmark Survey Bulletin, 9, 2006, pp. 23-40.
10 Maresh, J., White, R. S., Hobbs, R. W. and J. R. Smallwood, “Seismic attenuation of Atlantic margin basalts: observations and modeling,” Geophysics, 71, 2006, pp. 211-221.
|
THE AUTHOR
|
|
|
Dhananjai Pandey is a post doctoral researcher at National Oceanographic Centre in the UK. Pandey received his M. Sc. (Tech) in exploration geophysics from Banaras Hindu University, India, and his PhD from the University of Cambridge in 2003. His doctoral work was based on wide-angle seismic data from Deccan Traps of India for sub-basalt imaging. His major research interests are wide-angle seismic data analysis and inversion. His professional experience includes both academic and industrial research, and he was previously a marine geophysicist at National Centre for Antarctic and Ocean Research, Goa, India.
|
|
|


