Fluid indicators vary in sensitivity depending on local conditions. Some are more effective than others, but all can be useful.
Hong Feng, University of Calgary; Brian H. Russell, CGGVeritas, Calgary; and John Bancroft, University of Calgary
Numerous approaches have been published that derive fluid indicators (often called Direct Hydrocarbon Indicators, or DHIs) from AVO (Amplitude Variations with Offset) equations. The main idea behind these methods is to use the linearized Zoeppritz equations to extract petrophysical parameters such as P-impedance, S-impedance, bulk modulus, shear modulus, Lamé’s parameters, and Poisson’s ratio, and infer the fluid content from cross-plots of these parameters. Russell et al.1 used standard poroelasticity theory, as explained by Biot2 and Gassmann,3 to generalize several of these methods that use a parameter dependent on the dry rock Vp/Vs ratio. Also, in this study, we use the Han4 lab measurements to compare the generalized fluid method with other fluid methods.
INTRODUCTION
We found that the general linearized approximation for Zoeppritz’s equation falls into two categories. One category linearly involves Vp, Vs and  , and the other one is nonlinearly related to Vp, Vs and . For the first category, Aki and Richards5 equation emphasized the contribution of variations in the P- and S-wave velocities and density. A reformulation of the Aki-Richards approximation is the basis of much of the empirical AVO work performed today, and the three extracted parameters are called intercept, gradient and curvature. Fatti et al.6 give us the weighted zero-offset P-wave and S-wave reflectivities and density reflectivity. Shuey7 transformed from Vs and ΔVs to Poisson’s ratio , and the other one is nonlinearly related to Vp, Vs and . For the first category, Aki and Richards5 equation emphasized the contribution of variations in the P- and S-wave velocities and density. A reformulation of the Aki-Richards approximation is the basis of much of the empirical AVO work performed today, and the three extracted parameters are called intercept, gradient and curvature. Fatti et al.6 give us the weighted zero-offset P-wave and S-wave reflectivities and density reflectivity. Shuey7 transformed from Vs and ΔVs to Poisson’s ratio  and Δ and Δ . .
Gray et al.8 showed how to estimate the parameters K,  , µ and more directly by a new parameterization of the linearized AVO equation, as did Chen.9 From the esitmated P- and S-wave reflectivities of Fatti et al.6 we can invert for P- and S-Impedance. Goodway et al.10 developed the µ method, in which these impedances were transformed to produce an estimate of , a fluid indicator, and µ, an indicator of the rock matrix. Russell et al.1 generalized the µ method, introducing a constant scale factor dependent on the dry-rock Vp / Vs ratio as a better fluid discriminator. , µ and more directly by a new parameterization of the linearized AVO equation, as did Chen.9 From the esitmated P- and S-wave reflectivities of Fatti et al.6 we can invert for P- and S-Impedance. Goodway et al.10 developed the µ method, in which these impedances were transformed to produce an estimate of , a fluid indicator, and µ, an indicator of the rock matrix. Russell et al.1 generalized the µ method, introducing a constant scale factor dependent on the dry-rock Vp / Vs ratio as a better fluid discriminator.
In this article, we will first review the generalized fluid method and then test this method using a number of measured saturated and dry rocks.
THE GENERALIZED FLUID METHOD
As discussed by Russell et al.1 the seismic velocity of an isotropic material can be estimated using known rock moduli and density. P- and S-wave velocities in isotropic media are estimated as:
where Vp and Vs are the P- and S-wave velocities, K is bulk modulus, µ is shear modulus, is the Lamé parameter, and is the mass density.
Based on Biot-Gassmann theory, we have the following relationship from Krief, et al.:11
where  is the first Lamé parameter for the saturated rock, is the first Lamé parameter for the saturated rock,  is the first Lamé parameter for the dry frame, Ksat is the bulk modulus of the saturated rock, Kdry is the bulk modulus of the dry rock, is the first Lamé parameter for the dry frame, Ksat is the bulk modulus of the saturated rock, Kdry is the bulk modulus of the dry rock,  is the Biot coefficient, and M is the modulus or the pressure needed to force water into the formation without changing the volume. is the Biot coefficient, and M is the modulus or the pressure needed to force water into the formation without changing the volume.
Using the 2M term, we can rewrite the equation for P-wave velocity (Eq. 1) in the saturated case as:
where ƒ is a fluid term equal to 2M, and s is a dry-skeleton term that can be written either as  or or  . .
Using P- and S-wave impedances we can derive the generalized fluid term:
Russell et al.1 suggested that proper selection of C can cancel the dry skeleton term in Eq. 7. If  , Eq. 7 will be: , Eq. 7 will be:
Murphy et al.12 and Hedlin13 have suggested that  is equal to 0.9 to derive Kp, which is equivalent to 2M in Eq. 3. In their formulation, C is equal to 2.233. Goodway et al.10 suggested using as the hydrocarbon indicator, which implies a C value of 2. Hilterman12 assumes that is equal to 1.0, which implies a C value of 2.333. is equal to 0.9 to derive Kp, which is equivalent to 2M in Eq. 3. In their formulation, C is equal to 2.233. Goodway et al.10 suggested using as the hydrocarbon indicator, which implies a C value of 2. Hilterman12 assumes that is equal to 1.0, which implies a C value of 2.333.
Inspired by the Grey et al.8 parameterization of the linearized AVO equation, Russell et al.15 re-expressed the Aki-Rechards equation as:
where
which is equivalent to to the C value in Eq. 8.
Eq. 9 gives us new physical insight into the relationship between linearized AVO and poroelasticity, and is a generalization of the equations of Gray, et al.8 If we use  =2, we obtain the Gray et al. expression for , µ and . If we use=4/3 , we obtain the Gray et al. expression for K, µ and . Russell et al. claim that =2.333, which implies that =2, we obtain the Gray et al. expression for , µ and . If we use=4/3 , we obtain the Gray et al. expression for K, µ and . Russell et al. claim that =2.333, which implies that  , is more appropriate for the reservoir rocks such as consolidated sandstones. , is more appropriate for the reservoir rocks such as consolidated sandstones.
EMPIRICAL STUDY
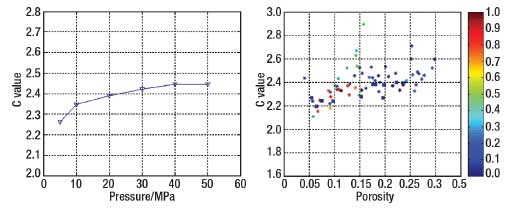
To diagnose the sensitivity of the generalized fluid term with other fluid indicators, we use Han’s4 data set, which covers a wide range of porosities and clay contents at different pressures. These samples are used not only for calculating the fluid terms, but also for investigating the effect of clay content, porosity and pressure on the C value in sandstone.
From Fig. 1, it is easy to observe that C increases with porosity and clay content. Also, the C value increases with pressure. The value of 2.233 is appropriate for clean sands. For lithologies other than clean sandstone, C is about 2.333.
 |
|
Fig. 1. Plot of C value versus pressure. (right) Plot of C value versus porosity color-coded with clay content for 65 shaly sandstone samples at Pe = 5 MPa.
|
|
Table 1 shows the mean value, standard deviation and the fluid-indicator coefficient for each fluid term at the pressure of 5 MPa. Each fluid indicator coefficient diagnose the sensitivity to fluid discrimination and is defined as the difference between dry and wet sandstone divided by the mean value of the standard deviation for wet and dry sandstone. It can be observed that the fluid coefficient for , K, , µ/, , K - µ, Ip2 - cIs2, and ΔF are much higher than other indicators, which means these indicators can easily be used to separate wet sandstones from dry sandstones. Among these indicators, Ip2 - cIs2 is the most sensitive indicator for the fluid content. With these rigidity modulus related attributes, such as Vs, Is, µ and µ, we have almost no chance of distinguishing dry sandstone from wet sandstone.
| TABLE 1. Mean, standard deviation and fluid indicator coefficient for each fluid indicator at 5.0 MPa |
 |
|
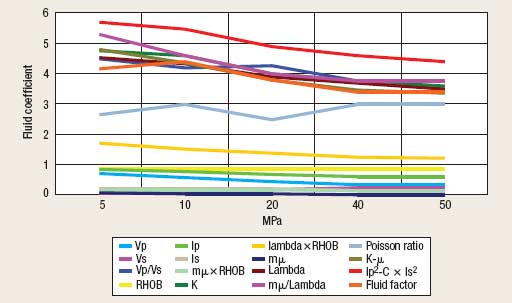
Figure 2 is the plot of the fluid indicator coefficient versus pressure. These lines suggest that, with decreasing pressure, we have a better chance to separate wet sandstone from dry sandstone. At the pressure of 5 MPa, the dry sandstone has significantly higher values of fluid indicator coefficient for indicators , K, , µ/, , K - µ, Ip2 - cIs2, and ΔF than those at 50 MPa. That means the chance to differentiate dry sandstone from wet sandstone is bigger at shallow depths, but is possible at greater depths.
 |
|
Fig. 2. Fluid indicators coefficient versus pressure. Observe that the indicators, Ip2-cIs2, ΔK, K-µ, Δ are more effective than other indicators. are more effective than other indicators.
|
|
CONCLUSIONS
Various combinations of rock properties have been proposed as hydrocarbon indicators, and it can be concluded that a great deal of equivalence exists between fluid indicators Ip2 - cIs2,K - µ , , and /µ. For sandstones, the difference Ip2 - cIs2 might be most sensitive in absolute terms. However, most of these indicators give similar results in magnitude and each can give insight into the meaning of the other. The best indicator needs to be calibrated and tested for local situations. 
LITERATURE CITED
1 Russell, B. H., Hedlin, K., Hilterman, F. J. and L. R. Lines, “Fluid-property discrimination with AVO: A Biot-Gassmann perspective,” Geophysics, Vol. 68, 2003, pp. 29-39.
2 Biot, M. A., “General theory of three-dimensional consolidation,” J. Appl. Physics, Vol. 12, 1941, pp. 155-164.
3 Gassmann, F., “Uber die Elastizitat poroser Medien,“ Vierteljahrsschrift der Naturforschenden Gesellschaft in Zurich, Vol. 96, 1951, pp. 1-23.
4 Han, D. H. and A. Nur, “Effects of porosity and clay content on wave velocity of sandstones,” Geophysics, Vol. 51, pp. 2093-2107, 1986; Geophysics Reprint 10, 1988.
5 Aki, K. and P. G. Richards, “Quantitative seismology: Theory and methods,” W. H. Freeman and Co., 1980.
6 Fatti, J. L., Vail, P. J., Smith, G. C., Strauss, P. J. and P. R. Levitt, “Detection of gas in sandstone reservoirs using AVO analysis: A 3-D seismic case history using the geostack technique,” Geophysics, Vol. 59, 1994, pp 1362-1376.
7 Shuey, R. T., “A simplification of the Zoeppritz equations,” Geophysics, Vol. 50, 1985, pp. 609-614.
8 Gray, D., Goodway, W. and T. Chen, T., “Bridging the gap: Using AVO to detect changes in fundamental elastic constants,” SEG Expanded Abstracts, 1999, pp. 852-855.
9 Chen, X. C., “Essentials of Geomodulus Method,” SEG Expanded Abstracts, 1999.
10 Goodway, W., Chen, T. and J. Downton, “Improved AVO fluid detection and lithology discrimination using Lamé petrophysical Parameters; Lambda-Rho, Mu-Rho, & Lambda/Mu fluid stack, from P and S inversions,” 1997.
11 Krief, M., Garat, J., Stellingwerff, J. and J. Ventre, “A petrophysical interpretation using the velocities of P and S waves,” The Log Analyst, Vol. 31 (6), 1990, pp. 355-369.
12 Murphy, W., Reischer, A. and K. Hsu, “Modulus decomposition of compressional and shear velocities in sand bodies,” Geophysics, Vol. 58, 1993, pp. 227-239.
13 Hedlin, K., “Pore space modulus and extraction using AVO,” SEG Expanded Abstracts, 2000, pp. 170-173.
14 Hilterman, F. J., “Seismic amplitude interpretation,” Short SEG Distinguished Instructor Series 4, 2001.
15 Russell, B. H., Gray, D., Hampson, D. and L. R. Lines, “Linearized AVO and poroelasticity,” CREWES research report, Vol. 18, 2006.
BIBLIOGRAPHY
Han, D. H., and M. Batzle, “Fizz water and low gas-saturated reservoirs: The Leading Edge, Vol. 21, pp. 395-398, 2002.
Smith, G. C. and P. M Gidlow, “Weighted stacking for rock property estimation and detection of gas,” Geophys. Prosp., Vol. 35 (9), 1987, pp. 993-1014.
|
THE AUTHORS
|
| |
Hong Feng is a student at the University of Calgary, and a member of the CREWES team (Consortium for Research in Elastic Wave Exploration Seismology). This work is in part the subject of his thesis.
|
|
| |
Brian H. Russell has worked in all aspects of exploration geophysics. After joining Chevron Standard in 1976 as a seismic interpreter, Dr. Russell joined Teknica Resources Development as a senior geophysicist. In 1983, he moved to Veritas Seismic Ltd. in a research and training position. In 1987, Dr. Russell, together with Dan Hampson, founded Hampson-Russell Software Services Ltd., a company that develops advanced seismic software for the petroleum industry. Since September 2002, Hampson- Russell has been a wholly-owned subsidiary of Veritas DGC Inc., where Dr. Russell is currently Vice-President. He earned a BSc (Honours) in Physics and Geophysics from the University of Saskatchewan, an MSc in Geophysics from the University of Durham, England, and a PhD in Geophysics from the University of Calgary. Russell was president of the Canadian SEG in 1991, received the CSEG Meritorious Service Award in 1995 and the CSEG Medal in 1999. Dr. Russell served as President of SEG during 1998−99.
|
|
| |
John Bancroft earned a BSc from the University of Calgary in 1970, and an MSc in 1972, both in electrical engineering. He received his PhD in electrical engineering from Brigham Young University in 1976. He began his career at the National Technical Institute for the Deaf/Rochester Institute of Technology as a research scientist. In 1980, he pursued geophysics and moved back to Calgary to work at Geo-X Systems Ltd. as director of research, and later with Veritas Seismic from 1988 until 1990 as director of research. In 1990, he started a consulting business, and joined the CREWES project in 1994, and Department of Geology and Geophysics (now the Department of Geoscience) at the University of Calgary.
|
|
|

