First observations from 25.5ºN and 87ºW show that deepwater currents form below the Loop Current and Loop Current rings.
Masamichi Inoue, Susan E. Welsh and Lawrence J. Rouse, Jr., Louisiana State University
The first observations of deepwater currents in the eastern Gulf of Mexico (GOM) have been completed using a deepwater mooring deployed at 25.5°N and 87°W at a water depth of 3,356 m in a flat-bottom area away from the slope water region. This location is ideal to monitor the Loop Current (LC) and deepwater currents in the eastern Gulf.
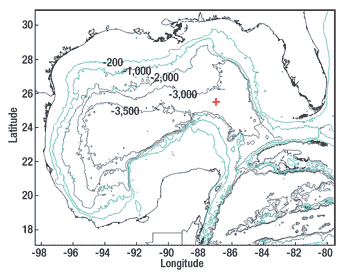
The GOM is a semi-enclosed basin with maximum depths of about 3,400 m in the eastern basin and 3,700 m in the western basin, Fig. 1. The eastern basin is connected to the western basin by a topographic constriction near 88°W. This appears to limit exchange of deep water between the basins.1,2
 |
|
Fig. 1. GOM bathymetric contours (in meters) and the mooring site at 25.5°N and 87°W (marked by the “+” sign).
|
|
Upper-layer circulation in the eastern GOM is dominated by the LC and anticyclonic eddies or LC rings. The rings migrate westward and dominate circulation in the central and western GOM. Flow enters from the Caribbean Sea through the Yucatan Channel with sill depths at about 1,900 m and exits through the Strait of Florida at about 800 m.
Despite the isolation of deep water below the sill depths, deep water appears to be well ventilated and oxygenated, suggesting some energy propagation from the upper layer to deep water. Dominant energetic cyclones in deep water and their interaction with bottom topography3 appear to play an important role in the ventilation of deep water.1
The deep GOM is also ecologically interesting. Along the continental slope there may be distinct habitats zoned by depth, and it is not understood what controls the deep-sea diversity.4 Well-ventilated deep water in the GOM dictates that detailed knowledge about transport, mixing and ventilation processes is needed to assess the environmental impacts of deepwater oil and gas exploration and production on deep-sea communities. Observations of energetic events with strong currents in the northern-slope water region have been reported.5,6 Their possible relationship to LC and LC rings via topographic Rossby waves has been suggested.5-8
Since previous observations of LC rings are usually confined to the upper layer, there have been no direct observations of the formation and migration of deep eddies in conjunction with LC rings in the eastern GOM. The objective of this study was to observe the upstream condition near 87°W and 25.5°N. The site corresponds to the origination point where all of the three major trajectories preferred by the LC rings on their westward journey converge.9,10
LC ring formation is preceded by significant northward LC extension in the eastern GOM.11 Because of the topographic steering exerted by the Campeche Bank on the high-speed jet located along the LC’s western wall,12 whenever any notable northward extension of the LC takes place in the eastern GOM, the high-speed jet is expected to pass near the mooring site. This article presents highlights from the full report published by the US Minerals Management Service.13
MOORING DEPLOYMENT
Under initial funding, three deployments were completed. Although the mooring configuration differed slightly from deployment to deployment, the basic configuration remained intact. The mooring was equipped with two Acoustic Doppler Current Profilers (ADCP), one upward-looking at 140 m and one downward-looking at 3,200 m, along with six Aanderaa current meters set at 155 m, 750 m, 1,500 m, 2,500 m, 3,000 m and 3,175 m to sample the water column. In Deployment 3, an additional current meter was used at 500 m. Five Microcat sensors sampled temperature, conductivity and pressure. They were set at 157 m, 285 m, 752 m, 1,502 m and 2,502 m. The mooring was designed for a 3,340-m depth, and all the deployments were close to the design depth.
Deployment 1 was from May 31, 2000, to Aug. 1, 2001, and Deployment 2 was from Aug. 3, 2001, to June 3, 2002. Deployment 3 was from April 19, 2003, to June 1, 2004. Data return was very good. However, a few sensors failed. Current meter records were corrected for magnetic declination at the midpoint of each deployment. The original current meter data were recorded at 60-min. intervals, while Microcats recorded data at 30-min. intervals. The current velocity records were aligned east-west (U-component) and north-south (V-component).
RESULTS
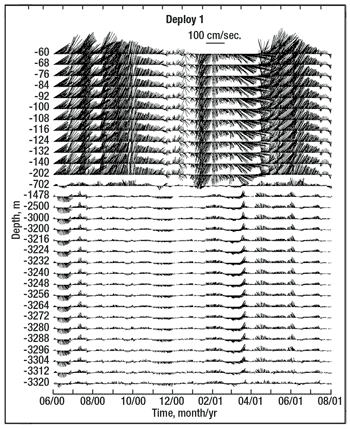
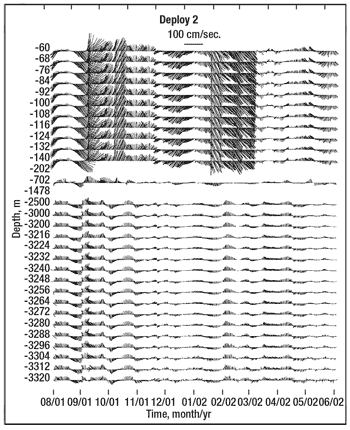
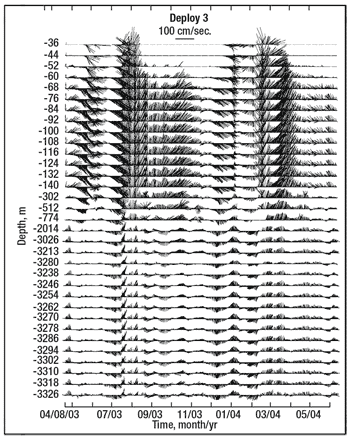
To examine low-frequency current variability that excludes dominant semidiurnal and diurnal tides and inertial oscillations, the hourly current meter data were low-pass filtered with a 40-Hour Low-Pass Filter (40-HRLP), Figs. 2, 3 and 4. Inspection reveals that the upper-layer currents, down to 700-750 m, behave differently than the lower-layer currents below 1,500 m. The interface near 700-750 m is presumably dictated by the shallower sill depth in the Florida Strait compared to that of the Yucatan Channel, thus limiting LC depth penetration, which is continuous from the entrance at the Yucatan Channel to the exit at the Florida Strait.14
 |
|
Fig. 2. 40-HRLP current vectors during Deployment 1.
|
|
 |
|
Fig. 3. 40-HRLP current vectors during Deployment 2.
|
|
 |
|
Fig. 4. 40-HRLP current vectors during Deployment 3.
|
|
The strongest currents measured at 60 m by the top ADCP ranged from 119 cm/sec. in Deployment 2 to 173 cm/sec. in Deployment 1. In contrast, lower-layer maximum currents varied from 43-44 cm/sec. in Deployments 1 and 2 to 55 cm/sec. in Deployment 3. Deepwater currents are nearly depth independent throughout the lower layer.
Maximum mean near-surface currents near 60 m ranged from 38 cm/sec. in Deployment 2 to 61 cm/sec. in Deployment 1. In the lower-layer, mean currents were 11-12 cm/sec. in Deployments 1 and 2 to 17 cm/sec. in Deployment 3. Standard deviation decreased in Deployment 1 from 37 cm/sec. near 60 m to 23 cm/sec. at 155 m, 8 cm/sec. at 750 m, and 7 cm/sec. in deep water; in Deployment 2 from 24 cm/sec. at 60 m to 21 cm/sec. at 140 m, 8 cm/sec. at 700 m and 7 cm/sec. in deep water and in Deployment 3 from 29 cm/sec. at 97 m, to 21 cm/sec. at 169 m, 11 cm/sec. at 792 m, and 7 cm/sec. in deep water.
The upper-layer currents display strong directionality with mean currents pointing to the LC direction, northeast in Deployments 1 and 3, and southeast in Deployment 2. The current ellipse’s major axis generally aligns with the dominant current direction. However, during Deployment 3, the major axis runs northwest-southeast, while the mean currents point northeasterly. The upper-layer currents weaken rapidly below 200 m, reflecting the surface-intensified LC character.
Currents in the lower layer are much weaker, with weak mean currents pointing northward, while current variability (standard deviation ellipses) shows more isotropic characteristics. The weaker mean currents and more isotropic variability suggest that it may be driven by passage of eddy-like features, rather than a steady current.
Long-term mean current in the lower layer is northerly in every deployment, suggesting a northward drift at the mooring site. In contrast, the upper-layer is dominated by LC and LC rings. During Deployments 1 and 3, the high-speed jet was in the mooring’s vicinity. Mean current vectors and the ellipses’ size and shape suggest that low-frequency currents dominate.
Current component spectra (north-south and east-west) show prominent peaks from diurnal tides and inertial oscillations (~27.8 hr) throughout the water column. Peaks are more prominent in the lower layer due to lower overall deep water energy levels. With periods longer than 50 days, the upper layer seems to be much more energetic. For periods shorter than 50 days, the energy level for the upper layer and lower layer are much closer.
For the upper layer, Deployment 1 shows the most energetic peak near 120 days, while it is near 80 days for Deployment 2 and 50 days for Deployment 3. At this peak, the upper-layer, north-south component is more energetic than the east-west component, particularly during Deployment 1. This peak represents the passage of the LC frontal jet currents, thus representing LC migrations in the eastern GOM associated with LC ring formations.
How quickly the peak fades with depth cannot be addressed due to the paucity of current measurements near the interface between the two layers. However, it is evident that it diminishes with depth and the transition to lower-layer takes place around 700--750 m, where it is least energetic.
The most energetic peak in the lower-layer corresponds to a 40- to 50- day time scale. This peak represents an eddy-like deepwater feature observed at the site. There appears to be a peak near 20-14 days in the upper layer. It is interesting that, although spectra shape for the upper and lower layer remains more or less similar, details vary from deployment to deployment, suggesting that any one-year observation is not long enough to capture basic flow-field statistics driven by the LC, because of the long time scales for LC ring formation.
YEAR-TO-YEAR VARIABILITY
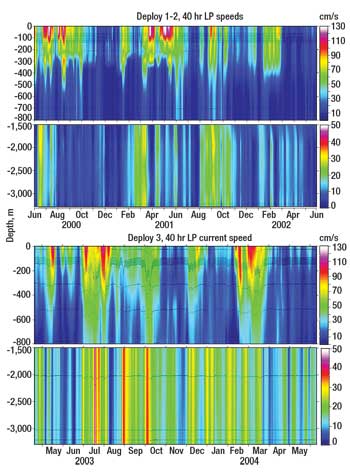
The deployment records reveal significant year-to-year variability in the observed currents. A major difference between the first two deployments and the third is that the lower layer was much more energetic during Deployment 3. This is evident in Fig. 5, which indicates a much more energetic deepwater flow regime during the third deployment.
 |
|
Fig. 5. Vertical section of 40-HRLP current speed during Deployments 1 and 2 (top) and Deployment 3 (bottom). Black dots indicate depth variations of current measurements. Depth of top ADCP was not corrected for blow-over.
|
|
Energetic events in the upper layer always display the surface-intensified characteristic of the LC frontal jet and LC rings, while energetic events in the lower layer are depth independent. In the upper layer during Deployment 3, episodic energetic events are characterized by deeper depth penetration and not by the magnitude of the near-surface jets.
It is interesting that many of these upper layer energetic events appear to be associated with high energy expression in the lower layer. Throughout Deployment 3, there were many more deep energetic events lasting several days that do not show corresponding upper-layer expression typical of the LC or LC rings.
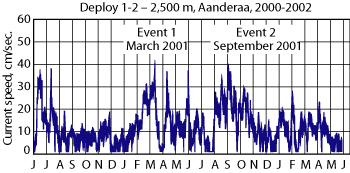
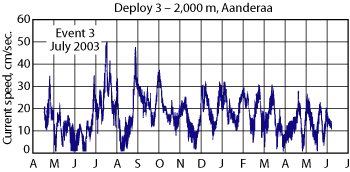
There appears to have been a shift in deepwater baseline energy level between the first two deployments and Deployment 3, especially after June 2003, Figs. 6 and 7. During Deployments 1 and 2, minimum currents were nearly zero throughout, while during Deployment 3 the baseline was shifted upward by 5-6 cm/sec. This suggests that the inter-deployment variability includes a shift in deepwater energy level. There were short-duration energetic events recorded during each deployment, lasting only a few days. However, they represent the strongest currents ever recorded during the deployments. Event 3 of Deployment 3 was the strongest event, Fig. 8.
 |
|
Fig. 6. Raw current speed at 2,500 m during Deployments 1 and 2.
|
|
 |
|
Fig. 7. Raw current speed at 2,000 m during Deployment 3.
|
|
 |
|
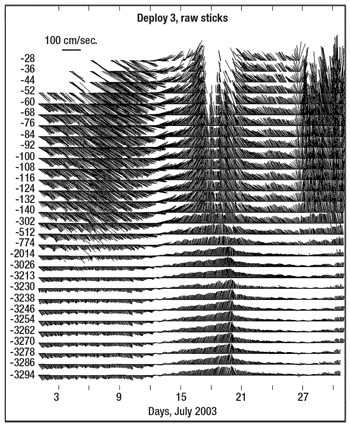
Fig. 8. Raw current vectors observed during Event 3.
|
|
Inspection of similar plots for the first two events indicates that the deepwater currents are vertically coherent northward currents, while upper-layer flow varied from event to event. Upper-layer currents during Event 1 were toward the southeast, while the lower-layer currents flowed northward. Some phase-locking between the upper layer and lower layer was observed during the peaks of Events 2 and 3.
Events 1 and 2 display current speeds of about 40 cm/sec., but Event 3 had deepwater currents exceeding 50 cm/sec. (1 knot), by far the strongest deepwater currents observed. It is interesting that during these events, near-surface currents did not show proportional strengthening. However, these strong events resulted in severe blow-over of the entire mooring, thus the top ADCP was measuring currents significantly deeper than the design depth. Consequently, the strongest near-surface currents were not captured. For example, during Event 3, all the instruments were submerged 180-200 m deeper than their design depths with most of the blow-over taking place in deep water.
According to the historical mesoscale altimetry data archived at the University of Colorado by Dr. Robert Leben, the mooring was on the eastern side of the LC during Event 1 and recorded southeasterly flow in the upper layer. In contrast, deepwater currents remained weak until March 13, 2001, when sudden strengthening of northeast flow occurred. This flow peaked around March 18 and gradually weakened thereafter, while its direction shifted more northerly. By March 21, the flow returned to pre-Event 1 flow strength.
Using altimetry maps, the LC elongated toward the northwest in late February 2001, and extended north of 27°N and west of 90°W. In mid-March, a closed circulation began to form at the LC tip, which separated as Eddy Millennium on April 10.11 The strengthening of deepwater flow at the site coincides with the circulation feature that became Eddy Millennium.
During Event 2, the mooring remained near the LC’s northwestern corner, while its distance to the high-speed jet varied. Event 2 coincided with the formation of Eddies Odessa and Nansen. Eddy Nansen was formed on May 12, 2001 and Eddy Odessa was formed in early September 2001. Northward deepwater flow appeared in early September 2001, and it strengthened until peaking September 8. Then, it gradually weakened. Upper-layer flow down to 702 m displays southeast flow in early September. However, it shifted to the northeast around Sept. 6, when the upper layer became phase locked with lower layer flow. Phase locking continued until the end of September 2001. Phase-lock timing between the upper and lower layers is coincident with the LC tip separation that formed Eddy Odessa and Eddy Nansen.
Event 3 resulted in the strongest deepwater currents observed with currents exceeding 50 cm/sec. (1 knot) in deep water. It preceded the formation of Eddy Sargassum, which separated on Aug. 5, 2003. Around July 7, 2003, the mooring was on the eastern side of the LC extension, which resulted in southwesterly upper-layer flow at the site. As the LC shifted eastward between July 13 and July 15, the upper layer currents shifted to the northeast and north. Relatively weak deepwater flow was found in early July, and at this time phase locking between upper and lower layers already existed. As upper-layer flow shifted to the northeast, deepwater flow followed closely. Deepwater flow gained strength around July 15, reaching peak strength July 18-19. At this time, the upper-layer was moving quite fast, perhaps signaling the presence of a high-speed jet nearby. This was followed by weakening flow in both the upper and lower layers, as the high-speed jet moved away.
All three energetic events preceded the formation of LC rings and, regardless of the upper-layer flow, deepwater flow at the mooring site was northward. These strong northward deepwater currents lasted a few days and extended from below the interface to the bottom.
Two more eddies separated from the LC during Deployment 3 that were not accompanied by strong deep northward currents. The first of these detached on Sept. 23, 2003, and re-attached on Nov. 28. One month later on Dec. 31, 2003, a much smaller Eddy Titanic separated.11
At these depths, the variability range for temperature and salinity is relatively small. However, the Microcats’ sensitivity allows signal detection of water-mass property changes. The salinity variability range was 0.003 at 2,500 m during Deployments 1 and 2, and it remained similar at 2,000 m during Deployment 3. The temperature variability range was 0.02°C at 2,500 m during Deployments 1 and 2, while it was 0.05°C at 2,000 m during Deployment 3.
Event 1 had accompanying changes toward increasing temperature and decreasing salinity. This event was followed by slightly cooler and saltier water. Event 2 was associated with cooler and saltier water. Deployment 3 appears to be notably different in that temperature changed more widely with significantly more energy at time scales of one week to a month. Unfortunately, the conductivity sensor on the Microcat at 2,000 m during Deployment 3 stopped functioning after November 2003. However, there is a clear indication of comparable energy peaks at similar time scales in the salinity signal.
Strong current events during Deployment 3 appear to be associated with notable signal in temperature and salinity. Event 3, for example, was followed by significant cooling and increase in salinity, indicating that notable disturbance in water mass properties took place in deep water following this event. This suggests that Event 3 was so energetic that local water mass was disturbed. These events might play an important role in local water-mass mixing in the eastern GOM.
The sequence of the events fits nicely into the conservation of potential vorticity mechanism,15 noted to explain the prevalence of a modon pair underneath the LC ring in the eastern GOM.16 Conservation of potential vorticity requires that the lower-layer response to vortex squeezing/stretching of the lower layer, due to the changes in the upper-layer thickness, result in respective relative vorticity for the lower layer.
As the upper-layer anticyclone propagates, it changes the thickness of the lower layer. The lower layer shrinks ahead of the upper-layer anticyclone, and it stretches behind the upper-layer anticyclone. Consequently, a lower-layer anticyclone forms ahead of the upper-layer anticyclone, and a lower-layer cyclone forms behind it.
A two-layer system is clearly indicated by the observations at the site. Furthermore, current in the lower layer below the interface behaves nearly barotropic; i.e., magnitude and direction of currents do not change throughout the lower layer below the interface all the way to the bottom. This is expected based on the conservation of potential vorticity mechanism.
CONCLUSION
The first observations of the upstream conditions in the middle of the eastern GOM, with an emphasis on deepwater flow underneath the LC, revealed that a two-layer approximation is a reasonable way to characterize currents at the mooring site with the interface located near 700-800 m. Upper-layer currents are dominated by the LC and LC rings, while the upper- and lower-layer currents appear to be decoupled. Deep water in the eastern GOM is energetic and barotopic throughout the lower layer, and it appears to be driven by the LC and LC rings. Deep water at the mooring site is relatively energetic with 40-50 day variability and 10-30 cm/sec. currents.
Energetic events lasting a few days could result in strong deepwater currents exceeding 1 knot all the way to the bottom. These deepwater events appear to take place when the LC makes notable northward extension, preceding the formation of LC rings. Deepwater currents at the mooring site appear to be a modon pair, which forms underneath a LC ring.
Shorter time scales associated with deepwater flow are a reflection of smaller deepwater eddies, resulting from deepwater eddies interacting with the bottom topographic constriction between the eastern and the central GOM. The three deployments were unique, confirming the previous observation that every LC-ring formation is unique and that a long-term measurement is required to establish basic statistics of ocean dynamics in the eastern GOM. 
ACKNOWLEDGEMENTS
The authors thank the Coastal Marine Institute at LSU, which is funded by the Minerals Management Service (MMS), and the Office of Research and Economic Development at Louisiana State University for providing the funding for this project. This project was supported by MMS contract 1435-01-CA-30951-16805. We acknowledge the role of the Coastal Studies Institute (CSI) Field Support Group in carrying out the field program and the CSI faculty and staff for providing support for this project. We also thank the crews of Pelican and Longhorn for helping us service the mooring. Mr. Eddie Weeks played a major role assisting in data analysis, with additional assistance provided by Dr. Dongho Park.
LITERATURE CITED
1 Welsh, S. E., and M. Inoue, Lagrangian study of the circulation, transport, and vertical exchange in the Gulf of Mexico: Final report. US Dept. of the Interior, Minerals Management Service, Gulf of Mexico OCS Region, New Orleans, LA. OCS Study MMS 2002-064., 51 pp., 2002.
2 Weatherly, G. L., N. Wienders, and A. Romanou, Intermediate-depth circulation in the Gulf of Mexico estimated from direct measurements. In: Sturges, W. & A. Lugo-Fernandez, eds. Circulation in the Gulf of Mexico: Observations and Models. Geophys. Monogr., vol. 161, Amer. Geophys. Union. pp.315-324, 2005.
3 Hurlburt, H. E. and J. D. Thompson, The dynamics of the Loop Current and shed eddies in a numerical model of the Gulf of Mexico, In: Nihoul, J.C.J., ed. Hydrodyanmics of Semi-enclosed Seas. New York: Elsevier Science. pp.243-298, 1982.
4 Carney, R. S., “Addressing the ecological unknowns of deep water oil and gas development,” Deepwater 1996 Information Transfer Meeting Presentations. US Dept. of the Interior, Minerals Management Services, Gulf of Mexico OCS Region, New Orleans, LA, 1996.
5 Hamilton, P. and A. Lugo-Fernandez, “Observations of high speed deep currents in the Northern Gulf of Mexico,” Geophys. Res. Letters, vol. 28, pp. 2,867-2,870, 2001.
6 Hamilton, P., “Deep-current variability near the Sigsbee Escarpment in the Gulf of Mexico,” J. Phys. Oceanogr., vol. 37, pp. 708-726, 2007.
7 Hamilton, P., “Deep currents in the Gulf of Mexico,” J. Phys. Oceanogr., vol. 20, pp. 1,087-1,104, 1990.
8 Oey, L. Y., and H. C. Lee, “Deep eddy energy and topographic Rossby waves in the Gulf of Mexico,” J. Phys. Oceanogr., vol. 32, pp. 3,499-3,527, 2002.
9 Vukovich, F. M. and B. W. Crissman, “Aspects of warm rings in the Gulf of Mexico,” J. Geophys. Res., vol. 91, pp. 2,645-2,660, 1986.
10 Vukovich, F. M., “Climatology of ocean features in the Gulf of Mexico using satellite remote sensing data,” J. Phys. Oceanogr., vol. 37, pp. 689-707, 2007.
11 Leben, R. R., Altimeter-derived Loop Current metrics. Circulation in the Gulf of Mexico: Observations and Models. In: Sturges, W. & A. Lugo-Fernandez, eds. Circulation in the Gulf of Mexico: Observations and Model, Geophys. Monogr., vol. 161, Amer. Geophys. Union. pp.181-201, 2005.
12 Oey, L. Y., T. Exer, and H. C. Lee, Loop current, rings and related circulation in the Gulf of Mexico: A review of numerical models and future challenges, In: Sturges, W. & A. Lugo-Fernandez, eds. Circulation in the Gulf of Mexico: Observations and Models, Geophys. Monogr., Amer. Geophys. Union. vol. 161, pp. 31-56. 2005.
13 Inoue, M., S. E. Welsh, L. J. Rouse, Jr., and E. Weeks, Deepwater currents in the Eastern Gulf of Mexico: Observations at 25.5°N and 87°W, US Dept. of the Interior, Minerals Management Service, Gulf of Mexico OCS Region, New Orleans, LA., OCS Study MMS 2008-001, 95 pp., 2008.
14 Bunge, L., J. Ochoa, A. Badan, J. Candela and J. Sheinbaum, “Deep flows in the Yucatan Channel and their relation to changes in the Loop Current extension,” J. Geophys. Res., vol. 107, p. 3,233, doi:10.1029/2001JC001256, 2002.
15 Cushman-Roisin, B., E. P. Chassignet, and B. Tang, “Westward motion of mesoscale eddies,” J. Phys. Oceanogr., vol. 20, pp. 758-768, 1990.
16 Welsh, S. E., and M. Inoue, “Loop Current rings and the deep circulation in the Gulf of Mexico,” J. Geophys. Res., vol. 105(C7), pp. 16,951-16,959, 2000..
|
THE AUTHORS
|
| |
Masamichi Inoue earned a BE in naval architecture from Tokai University, an MS in ocean engineering from University of Rhode Island, ME in civil engineering and Ph.D in oceanography from Texas A&M University. He has been at Louisiana State University (LSU) for the past 21 years as Associate Professor in the Department of Oceanography & Coastal Sciences and Director of the Coastal Studies Institute. Dr. Inoue’s interests include ocean circulation and transport processes.
|
|
| |
Susan Welsh earned a BS in earth and planetary sciences from Johns Hopkins University, an MS in oceanography from Florida State University and a Ph.D in geology from LSU. She has worked in the Coastal Studies Institute for 19 years and is presently a Research Associate. Dr. Welsh’s research areas are physical oceanography, numerical ocean models and Gulf of Mexico circulation.
|
|
| |
Lawrence Rouse earned a Ph.D in physics from LSU in 1972. He is the director of the Coastal Marine Institute at Louisiana State University and an Associate Professor in the Department of Oceanography and Coastal Sciences and the Coastal Studies Institute. His interests are coastal and shelf circulation, estuarine-shelf exchange, and remote sensing.
|
|
|

