There are many situations where OBC data can make a difference: Gas occlusion, fault shadows and shear wave splitting are some of the problems that were overcome on this project.
Raul Sarmiento, EOG Resources, Inc., Houston; Tony Johns and Carmen Vito, WesternGeco, Gatwick, UK
High-quality multi-component (4C) seismic data can deliver superior structural imaging and provide field-wide rock property indicators; however, getting the most from a 4C dataset required robust processing and analysis workflows. This article presents an example of 4C acquisition and processing that includes detection and compensation for anisotropy, providing valuable additional information about the subsurface.
BACKGROUND
The Pamberi survey area is about 50 km SE of Galeota Point, which is at the southeastern tip of Trinidad, Fig. 1. It is within the LRL Block, in which there are about six wells. The 16-km seismic survey area traverses the Pamberi-1 well location. Pamberi is not a producing field, but is located about 15 km southwest of the Kiskadee gas field in neighboring South East Coast Consortium (SECC) Block. Kiskadee is operated by EOG with BP as a partner. At end 2006, EOG Resources, Inc., has 20% of its reserves in Trinidad and Tobago. Prospects are all in the Columbus Basin, located south and east of Trinidad. Production from this basin in 2006 was 107 Bcfe of gas and end-of-year reserves were 1,364 Bcfe.
 |
|
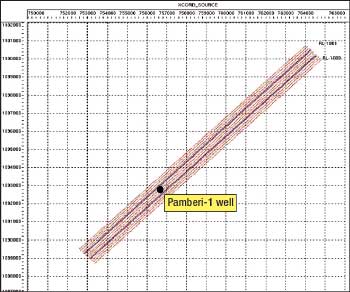
Fig. 1. Location of Pamberi 4C survey, offshore Trinidad.
|
|
The survey area is over a thick sequence of sands and shales of Pliocene, Pleistocene and younger age. These rocks comprise a prograding-aggrading basin fill package and span depositional environments from fluvial to distal shelf and slope to basinal settings. Clastic sands dominate the section above 10,000 ft, with higher concentrations of shale below. The sands are sourced from the Orinoco Delta and have been deposited on a shallow shelf. The primary reservoir target is in Pleistocene sand/shale sequences at depths between 10,000 to 17,000 ft; equivalent to about 2.5 to 3.8 sec. TWT on the P-wave seismic section. There are also shallower and deeper prospects in the area, but these are considered higher geologic risk. Miocene and Cretaceous carbonates exist at around 30,000 ft.
Mud weight profiles from Pamberi-1 and neighboring wells show that the overburden is normally pressured down to about 10,000 ft, close to the base of the sand-dominated section, and thereafter becomes highly overpressured with increasing depth, Fig. 2.
 |
|
Fig. 2. Mud weight profiles of Pamberi-1 and neighbouring wells.
|
|
PREVIOUS SEISMIC
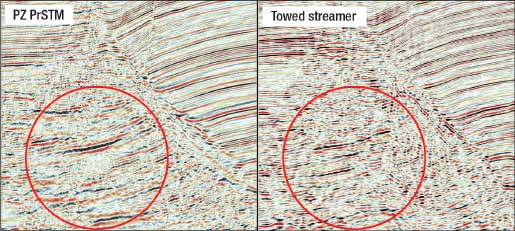
A conventional towed-streamer 3D seismic survey was acquired over the Pamberi area in 2003, shot parallel to the regional fault trend using a single vessel towing six streamers, each 5,200 m long. The resulting 3D dataset, processed with a bin size of 25 x 30 m, successfully imaged several strong reflectors in the down-thrown side of a major growth fault trap that controls the reservoir trap mechanism. By contrast, potential reservoir sands on the up-thrown side, beneath the fault, are very poorly imaged due to a problematic illumination shadow effect, Fig. 3. This effect cannot be explained by lithological change across the fault, as both sides are known to be shelf clastics. The observed fault shadow effect results in apparent velocity sags between fault blocks deeper in the section. The faults act as pressure seals and these apparent sags may, in part, be due to overpressure.
 |
|
Fig. 3. Potential reservoir sands beneath the major fault are poorly imaged in the conventional towed-streamer 3D dataset.
|
|
The existence of shallow gas may be the cause of additional complications, through slowing raypaths and thus contributing to the sag effect.
PAMBERI SURVEY OBJECTIVES
EOG contracted WesternGeco to acquire a 4C (OBC) survey across its Pamberi-1 well in November 2004 using Q-Seabed technology. The purpose of the test was to evaluate the potential of long-offset multi-component data for improving stratigraphic interpretation in such geologically challenging areas. In particular, the objective was to identify the lithology and reservoir potential of reflection events around 10,000 to 14,000 ft, using both conventional P-wave and mode-converted PS-wave datasets.
In addition to improved structural imaging, it was hoped that advanced analysis of the new data could provide indications of rock properties, enabling lithological characterization of the reflectors under the fault. This analysis required valid integrity and maintenance of relative amplitudes and phase in the input data.
ACQUISITION
Parameters for the Pamberi 4C test survey were based on well data and previous seismic surveys in the area. The survey was shot as a swath, illuminating a subsurface area of about 16-km inline by 750-m crossline, Fig. 4. Although the crossline aperture was insufficient for this to be considered a full 3D survey, it enabled some 3D binning, processing and analysis tools to be applied.
 |
|
Fig. 4. Pamberi 4C survey basemap.
|
|
Two parallel 16-km ocean bottom cables, separated by 400 m, were deployed on the seabed in water depths varying gradually from 65 m in the southwest to 70 m in the northeast. Receiver station interval along each cable was 25 m. Twelve source lines, with crossline separation of 100 m, were shot parallel to the receiver lines. Source lines extended far beyond the receiver lines to provide split-straddle source-receiver offsets (both positive and negative) up to 10,000 m and yielding a nominal inline fold of 133. Record length was 12 sec. to capture the slower converted shear-wave traveltimes.
PRE-PROCESSING
The raw data from each group of three GACs (geophone accelerometers) were rotated into vertical (Z), horizontal inline (X), and crossline (Y) directional responses using in-field inclinometer measurements, followed by a transformation from acceleration to velocity. After Quality Control (QC) of the navigation positioning, the field data were split into separate components for the next processing stage. The hydrophone (P) and vertical geophone (Z) components were extracted and combined through non-linear summation after application of a Z to P statistical-matching filter to compensate for coupling variances. The resulting PZ dataset was then input to a relatively conventional P-wave processing scheme.
Meanwhile, the X and Y geophone components were input to a PS (converted-wave) processing flow. Vector fidelity and cross-component equalization were verified by comparing early reflection events on orthogonal (45°, relative to source-receiver direction) common-azimuth receiver gathers sub-stacked over the inner 500-m offsets at several locations. This analysis indicated very good vector fidelity, which provided confidence in subsequent analysis of azimuthal anisotropy.
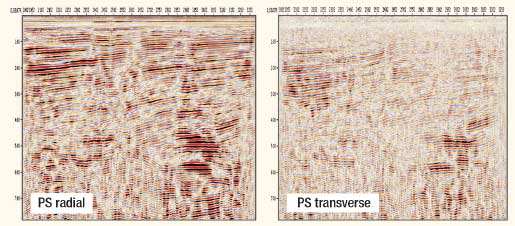
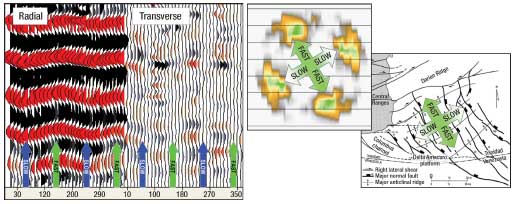
Data conditioning for the PZ and PS datasets included linear noise attenuation and surface-consistent demultiple and amplitude compensation. The PS data were rotated into radial (source-receiver azimuth) and transverse (orthogonal) components. An initial stack of the transverse data exhibited coherent energy corresponding to primary reflections seen on the radial stack, Fig. 5. This was early evidence of shear-splitting, or birefringence, indicating the presence of Horizontal Transverse Isotropy (HTI). This raised several implications, and opportunities, for later processing and analysis of the dataset.
 |
|
Fig. 5. The PS tranverse data exhibit coherent energy that corresponds to primary reflections seen on the radial stack-evidence of shear-splitting.
|
|
PRESTACK TIME MIGRATION
The initial phase of imaging for the PZ and PS datasets was accomplished using dual-surface (to account for different source and receiver depths) curved-ray Kirchhoff PreStack Time Migration (PrSTM). Detailed Residual Moveout (RMO) analysis was applied to a dense grid of migrated PZ gathers to develop the final velocity model for PrSTM of the P-wave dataset. This model formed the basis for developing a velocity field for PrSTM of the PS data.
A regional average vertical Vp/Vs parameter was determined from event correlation and fault registration on interpreted PZ and initial PS asymptotic CCP binned stacks and migrations. A parameter parameter was determined from event correlation and fault registration on interpreted PZ and initial PS asymptotic CCP binned stacks and migrations. A parameter  was estimated for VTI anisotropy (transversely isotropic with a vertical axis of symmetry). This type of anisotropy is typically associated with a stack of isotropic layers such as shales. PS waves are more sensitive to VTI anisotropy than PP waves because of their asymmetric travel paths. The two parameters and was estimated for VTI anisotropy (transversely isotropic with a vertical axis of symmetry). This type of anisotropy is typically associated with a stack of isotropic layers such as shales. PS waves are more sensitive to VTI anisotropy than PP waves because of their asymmetric travel paths. The two parameters and  , combined with the P-wave velocity field and a vertical Vs velocity field from partial inversion of the initial V(PS) and V(P) velocities, were used for the first iteration of PrSTM for the PS data. Three iterations of 3D PS-PrSTM were performed, each refining the vertical V(S) and interval property fields. The final PS PrSTM-3D stack was destretched to the equivalent PP time to enable comparison with the PZ data and the previous 3D towed streamer survey. , combined with the P-wave velocity field and a vertical Vs velocity field from partial inversion of the initial V(PS) and V(P) velocities, were used for the first iteration of PrSTM for the PS data. Three iterations of 3D PS-PrSTM were performed, each refining the vertical V(S) and interval property fields. The final PS PrSTM-3D stack was destretched to the equivalent PP time to enable comparison with the PZ data and the previous 3D towed streamer survey.
THE TIME MIGRATED RESULTS
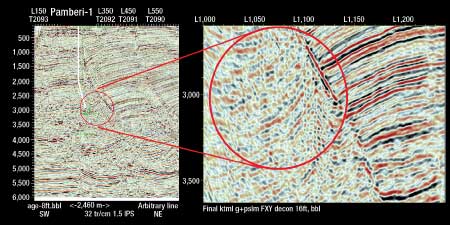
Gather quality and imaging, including under the main fault, were notably improved relative to the 3D streamer data on both the PZ and PS PrSTM datasets, Fig. 6. PZ data recorded on the seabed generally has better bandwidth and Signal-to-Noise ratio (S/N) than PP streamer data, and provides opportunities for more effective multiple attenuation.
 |
|
Fig. 6. Imaging under the main fault is notably improved in the new PZ data relative to the 3D streamer data.
|
|
Despite the limited crossline aperture of the single swath, a 3D approach to the processing provided further S/N improvement. Velocity fields derived from the seismic data agreed closely with the observed geology and measured pore pressure change in proximity to the Pamberi well. VTI anisotropy for the PS data correlated closely to the localized geology and shale transition zone, despite only limited effort to constrain or validate parameters based on well data.
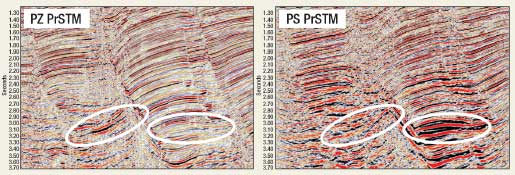
Comparison of the PZ and PS PrSTM final sections reveals some significant amplitude differences between what are nominally the same reflections, particularly on the down-thrown side of the main fault, Fig. 7. These differences, combined with indications of anomalies in derived interval Vp/Vs ratios, clearly needed to be understood quantitatively. As a consequence, a new project was initiated in 2006 to run full waveform prestack joint inversion on PP and PS gathers processed through anisotropic PreStack Depth Migration (PrSDM), using cell-based grid tomography calibrated to wells, designed to extract rock property attributes for lithology discrimination.
 |
|
Fig. 7. The PZ and PS PrSTM final sections exhibit significant amplitude differences between what are nominally the same reflections.
|
|
DEPTH PROCESSING
Processing 4C data in the depth domain has several theoretical advantages. In particular, it facilitates registration of P- and PS-wave events within a common depth model, incorporating anisotropy and calibrated to available well data.
Before embarking on the anisotropic PrSDM, studies were performed into the HTI anisotropy indicated during the earlier data conditioning process. Intervals of rock that exhibit HTI can cause shear waves to split into fast (S1) and slow (S2) components, propagating orthogonal to each other. Depending on the difference between S1 and S2 and thus the magnitude of azimuthal anisotropy, this polarization can result in reduced resolution of the radial PS signal due to the destructive interference of fast and slow shear energy. A proprietary rotation analysis was used to extract the principal fast and slow polarization direction from the full, elastic shear-wave field propagation and to try to quantify the amount of potential shear splitting. The analysis was performed on common receiver gathers at 1-km intervals along the central line of the swath.
As a result of the limited crossline extent of the swath, the gathers were limited to the inner 500-m offset range to provide a full 360° distribution of azimuths. The analysis produced stacked traces at 10° increments, from 10° to 360°, for both radial and transverse components. Variations in travel time in the radial data and “snowflake” analysis of polarity reversals in the transverse data indicate S1 and S2 directions and hence any rotation in the principal axis of polarization.
Analysis along the southern part of the survey line, on the up-thrown side of the major fault, indicated a consistent fast S1 direction aligned to 150°/330° with the orthogonal S2 direction at 60°/240° corresponding to slower arrival times. The fast orientation of polarization is parallel to the regional normal fault trend and is consistent with the dominant stress fields between anticlinal ridge trends acting as pressure seals within each major fault block, Fig. 8. Analysis over the central and northern set of receiver gathers, on the downthrown side of the major fault, shows less residual coherent energy on the transverse data and minimal azimuthal variation in velocity, indicating less shear splitting.
 |
|
Fig. 8. Polarization analysis of PS data on the up-thrown side of the major fault indicates polarization orientations consistent with dominant local stress fields.
|
|
PRESTACK DEPTH MIGRATION
The preprocessed radial component (source-receiver rotated direction) data were used as input to the PS PrSDM. A Kirchhoff depth imaging algorithm was used, specific for PS-waves with anisotropy and the different source and receiver datums inherent to OBC acquisition geometry. The key challenge was to derive a valid velocity model that would deliver optimized stack response, and correlate equivalent events on both PZ and PS depth sections at the correct depth as indicated by well data.
Velocity analysis for the 3D PrSDM evaluated RMO. Prestack data were depth migrated with a starting velocity model and RMO evaluated on the resulting Common Image Point (CIP) gathers. If all events on gathers are flat-i.e., they image at same depth for all offsets-the velocity model can be considered correct with the resolution limits of the seismic data. If the gathers are not flat, residual migration equations relating changes in RMO to changes in the velocity model are calculated and solved to produce a gather-flattening update. The equations are calculated using a ray tracer. The input to the tomography also includes a detailed dip field, which provides for more accurate upward ray tracing. For this project, velocity analysis was first performed on the PZ data to derive a good V(P) model before proceeding to run tomography on the PS data. The PrSDM work flow is summarized as follows:
1. Prestack depth migrate the PZ data with an initial smoothed isotropic P-wave velocity field, derived from the PrSTM processing.
2. Update isotropic V(P) iteratively from residual velocities using CIP tomography to flatten gathers.
3. Update V(P) with anisotropy to tie depths at the Pamberi-1 well location deriving both and and  to flatten gathers over the shallow depth range of the well. to flatten gathers over the shallow depth range of the well.
4. Incorporate the VTI model from the previous time processing to represent the anisotropy below and beyond the proximity of the well. In this instance, it was decided to hold constant with spatially varying.
5. Migrate PZ with the updated anisotropic V(P) model.
6. Migrate PS data anisotropically with the updated anisotropic V(P) and initial smoothed V(S) derived from the PS time processing.
7. Update V(S) iteratively from residual velocities using CIP tomography to flatten PS gathers.
8. Revise V(S) to register equivalent PZ and PS events in depth. Modify and in accordance with the original VTI field.
9. Reiterate with decreasing scalar wavelength using the PS tomography to solve for residual anisotropy (in this case ´) until solution converges.
The methodology was applied using a top-down approach, prioritizing the shallow section first before progressing deeper. During each stage of tomography the RMO corrections applied to the CIP gathers were examined to verify the integrity of the picks and ensure that low-velocity multiple trends or cycle skips were avoided. A 3D dip field was created from the depth-converted PrSTM volumes and updated for the final iteration. This dip field together with the RMO picks and previous velocity model, including anisotropy, were then used to solve linear equations relating the RMO changes to updates in the velocity model.
PrSDM RESULTS
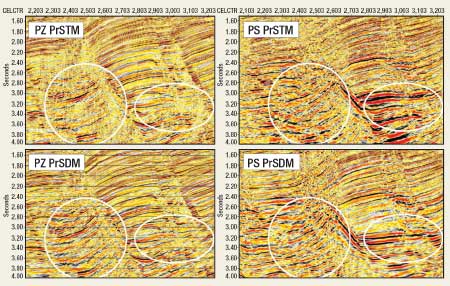
The final PZ and PS PrSDM sections show further enhancement in structural detail and continuity relative to the time-domain processing and improved correlation of target events in the two datasets on the up-thrown side under the main fault, Fig. 9. The inclusion of anisotropic (VTI) properties from the previous time processing, subsequently updated after well control and P-P to P-S event registration, significantly improved the final PS imaging; more so than the impact noted in the P-wave migration. PrSDM delivered better flattening of the PS CIP gathers across the entire 10,000 m offset range - important for future AVO/inversion work in the extraction of rock property attributes.
 |
|
Fig. 9. The final PZ and PS PrSDM sections show enhanced structural detail and continuity relative to time-domain processing, and improved correlation of target events in the two datasets on the up-thrown side under the main fault.
|
|
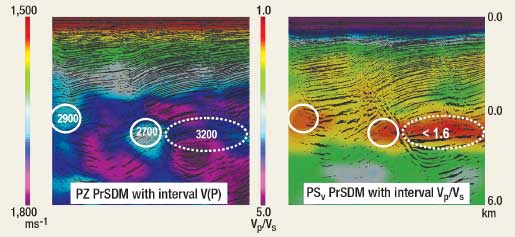
When combined with other information, observed Vp/Vs ratios can help to discriminate variations in lithology, pore pressure and fluid content, Fig. 10. Gas-fill generally reduces Vp/Vs in sands. Areas of low Vp/Vs on the up-thrown side of the fault (marked with white circles) are associated with low Vp, indicating soft overpressured gas sands. The area of low Vp/Vs observed on the down-thrown side of the fault (shown by the dotted oval), has higher Vp, implying normal pressured gas saturated hard sand.
 |
|
Fig. 10. Observed Vp/Vs ratios can help to discriminate variations in lithology, pore pressure and fluid content.
|
|
CONCLUSION
Anisotropic PrSTM of a swath of multi-component (4C) data acquired in the Pamberi area of the Columbus Basin, offshore Trinidad delivered improved quality imaging relative to a previous conventional 3D towed-streamer survey. Further improvement was provided through the application of anisotropic PrSDM of the PZ and PS wave data, using cell-based tomography calibrated to well information.
In addition, measured interval velocities and Vp/Vs ratios provide indications of lithology and fluid content. Work currently in progress is taking advantage of the improved PZ to PS event correlation of the enhanced anisotropic depth-migrated gathers to quantitatively classify, using additional nearby well control, the lithology and rock properties of the target interval from joint pre- and poststack inversion. . 
ACKNOWLEDGEMENTS
The authors thank the Trinidadian Ministry of Energy (MOEEI) and EOG Resources for granting permission to publish the results shown in this article, and colleagues at WesternGeco for their processing guidance and inspiration.
|
THE AUTHOR
|
|
|
Raúl Sarmiento has 25 years of industry experience, 11 years with EOG Resources, in international and domestic exploration and development projects. His experience includes acquisition, processing and interpretation of 2D and 3D seismic data and specializes in reservoir characterization, facies analysis, fracture characterization, AVO, amplitude analysis and structural reconstruction, including complex depth conversion using self-coded algorithms. He has established expertise in both carbonates and clastics. He graduated with a BSc in mechanical engineering from Universidad Nacional de Colombia 1980, and an MS in geophysics from the University of Houston 1987.
|
|
|
|
Tony Johns works as a Senior Geophysicist for WesternGeco in Houston-Texas, USA. Graduating in 1977 with a BSc (Hons) degree in mathematics and physics from England, UK, Tony has accumulated 30 years experience in the supervision and management of remote data processing centers worldwide specializing in 2D/3D/4D Marine, OBC and Land seismic data. The last 12 years have been in Houston focused primarily on the development of multi-component seismic processing (and interpretation) techniques. Accomplishments include "Best Geophysical Paper" awards at the SEG annual international meeting in 2001 and the CSEG/CSPG annual conference in 2007.
|
|
| |
Carmen M. Vito graduated from Penn State University with a BSc degree in geosciences in 1997. He started his career at WesternGeco on one of the marine crews, before being transferred to the Houston data processing center. For the last eight years, his main focus has been processing and developing 4C work flows in the time and depth domains.
|
|
|


