Multibeam echosounders and seismic data detect seeps, enhancing hydrocarbon exploration potential.
Dan McConnell, Jamshid Gharib, Jennifer Henderson, Hunter-West Anderson Danque and Adrian Digby, AOA Geophysics, Inc.; Dan Orange, Black Gold Energy
Most major oil fields that were discovered in the early days of oil and gas exploration were traced from natural hydrocarbon seeps at the surface. The eternal flame of the ancient Zoroastrians was likely one of the multitude of natural gas seeps near modern Baku in the Caspian. Colonel Drake’s first oil well was located near natural oil seeps on the banks of what would be renamed Oil Creek in Pennsylvania. The beginnings of Royal Dutch Shell came from the timely recognition of the significance of the numerous natural oil ponds in Sumatra in 1880. The Spindletop field was discovered by a Sunday school teacher poking his cane into a bubbling gas spring and lighting the flame to the amusement of his young students. The list is long; many of the major fields of California, Oklahoma, Mexico, Iran, Iraq, Indonesia and elsewhere were discovered by surface hydrocarbon seeps.
Hydrocarbon seepage also occurs in the marine environment. In 1976, Rudesindo Cantarell, a Mexican fisherman, noted the seeps that led to the discovery of the giant oil field that now bears his name. It is well-known to most in the industry, for instance, that the deepwater Gulf of Mexico is a notoriously leaky petroleum system characterized by more than a thousand hydrocarbon seeps.
Evaluating frontier deepwater basins is an expensive proposition with high risks and high rewards. Exploration teams evaluating deepwater basins need to know which concessions to pursue and which to drop. Modern seafloor mapping and precision geochemical sampling can quickly help teams make this decision. The method presented here is inexpensive and cost effective, at around $100/ km2-about 10 times cheaper than 3D seismic. With multibeam echosounders, the deeper the water, the lower the cost to acquire a 100% seafloor depth image with co-located backscatter. The high-resolution image of the seabed acquired from modern multibeam echosounder data can be interpreted by specialists at sea (along with previously acquired regional 2D seismic data) for indications of seafloor seepage. The identified seeps are then sampled by precision-navigated piston cores. The resulting geochemical analysis can answer critical prospectivity, source and maturity questions from the migrated hydrocarbons that can help the exploration team assess their deepwater prospects.
WHY HUNT SEEPS?
Seafloor mapping has seen great advances during the past century, from the early days of the first echosounders, such as on the FS Meteor, to modern multibeam systems that can acquire data within a 5-m accuracy at over 2,000 m of water depth. With attention to detail on every aspect of the acquisition system, bathymetric data can be acquired with an accuracy better than 0.5% of water depth (e.g., 10-m accuracy in 2,000 m of water). Accurate targeting of potential seep sites can then be sampled by navigated cores that can be located to a similar degree of accuracy, within 10 m of a target at these same depths.
Although the main purpose of locating sediments near potential seeps is to assess reservoir potential in frontier basins, a side benefit of the identification of seeps from multibeam echosounder and sub-bottom profiler data is that they provide a data set by which to characterize foundation zone conditions for development or pipeline routing. The hardgrounds associated with chemosynthetic community sites at seep sites can pose a significant engineering constraint to development operations because the communities are spatially variable in both lateral and vertical extent and will therefore be characterized by highly variable soil conditions. The authigenic carbonate typically present can have strengths far in excess of the expected values for deepwater sediments and prevent standard deepwater foundation emplacement techniques, such as suction piles, from being effective.
Gas hydrate, if present, can increase soil strength, yet the dissociation of gas hydrate during development (where warm fluids moving through a wellbore can melt the nearby gas hydrate) can lead to significant and potentially catastrophic loss of soil strength. Any development in areas with conditions conducive to chemosynthetic community development is likely to harbor difficult foundation design conditions.
WHAT IS A SEEP?
A seep occurs when marine groundwater, whose origins are typically, but not necessarily, standard seawater in composition, upwells to the seafloor and into the overlying water column. This comprehensive definition includes various phenomena as diverse as escaping fluids overpressured by tectonic forces, high-temperature hydrothermal venting, fluids altered in serpentinization reactions, submarine discharge of terrestrial groundwater, and fluids that have been modified by contact with hydrocarbon reservoirs.
Most of these marine groundwater discharges involve fluids that were chemically and/or physically modified by the host material they flowed through, and then at or near the point of discharge mixed with bottom seawater. Often the zone of mixing involves steep chemical gradients between chemically reduced seep fluids and oxidized seawater. It is this chemical gradient that is necessary for chemosynthesis.
CHEMOSYNTHETIC COMMUNITIES
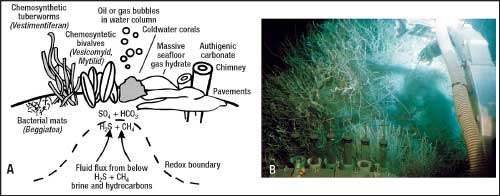
Chemosynthesis is the means by which several groups of archaea and bacteria use energy released by the oxidation of simple compounds like methane and hydrogen sulfide to drive their metabolism. In seep areas, a flux of methane and hydrogen sulfide from deeper hydrocarbon deposits provide these conditions in the near-seafloor interface between upwelling pore fluids enriched with these reduced elements and the oxygenated bottom seawater.1 The identification of seeps from remote sensing data is, in part, made possible by the hardgrounds and shelly parts of animals that live there, Fig. 1.
 |
|
Fig. 1. a) A cold seep chemosynthetic community showing common symbionts and schematic showing upwelling hydrogen sulfide and methane. b) A Vestimentiferan tubeworm community.
|
|
Chemoautotrophic organisms-bacteria and archaea-grow and develop through the energy released during the transfer of electrons from donor to acceptor. Chemosynthetic communities are formed where chemoautotrophic bacteria and archaea provide the necessary primary production to sustain heterotrophs, including macrofaunal assemblages. The chemoautotrophs that form the basis for chemosynthetic communities are typically methanogens and sulfur reducers, as seep fluid is typically influenced by underlying hydrocarbon reservoirs in the region.
IDENTIFYING SEEPS
We recommend two strategies for frontier prospectivity surveys. If there are only 2D exploration data, and the location of the prospects is unclear, then acquiring multibeam echosounder data can cover a large area and be used to locate seeps and sample traces of hydrocarbon leaks from the prospective basin. If there is 3D seismic data, there will be 3D images in the subsurface from which to trace potential leak paths. Precision geochemical data acquired from the first case (multibeam survey) can help determine basin prospectivity and help determine if and where to acquire 3D data. Precision geochemical data from the second case, where there is 3D seismic data, (and the first case) can help answer questions of type, age, quality and source of the hydrocarbon system.
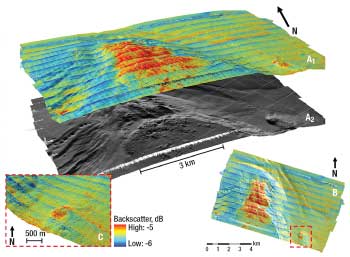
Multibeam echosounder data. This type of data is considered most effective for detecting deepwater seeps and chemosynthetic communities because of the ability to subsample the backscatter data. Backscatter is a function of the impedance and roughness at the mudline and volumetric scatter below the sediment-water interface. Bathymetric and backscatter data can be imported into visualization software (GIS-style) while offshore, allowing for real-time interpretation. Backscatter anomalies can be examined and the geology interpreted from surface morphology. Figure 2 shows multibeam backscatter in the vicinity of the well-studied Bush Hill chemosynthetic community in the Gulf of Mexico. This data set was shot by TDI-Brooks Intl. and AOA Geophysics Inc. as a calibration data set and is available to the public.
 |
|
Fig. 2. Multibeam echosounder images in the vicinity of the Bush Hill chemosynthetic community. a1, A perspective view of multibeam backscatter and a2, shaded relief. b) Bush Hill calibration data set of Simrad EM 1002 multibeam backscatter at 5-m pixel showing Bush Hill in southeast. c) Inset showing Bush Hill.
|
|
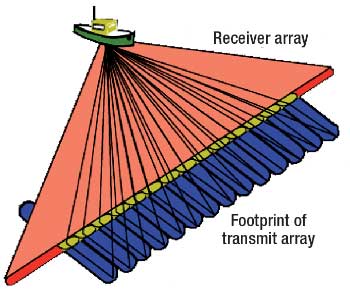
Most multibeam systems are hull-mounted when surveying in water depths greater than 200 m. A multibeam system is basically two acoustic antennae where one antenna transmits and the other receives the sonar energy reflected from the seafloor, Fig. 3. The intersection of the “transmit” and “receive” beams is called the footprint. The beam footprint is a function of beam size, water depth and slant range. Coverage per day depends on water depth, ship speed and the beam footprint. Based on experience, achievable data in water depth up to 2,500 m is a 25-m bathymetric bin size and 5-m backscatter pixel. Necessities for the survey would include a good motion reference unit and regular measurements of water column velocity profiles.
 |
|
Fig. 3. Intersection of the transmitter and receiver arrays on the seafloor (forming a beam, with the arrays hull-mounted on the ship). Multibeam is the term applied to the fan-shaped array of individual beams that maps a swath of the seafloor. By designing the acquisition survey so that adjacent swaths overlap slightly, it is possible to obtain a 100% map of the seafloor bathymetry and backscatter.
|
|
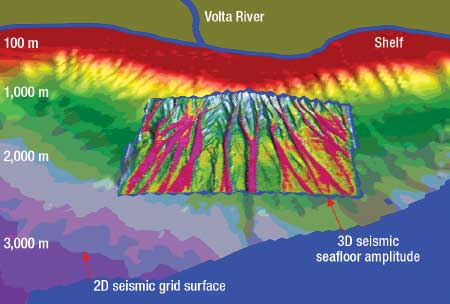
3D seismic data. If 3D seismic data is available over the prospective area, then a precision geochemical survey can yield important information about hydrocarbon prospectivity and aid in basin evaluation. The seafloor morphology and seafloor amplitude data, together with the underlying imaging of the “plumbing” (the three-dimensional fault planes and associated direct hydrocarbon indicators and structures), are used to target and prioritize seafloor coring locations.2 The first return for seafloor horizons can be viewed with visualization software (i.e., GIS-style) for rendering into maps showing bathymetry, amplitude and slope for interpretation and to guide coring locations during coring operations, Fig. 4.
 |
|
Fig. 4. A high-resolution bathymetry grid created from seafloor amplitude of the first return obtained from 3D seismic data, draped on a shaded relief bathymetry map. The regional bathymetric grid is from 2D seismic data. Courtesy of Devon Energy.
|
|
The ground-truthing of high-amplitude seafloor in 3D seismic data has shown these anomalies to be associated with hard shelly sediments and authigenic carbonate. The source of the high amplitudes in 3D seismic data at a seep community is likely to be the authigenic carbonate rather than tubeworms, mussels and clams themselves.3 Whether the 3D amplitude anomalies would be as successful at identifying the location of the macrofauna if no authigenic carbonate were present is debatable, Fig. 5.
 |
|
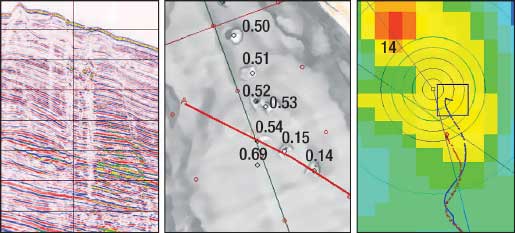
Fig. 5. A vertical section from an arbitrary line through 3D seismic data (left), a seafloor dip map of the 3D seismic data accentuating relief (center) and seafloor amplitude (12.5-m pixel; right). The seafloor map shows pockmarks associated with interpreted gas chimneys and shallow bright spots. Real-time tracking of the vessel position (blue dots) and piston core (red dots) relative to the seafloor basemap ensures accurate and precise seafloor sampling. Courtesy of Devon Energy.
|
|
Multibeam echosound vs. seismic. With exploration 3D seismic data, the equivalent data type to backscatter is the amplitude of the seafloor reflector (a function of impedance). In 3D seismic data, the amplitude bin is the same size as the final processed bin, typically 12.5 m by 20 m. In contrast, backscatter from deepwater multibeam can be subsampled to a 5-m pixel from a 25-m bathymetric bin. The improved backscatter acquisition of multibeam surveys is very important since backscatter is key to seep-hunting, Fig. 6.4,5
 |
|
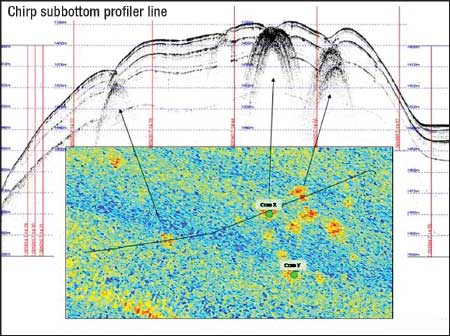
Fig. 6. Diffractions on the sub-bottom profile correspond to seafloor hardgrounds imaged as areas of anomalously high backscatter in the multibeam data, Makassar Strait, Indonesia. Red/orange colors are high backscatter associated with seepage. Data courtesy UNOCAL and AOA Geophysics Inc.
|
|
Multibeam operations with sub-bottom profiler acquisition can be more straightforward than 3D acquisition, especially in regions where a seismic streamer might be fouled by buoys or shoals. Costs are considerably less. At about US $100/km2, acquiring multibeam data is roughly ten times cheaper than 3D acquisition. Of course, 3D data is acquired to image reservoirs, not seafloor seeps, but a multibeam echosounder survey can help locate where to shoot a 3D survey.
There are also additional benefits of acquiring multibeam data, most significantly the ability to obtain a 100% map of the seafloor bathymetry and backscatter. Collected data is available for facilities planning. A geotechnical assessment can start with exploration. Both backscatter and subbottom data can be used to define sediment/soil provinces and target geotechnical investigation. Gravity and magnetometer data can be collected in conjunction with the multibeam survey as well. All of these benefits equate to time and cost saving for future development.
SAMPLING SEEPS
To optimize costly ship time, it is preferable to select and prioritize core targets before sampling operations begin. Piston or gravity-coring uses Ultra Short Base Line (USBL) navigation to monitor the core barrel (and vessel) in real-time and to allow for location adjustment if necessary, Fig. 7. Acoustic navigation is important because core barrels do not drop vertically and real-time acoustic positioning allows for accurate and precise seafloor sampling. This has led to dramatically improved success rates being reported in proving hydrocarbon prospectivity assessments within a tight budget. Money per core can be in the $1,000s; providing navigation adds only 10% or so to this, and purely from the uncertainty reduction about where precisely the core attempt was located, this additional cost provides added value to the coring operation.
 |
|
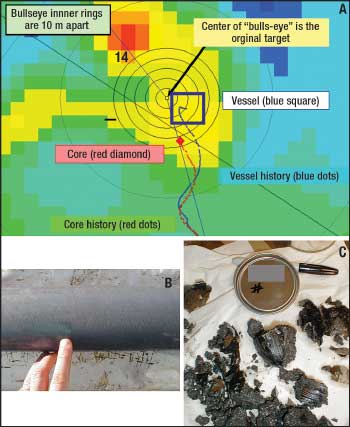
Fig. 7. (a) USBL positioning and GIS are used to navigate the core in real time into the seafloor close to the desired target area. A successful hit on a seep may be immediately recognizable as extensive gas parting in the core (b) and in the ~70 cm of recovered authigenic carbonate and chemosynthetic bivalve shell pieces (c).
|
|
The core is immediately evaluated when it arrives on deck. This information, along with the sub-bottom (2D, 3D or Chirp) and seafloor (3D or multibeam) data, allows the revision of locations at sea and in near-realtime to improve recovery and targeting. After the initial evaluation, the core is subsampled and preserved for shipboard and/or shore-based geochemical analyses. A shipboard analysis program is inexpensive, takes up very little desktop space, and most importantly can be conducted rapidly with results available while the survey is underway. Oil and gas operators can add simple protocols to otherwise routine geotechnical operations to help predict the potential for chemosynthesis in methane- and sulfide-rich seeps.
Geochemical analysis of marine sediment for frontier oil and gas exploration is well-known in the oil industry.6,7 Subsampling offshore for later geochemical analysis requires cores to be sectioned onboard the vessel, with sections selected for geochemical analysis extruded into waiting sample containers (headspace gas cans, plastic bags, etc.). Offshore subsampling should include basic core descriptions, and personnel should be familiar with chemosynthetic fauna and able to recognize gas, oil and/or hydrate-prone cores. The presence of any of these should lead to a modification or augmentation to the standard subsampling protocol.
In our experience, the presence of distinct layers of chemosynthetic shell material within a core can be easily overlooked, and shell material may not be visible through the transparent core liner. There are two options for proper core descriptions. The first, which is more time-intensive and more expensive, is post-cruise computerized tomography scans of core sections that have been archived offshore. A less expensive real-time method is direct observation of core material by splitting the liner and describing the core remaining after the geochemical sub-sampling. Examination of the remaining core material can provide valuable information both on the history of seepage at a site, and the variability of the sediment.
Offshore core geochemical analysis routinely performed by academic research programs is rarely performed for the oil industry. To analyze a core offshore, cores can be sectioned and/or split, and sampled immediately after arrival onboard the ship. Samples of sediment are squeezed or centrifuged to separate pore water8 and analyzed onboard by protocols that are routine on many research expeditions.9,10
Hydrocarbon gases are typically analyzed with a Gas Chromatograph (GC) using a flame ionization detector and/or a thermal conductivity detector. Sediment samples are collected and heated, and then the headspace gas mixture is directly injected into a GC for rapid but non-quantitative measurements.11 Refined gas analysis involves the addition of NaOH or a similar reagent to strip the sorbed gases from a known volume (or mass) of sediment grains before injection into a GC.12 Isotopic measurements are often extremely useful for determining whether a hydrocarbon is of thermogenic or biogenic origin, but these analyses are fairly difficult to perform at sea and researchers tend to rely on shore-based spectrometric analyses.
Alternatively, all core samples can be stored without difficulty using appropriate sampling techniques and analyzed onshore at a later date, if that better fits the requirements of the survey. Geochemical subsampling of cores for later shoreside analysis is relatively straightforward, but has the disadvantage that geochemical anomalies suggestive of seepage will not be known until after the cruise has demobilized.
Methane analysis can be conducted rapidly, economically, and reliably while at sea, but determining the origin of the methane, either biogenic (microbial and near-surface) or thermogenic, involves understanding the relationship among various geochemical and geological parameters in the system.13
DISCUSSION
The authors have been involved in the design and acquisition of numerous dedicated industry surveys for frontier oil and gas exploration with the objective of finding and sampling seeps and vents. Surveys have been conducted over areas as large as 400,000 km2, with as many as 1,500 cores acquired per survey. These surveys use modern multibeam echosounder and 2D seismic data supported by geochemical gravity or piston coring. The authors have carried out seafloor mapping and geochemical surveys around the world, including offshore India, Indonesia, Brazil, Trinidad, Barbados, the western Mediterranean, northwest Africa, the Porcupine Basin offshore Ireland, the East Pacific Rise offshore Chile, the Juan de Fuca region offshore the Pacific Northwest, the Izu-Bonin-Mariana region, and offshore Hawaii. While these data remain proprietary, we can summarize the following observations:
- Co-registered multibeam bathymetry and backscatter can image targets that may be related to seepage.
- Real-time USBL navigation of a core during descent in the context of available seafloor data ensures that the core samples the anomaly or feature of interest.
- Many potential seep targets yield anomalous geochemistry that provides information on the petroleum system (“live” oil and gas). Such data can provide valuable insight into source, maturity, migration and charge.
- Numerous “live” chemosynthetic communities of variable macrofaunal species and distribution have been sampled in frontier basins with piston cores. Follow-up coring with box cores, again utilizing USBL positioning, has successfully captured large amounts of macrofaunal material.
- These high-backscatter anomalies potentially related to seeps may be differentiated, with experience, from other causes of backscatter anomalies such as geometric, sedimentary and volumetric anomalies.
- Numerous anomalous backscatter features yield anomalous geochemistry related to fluid/hydrocarbon expulsion, but no “live” seafloor chemosynthetic fauna. Many cores, however, include shell-rich horizons indicative of periods of chemo-synthetic communities at one or more layers within the core. Although active chemosynthetics may not be present at these locations, the presence of chemosynthetics in the sample suggests that active chemosynthetics may be present on the same feature, and that soil conditions will have a high degree of variability.
- Not all anomalous geochemistry cores contain evidence of chemosynthetic communities, past or present.
- Almost all anomalous geochemistry cores had anomalous backscatter associated with them, but a large percentage show no bathymetric anomaly.
- Subbottom profiles run across these anomalies prior to sampling by piston cores can be used to identify the 2D structure of the anomalies, including the presence and extent of authigenic carbonate that can be used to modify core target locations to ensure representative and productive placement of cores.
- All seep sites with chemosynthetic communities are characterized by diagnostic geochemical gradients.
Deepwater oil and gas operators are now beginning to appreciate the benefits of the modern manifestation of the old technique of seep-hunting as part of their risk-reduction strategy. The relatively inexpensive techniques used can reduce significantly the risk of investing in frontier basins. The side benefits of being able to characterize foundation zone conditions and seabed topography that these investigations provide are also seen as a significant benefit to frontier basin development. 
LITERATURE CITED
1 MacDonald, I. R., ed., “Stability and change in Gulf of Mexico chemosynthetic communities,” Volume II Technical Report, OCS Study MMS 2002-036, US Department of the Interior, New Orleans, La., 2002.
2 Sager, W. W., MacDonald, I. R. and R. Hou, “Geophysical signatures of mud mounds at hydrocarbon seeps on the Louisiana continental slope, northern Gulf of Mexico,” Marine Geology, 198, 2003, pp. 97-132.
3 Roberts, H. H., “Surface amplitude data: 3-D seismic for interpretation of seafloor geology (Louisiana Slope),” Transactions of the Gulf Coast Association of Geological Societies, 46, 1996, pp. 353-362.
4 Decker, J., Teas, P. A., Curiale, J. A., Johnson, E. A. E. and D. L. Orange, “Multibeam exploration in the Makassar Strait,” Indonesia Petroleum Association paper, DFE04-0R-043, 2004.
5 Orange, D. L., Yun, J., Maher, N., Barry, J. and H. G. Greene, “Tracking California seafloor seeps with bathymetry, backscatter and ROV,” Continental Shelf Research, 22, 2002, pp. 2273-2290.
6 Brooks, J. M., Kennicutt II, M. C., Fay, R. R., McDonald, T. J. and R. Sassen, “Thermogenic gas hydrates in the Gulf of Mexico,” Science, 223, 1984, pp. 696-698.
7 Brooks, J. M., Kennicutt II, M. C., Fisher, C. R., Macko, S. A., Cole, K., Childress, J. J., Bidigare, R. R. and R. D. Vetter, “Deep-sea hydrocarbon seep communities: evidence for energy and nutritional carbon sources,” Science, 238, 1987, pp. 1138-1142.
8 Manheim, F. T. and F. L. Sayles, “Composition and origin of interstitial waters of marine sediments, based on deep sea drill cores,” in Goldberg, E., ed., The Sea, 2nd ed., 1974, pp. 527-568.
9 Gieskes, J. M., Gamo, T. and H. Brumsack, “Chemical methods for interstitial water analysis aboard JOIDES Resolution,” ODP Tech. Note, 15, 1991, http://www-odp.tamu.edu/publications/tnotes/tn15/INDEX.HTM, accessed Jan. 23, 2002.
10 Mottl, M. J., Wheat, C. G., Fryer, P., Gharib, J. and J. B. Martin, “Chemistry of springs across the Mariana forearc shows progressive devolatilization of the subducting slab,” Geochim. Cosmochim. Acta, 68, 2004, pp. 4915-4933.
11 Kvenvolden, K. A., and T. J. McDonald, “Organic geochemistry on the JOIDES Resolution: an essay,” Ocean Drilling Program Technical Note, 6, 1986.
12 Iversen, N. and B. B. Jørgensen, “Anaerobic methane oxidation rates at the sulfate-methane transition in marine sediments from Kattegat and Skagerrak (Denmark),” Limnology and Oceanography, 30, 1985, pp. 944-955.
13 Gharib, J., Sansone, F. J, Resing, J. A., Baker, E. T., Lupton, J. E. and G. J. Massoth, “Methane dynamics in hydrothermal plumes over a superfast spreading center: East Pacific Rise, 27.5-32.3°S,” Journal of Geophysical Research, 110, 2005, DOI:10.1029/2004JB003531.
|
THE AUTHORS
|
|
|
Dan McConnell is vice president of AOA Geophysics Inc. He is a marine geologist with degrees from the University of Texas at Austin specializing in seafloor mapping, engineering geology and drilling hazard assessments. He advises and works on US Department of Energy efforts to identify and characterize gas hydrate deposits.
|
|
|
|
Jamshid “Jim” Gharib is a marine geochemist at AOA Geophysics Inc. He earned his BS in geological sciences from the University of Texas at Austin in 1994, his MS in oceanography in 2000 and PhD in geology and geophysics in 2006, both from the University of Hawaii. His research interests include the geochemistry of water-rock and water-sediment interactions, especially in relation with cold seeps, hydrothermal vents and submarine volcanism.
|
|
| |
Jennifer Henderson is a marine geoscientist and GIS specialist with AOA Geophysics Inc. Her work focuses on assessing geohazards and planning and executing seafloor mapping surveys. She earned a BS in geological engineering from the University of Mississippi (2001) and an MS in ocean engineering from the University of Rhode Island (2004).
|
|
| |
Hunter-West Anderson Danque earned a BS in geosciences (geophysics option) in 2003 and completed his master’s research in 2007, both at the University of Texas at Austin. He was hired as a geophysicist with AOA Geophysics Inc., specializing in marine geohazards. Since joining AOA, he has worked on multibeam and coring vessels offshore Indonesia.
|
|
| |
Adrian Digby, director of business development with AOA Geophysics Inc, joined following a year working on an exploration seep survey of frontier basins in Indonesia. He is a chartered engineer and geologist with a BSc in geology from Nottingham University (1974). He formed a wireline logging company in 1990, which was subsequently taken over by Fugro Ltd., and continued to work with them for 10 years developing logging systems and running their geohazard department.
|
|
|
|
Dan Orange is vice president of operations for Black Gold Energy, shown holding a chemosynthetic clam. He earned a BS and MS from MIT in 1985 and a PhD in earth sciences in 1991 from the University of California Santa Cruz. His early academic work combined seafloor mapping and 2D seismic both to find seafloor seeps and to interpret their driving mechanisms. At AOA Geophysics, Dr. Orange and his team applied seep science to hydrocarbon exploration and used process geomorphology to evaluate deepwater geohazards.
|
|
|


