LWD/FORMATION TESTING
Successful identification of depleted sands using formation testing while drilling
The method proved a safe and effective alternative to wireline testers for some applications.
Mark Proett and Peter Kowalchuk, Halliburton; Yau-Wai Loo, Charles F. Tucker and Paul Connell, Brunei Shell Petroleum
In the last two years, Formation Testing While Drilling (FTWD) tools have emerged as an alternative to Wireline Formation Testers (WFTs) in different applications. The latest generation of FTWD tools uses a probe-packer design, similar to conventional wireline formation testers. These tools are deployed on the drillstring and can be used during the drilling process. For example, pressure tests can be taken shortly after a zone has been drilled or while tripping out of the hole after reaching target depth. Acquiring a pressure test with the latest generation of FTWD tools requires that the drillstring be stationary for about 10�15 minutes in either a circulating or non-circulating mode.
The operator used an FTWD tool on a highly deviated well in Brunei to identify hydraulic conductivity between producing zones and two nearby aquifers. Data from other sands, which were of interest because they were thought to be depleted, was also acquired. Because of the deviated well profile, using a traditional, drill pipe-conveyed WFT would have been unacceptably costly, Fig. 1. Furthermore, the well plan placed the casing shoe too high in the hole for a sidewall-entry sub to be deployed. This placement made use of a drill pipe-conveyed WFT impossible for the desired depth without introducing a complicating change to the well plan. Running an FTWD tool on the drillstring required no casing or hole size change and would be much more cost-effective.
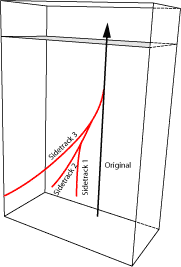 |
Fig. 1. The well being drilled was the third sidetrack of an original hole. The well path did not have a high inclination, but it did have a sharp, 90° turn in azimuth while building angle, which created a path that models showed to be unsuitable for a wireline run.
|
|
Communication with the FTWD was established using mud pulse telemetry. A surface pulser skid was used to send commands to the formation tester to start the test sequence. The test data was transmitted uphole using the downhole mud pulser, and was relayed directly to the office onshore. The results from all pre-tests could be presented in real time.
Field data had been acquired before reaching total depth, and more pressure points were taken afterward while tripping out of the hole. Data points taken in a zone of high interest were also repeated while coming out of the hole.
BACKGROUND
Formation testers have been used for years. In 2002�2003, services companies introduced probe-type Logging While Drilling (LWD) tools, which resemble the more common formation testing tools being deployed on wireline and pipe-conveyed logging operations.
Formation Testing While Drilling (FTWD) tools open new opportunities. Acquiring data in environments and conditions that previously were considered too risky or not economically viable may now be possible thanks to drillstring-deployed formation pressure testers.
On a particular field in Southeast Asia, an operator planned to drill a development well in a well-known field. Certain sands being produced by other wells would be drilled, but would not represent completion targets. The operator had some understanding of the pressure in these sands, coming mainly from wireline-deployed formation tester data and production data from other wells in the field. Having a more accurate picture of the pressures would greatly improve production. Running a formation tester in the well would help the operator to better understand whether certain faults served as interconnects between different sands, and whether or not more wells were needed in the field�i.e., how the field was being depleted and how best to produce it.
The challenge of running a formation tester in this well was both technical and financial. One major technical hurdle was the well trajectory. This is a 3D well, and early analysis provided by the wireline company revealed that the well could not be logged using conventional wireline methods. Instead, pipe-conveyed logging operations were recommended. Also, since the casing shoe was shallow compared with the well’s total depth, a continuous log for the openhole section would require more than one latch for the pipe-conveyed tools.
Swelling shale was expected�and encountered�a few hundred meters below the shoe, further complicating a wireline tool run, and particularly a pipe-conveyed wireline tool run. This swelling was to be controlled by modifying the mud properties, but the lack of continuous circulation could still produce swelling, which might lead to a stuck pipe.
Since obtaining pressure data was not critical in this well and wouldn’t affect its outcome (i.e., this information would only serve to better understand the reservoir and future wells), the operator did not budget to obtain the pressure data. Furthermore, deploying tools on wireline would be technically unachievable, or risky at best, and pipe deployment would require several days of rig time, increasing the cost. Deploying a formation pressure tester on the drillstring seemed the best alternative.
TESTER SELECTION
The FTWD tool selected was Halliburton’s Sperry Drilling Services 6¾-in. GeoTap, Fig. 2. This tool is also available in 4¾-in. and 8-in. sizes.
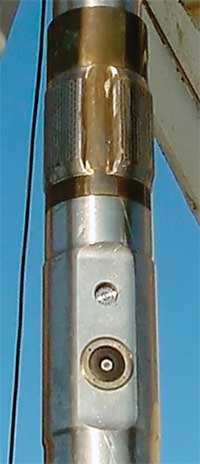 |
Fig. 2. The GeoTap formation-testing-while-drilling tool.
|
|
The tool uses a probe-and-snorkel assembly, making it resemble the more common probe-type formation tester used in wireline operations. The “snorkel” is designed to puncture the mudcake to achieve better communication with the formation to be pressure tested.
In this operation, the tool was configured to perform a single drawdown and buildup test. However, the tool is capable of producing single, double and triple drawdowns per pad setting, with variable rates of 0.2�1.5 cm3/sec and volumes of up to 30 cm3. Other sizes of the tool have different rate and volume ranges.
Real-time data delivery. The typical speed and quantity of data that can be transmitted practically using a mud-pulse system from an LWD tool to surface is quite small compared with a typical wireline logging system. In LWD operations, it is possible to transmit a series of pressure readings using mud pulses, Fig. 3. But due to a reduced bandwidth (i.e. low transmission speeds), it may take a long time to obtain enough information to describe the pressure curve by relying on the mud-pulsed pressure data alone. For this reason, a detailed pressure curve is not a practical real-time solution.
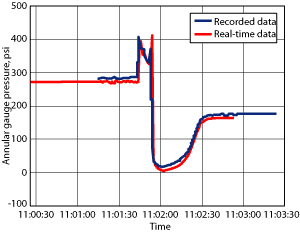 |
Fig. 3. Recorded data retrieved after a typical run from the tool’s memory is plotted along with real-time data available while the tool was in the hole. Real-time data here constitutes pressure samples every 1 sec. Other sample rates are available.
|
|
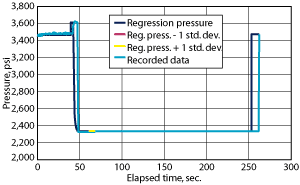
To make real-time data practical, and still suitable for quality analysis, the FTWD tool uses Halliburton’s EXACT downhole analysis method to transmit a limited set of parameters to the surface, which enables the reconstruction of the drawdown and buildup pressure curves. This method also allows for the calculation of mobilities (defined as permeability divided by viscosity) and determination of the final pressure measurement’s stability. The method employs five pressure measurements, two time measurements and three parameters to conduct this reconstruction of the data, Fig. 4.
 |
Fig. 4. Pressures, time measurements and coefficients are transmitted to surface in real time to reconstruct the pressure drawdown and buildup signals.
|
|
Pressure sampling with the FTWD tool, or any other formation testing tool, can be taken either before or after reaching the section TD. Either way, there are advantages and disadvantages to consider. If sampling is done before reaching TD, the data is taken earlier, and can be used for drilling, but there is a higher chance of supercharging because the mudcake may not be fully developed, so more time must be taken per pre-test sample.1 Pressure testing after reaching the section TD�i.e. while coming out of the hole�allows the additional time for the mudcake to form, reducing the chance of supercharging, and requires less time for the pre-test sample. However, the data is taken later in the operation, reducing its usefulness for drilling decisions.
LOGGING OBJECTIVES
The well that was being drilled lies between two existing wells (Well A to the west and Well B to the east) with a trajectory designed to penetrate zones being produced by these two wells. Obtaining pressure information would confirm or deny the current drainage regime and also would provide information about communication between sands, which were unknown due to the lack of pressure data in the field and the complicating fact that two faults were present, which may or may not provide communication between sands.
Eight sands were to be intersected in the main section of this well. Some of these had been produced by Wells A and B. Some were also believed to be in direct contact with the two faults. Using available information, the operators categorized the sands before running the FTWD tool as:
- Sand 1�no depletion
- Sand 2�no depletion
- Sand 3�probable pressure communication with Sand 4
- Sand 4�depletion due to production from Well A
- Sand 5�probable pressure communication with Sand 4
- Sand 6�depletion due to production from Well A and Well B
- Sand 7�depletion due to communication with Sand 6
- Sand 8�small depletion due to production of Well B.
Tool deployment alternatives. Three tool deployment alternatives were originally considered: wireline, pipe conveyed wireline tool and LWD. The well had a maximum inclination of 57°�usually low enough for wire deployment�but the azimuth swings from 260° to 195° and back to 270°, constituting a sharp turn that, according to models, would make wireline impossible to run in the well. An openhole section of about 1,500 m induced a high risk of a stuck pipe. Also, the well was originally designed with a maximum dogleg of 1.25°/10 m. To reduce drag, a sharper drop after kickoff is required (2°/10 m dogleg), which is not advisable with a rotary steerable system, so a Positive Displacement Motor (PDM) would have to be employed.
To deploy a pipe-conveyed wireline tool would require about two days of additional rig time, and any other OH log added to the formation tester run would require more than one latch. On the other hand, LWD only required adding the FTWD tool onto the MWD drilling system, and the pressure test could only be taken after reaching TD and conditioning of the hole.
Dangers common to all three methods were an expected 7,500-kPa (~1,000-psi) overbalance differential pressure and an expected shallow swelling shale, where KCl mud additives were to be used and which would require periodic conditioning.
Because of these difficulties and risks it was decided that running the FTWD tool was the safest and probably the only viable alternative. It was also decided that due to the risk in this well, all pressure tests would be taken with the pumps on�i.e. circulating mud while taking the pre-tests. Also, the desired pressure points would be taken while pulling out of the hole. It was later decided to take a few points while still drilling the hole as a data backup in case the tool became stuck. These points would be taken again while pulling out of the hole as a quality check.
Pressure test tool settings. Considering that the formation’s permeability was expected to be on the order of 100 mD or less, it was decided to run the tool with a rate of 0.5 cm3/sec., a volume of 10 cm3 and a buildup time of 192 sec. At the time this logging job was performed, the only parameter that could be changed after the tool was below rotary was the rate, which could be either 0.5 cm3/sec. or 1 cm3/sec.
REAL-TIME PRESSURE DATA
The first pressure test was taken in Sand 5, Fig. 5. This test obtained a very small drawdown�much smaller than what was modeled before running the tool. This implied that the formations in question possess much higher permeability and mobility than previously expected. Although the FTWD tool’s software is capable of calculating mobility in real time, it was not able to resolve a value for the data obtained, because the drawdown differential below the formation pressure was very small. The EXACT method used to calculate mobilities with the tool requires a drawdown of about 5�10 psi to obtain an accurate solution for the mobility. This is because the resolution of the real-time drawdown pressure is in the same range, making it impossible to determine the mobility in real time with accuracy. However, the final test pressure’s real-time resolution can be as high as 0.1 psi, which can enable pressure gradient analysis.
|
Fig. 5. Real-time results of the first pressure test taken in Sand 5 while drilling, with superimposed recorded data that became available after the drilling and logging operation.
|
|
PRESSURE DATA ANALYSIS
When analyzing the final data, the set of samples can be reviewed in two separate groups: samples taken while drilling and samples taken after the well reached TD. These data sets should be considered separately, because they were acquired under different conditions.
Samples taken while drilling are more likely to be affected by supercharging where the mudcake is not fully formed, resulting in a pressure measurement that is somewhere between formation pressure and the well’s hydrostatic pressure. This is because the pressure samples were taken relatively shortly after the formation was drilled, so the mudcake might not be sufficiently developed to isolate the wellbore pressure from the formation sandface. The amount of supercharging is also a function of the formation’s permeability. The lower the formation permeability is, the more likely it is for supercharging to occur. In this case, due to the high mobilities encountered, and considering all tests were taken at least 40 min. after drilling the formation, supercharging was ruled out. Also, none of the pressure tests taken showed any of the common indicators of supercharging, such as a steady decrease of pressure after the initial buildup stage. Also, MWD mud pulses can sometimes be seen on both the stabilized buildup portion of the pressure test and on the hydrostatic portion, in which case a large ratio of these two signals, respectively, suggests a mudcake integrity high enough to isolate supercharging. This indicator was evident in all the pressure tests taken.
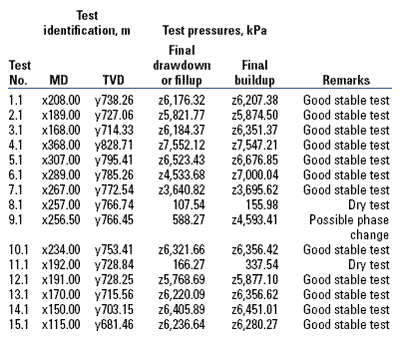
For samples taken after the well reached TD, the main concern was mudcake breaching. As explained above, measuring formation pressure requires that the drawdown reach pressures lower than the formation pressure in order to penetrate the mudcake. This can be clearly established if the drawdown is large and a buildup is obvious. However, on this job, a large drawdown was not possible. Although the real-time data did not show good indications of a drawdown below the formation pressure, recorded data did show that a drawdown with a steady buildup occurred, indicating that the data was in fact valid. The final confirmation of the acquired data’s validity consisted in using the data within the context of what was expected in the known sands and correlating these pressures to the reservoir being analyzed. All tests taken while drilling where re-taken while coming out of the hole, showing the same results to within fractions of a psi, further verifying the validity of the data, Table 1.
| TABLE 1. Pressure test summary |
 |
|
Final data analysis. The data acquired gave the reservoir engineers a much better idea of the dynamics of the formation under study, Fig. 6. In summary, no depletion was found in Sand 2, as expected; depletion was found in Sand 3, and communication with Sand 4 via a fault in the reservoir was confirmed; depletion in Sand 4 was less than expected; depletion in Sand 5 confirmed previous data; Sand 6 was depleting as expected; depletion in Sand 7 was lower than expected but still confirmed communication with Sand 6; and Sand 8 showed a small depletion, which is probably due to one of the other two wells considered in the analysis.
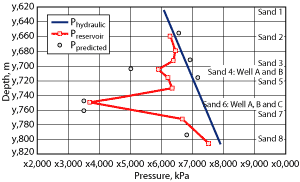 |
Fig. 6. Real-time depletion data plotted with predicted depletion data.
|
|
CONCLUSIONS
The test showed FTWD to be a cost-effective and safe alternative to wireline formation testers for some applications. The FTWD tool’s accuracy is well-suited to determine levels of depletions in certain sands. Though the tool produced limited real-time data, that data was sufficient to determine sand depletion. It is recommended that triple drawdowns, faster rates and larger volumes be used to test mobilities greater than about 500 mD/cP in future logging runs using the tool in this field. 
LITERATURE CITED
1 Proett, M., Fogal, J., Welshans, D. and C. Gray, “Formation pressure testing in the dynamic drilling environment,” IADC/SPE 87090 presented at IADC/SPE Drilling Conference, Dallas, March 2�4, 2004.
|
THE AUTHORS
|
|
Mark A. Proett is a senior scientific adviser in Strategic Research for Halliburton Energy Services. He earned a BS degree in mechanical engineering from the University of Maryland and an MS degree from Johns Hopkins. He has been involved in developing formation-testing systems since the early 1980s. Mr. Proett holds 33 patents primarily dealing with well testing and fluid flow analysis. He has served on the SPWLA and SPE technical committees and served as chairman for the SPE Pressure Transient Testing Committee. He also served as an SPWLA distinguished speaker and as vice president (north side) of the Houston Chapter of SPWLA in 2005. He is a distinguished lecturer for SPE in 2006�2007.
|
|
| |
Peter Kowalchuk is LWD coordinator for Halliburton Sperry Drilling Services in Brunei Darussalam. He started his career as an LWD field engineer and later worked as a wireline field engineer. He has 11 years’ experience in the industry, nine of them at Sperry Drilling Services. He has held several positions in operations, technical support and product development, in Venezuela, Argentina, the US and several Asia-Pacific locations. Peter holds a BS degree in electronic engineering and is a member of SPE and IEEE.
|
|
| |
Loo Yau Wai received a first-class honors degree in electrical and electronic engineering from the University of Glasgow, UK. He joined Shell in 2002 as a petrophysicist and has worked in a variety of development and exploration projects in Brunei.
|
|
| |
Charles F. Tucker IV earned BS and MS degrees in petroleum engineering from Louisiana State University, Baton Rouge. He joined Shell in 1997 as a petrophysicist and has worked production and exploration projects in the deepwater Gulf of Mexico, central Thailand and Brunei Darussalam.
|
|
| |
Paul Connell is a reservoir engineer working with Brunei Shell Petroleum. He earned a bachelor of applied science degree from Swinburne University and a master of oil and gas engineering degree from the University of Western Australia. He has held petroleum and reservoir engineering responsibilities across exploration, development and operating assets in the Gippsland basin, Timor Sea, Bonaparte basin, Cooper basin, Taranaki basin and Baram Delta.
|
|
|


