Geophysical imaging technology provides insight on EOR practices
To optimize oil production, two technologies monitor fluid movement.
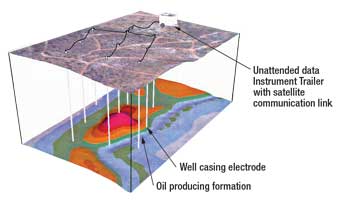
REAL-WORLD TECHNOLOGY TESTSGeophysical imaging technology provides insight on EOR practicesTwo technologies monitor fluid movement to optimize oil production.Brian Black, Lyle Johnson, and Mandy Cepeda, Rocky Mountain Oilfield Testing Center Various enhanced oil recovery (EOR) techniques have been pursued at Naval Petroleum Reserve No. 3 (NPR-3) since before the Rocky Mountain Oilfield Testing Center (RMOTC) was created on the site by the Department of Energy in 1994. NPR-3 is situated north of Casper, Wyoming, in the Powder River basin on the Teapot Dome anticline. It has over 600 active wells producing oil and gas from several different geologic formations at depths ranging from 500 ft to 5,000 ft. Recently, RMOTC partnered with two testing companies to analyze the results of waterfloods and modify the programs going forward. They conducted tests using their technologies to monitor fluid movement in the Shannon Sandstone. Information obtained from these surveys facilitates the understanding of how waterflood practices are likely to influence oil production, and how the reservoir may be managed and monitored to optimize oil production. Having an accurate, cost-effective means to understand the effects of waterflood and steam injection practices can reduce costs of directing the injected fluids, ultimately increasing revenues for the industry as a whole. BACKGROUND The Shannon reservoir, a member of the Cretaceous Steele Shale Formation, is approximately 120 ft thick, with the top located 500 ft below ground surface. It represents one of several pulses of offshore shelf sand deposition that occurred during the Late Cretaceous period. EOR techniques have been employed within the Shannon Sandstone at NPR-3 to try and improve oil recovery rates in the past, including cycling operations where surfactant is injected into the well, fireflooding, waterflooding and steamflooding. TECHNOLOGY TEST 1 In 2006, hydroGEOPHYSICS, Inc. (HGI) and RMOTC jointly conducted a test of the company’s High Resolution Resistivity (HRR) subsurface fluid monitoring technology. The technology is a non-intrusive measurement method which monitors fluid movement during water and surfactant flooding. The purpose of the test was to demonstrate that the technology was capable of tracking fluid movement, including water, surfactant and oil, as a result of EOR floods. While the technology has already succeeded in near surface applications, this test showed its applicability to deeper formations typically encountered in EOR. The technology is based on a time series analysis of a direct-current electrical geophysical method, relying on contrasts in electrical properties between the formation and the injected fluid. The test was expected to be challenging due to the very minor contrasts in electrical properties between the Shannon and the injected fluid. The technology is easily deployed in a variety of settings, making it an attractive option for use in the oil field. It observes the changes in electrical properties during the injection and the movement of water, steam, oil, carbon dioxide, surfactants or any other subsurface fluids. It is non-intrusive since the monitoring system uses existing well casing as electrodes, and it is controlled by an on-site remotely operated Instrument Trailer (IT). Incorporating existing site infrastructure greatly reduces set-up costs, Fig. 1.
Data Collection. Once the technology was deployed at NPR-3, geophysical data was acquired remotely for 18 weeks. The geophysical monitoring was accomplished by measuring the electrical potential between a series of 22 well casings using DC resistivity in a pole-pole array configuration. Approximately 50,000 ft of insulated electrical wire were used to connect the IT to the 22 wells and two remote transmitters, installed approximately 8,000 ft from the trailer. The measurement strategy incorporated the general philosophy of tomography, where one well was used to transmit current while the remaining wells measured the voltage. A measurement cycle was complete after each well had a turn at current transmission, allowing the subsurface to be viewed from all angles. Two of the geophysical monitoring wells were used to inject water and water/surfactant for the EOR test, four geophysical monitoring wells were production wells, and the remaining 16 geophysical monitoring wells were not actively used for the EOR flooding, Fig 2.
The first series of injections started in June 2006 and included four weeks of waterflooding, with 70 bbls water per injection. The geophysical monitoring was conducted during injection of a dilute (1.5%) surfactant in the subsequent nine weeks, followed by another five weeks of waterflooding. The trailer housed the remote communication system, allowing all of the hardware components to be accessed and controlled through a Virtual Private Network (VPN) connection hosted over satellite. The 30-channel field data acquisition system gathered data almost continually, 24 hours a day with an eight-minute sampling rate. Data was digitally sampled at intervals to create a time-series of electrical measurements. Then, by quantifying changes in the time-series electrical data, the technology evaluated fluid movement. Results. The water and surfactant flooding caused an improvement in oil production in two of the wells, but the gain was insignificant compared to the amount of water injected. Analysis of the data showed little change in production character (i.e. flow around wells) either during the surfactant injection period or shortly thereafter, suggesting that the surfactant flood had negligible impact on the hydrogeologic environment. Despite this, the monitoring system had sufficient sensitivity to identify subtle changes in spatial and temporal fluid flow characteristics and migration direction. The test proved the technology can function during active oil production with minimal intrusion in the daily oilfield operations. Also, the data suggests an explanation for the poor performance of the surfactant test. Because electrical recovery data nearly returned to pre-injection levels after the surfactant flooding, it was apparent that an insufficient volume of water was used. Additionally, the test indicates hydraulic characteristics of the target reservoir, and HRR electrical recovery time can be used to estimate oil well hydraulic recovery time. Figure 3 shows the rapid recovery time for well 65SX (one hour). This indicates that the well is in a highly conductive region where the surfactant had little time to react with the environment to release oil. The well is also near the south boundary fault, which likely caused fluids to migrate to the fault instead of to the producing wells. Well 63S, which recovered in 10 hours, shows just the opposite and is much more suitable for an EOR injection well. The use of wells in the lower conductive region will allow better contact of the surfactant with areas where higher volumes of residual oil reside. Thus, through the electrical equivalence of a pressure fall-off test, the technology provides a method to evaluate the optimal injection well placement and injection well volume necessary for a successful EOR project.
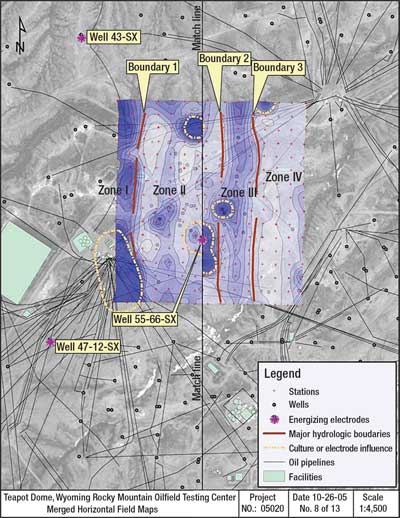
TECHNOLOGY TEST 2 Willowstick Technologies and RMOTC conducted a study using AquaTrack at NPR-3 in August 2005 to map and delineate the concentration and preferential flow paths of water disposal into the Shannon Sandstone during a small-scale waterflood. While the technology had been used before in a number of complex hydrogeologic settings, this project aimed to prove its applicability to subsurface oil reservoirs. The information obtained using this technology can define how waterflood practices are likely to influence oil production and how the reservoir might be managed to optimize oil production. Further, it can efficiently map relative water concentrations and naturally occurring preferential flow paths, or those created from waterflood or steam injection activities. The Process. The overall approach included using a five-spot well pattern with two horizontal dipole antenna/electrode configurations for applying alternating current into the targeted lower Shannon. The test occurred in an area of recent waterflooding activities, between 300 and 400 ft deep. The central well (Well 55-66-SX in Fig. 4) was used to drive electrical current from the central area of the survey to the return electrodes in the surrounding four wells. The electrical current in the subsurface created a magnetic field that was recorded and mapped at the surface using stations in a grid pattern, 30 meters apart. Mapped areas of high concentration in the magnetic field show where water concentrations were the highest in the targeted formation.
The technology utilized a low-voltage, low-amperage audio frequency (50 Hz to 15k Hz) electrical current to energize the formation water, with electrodes placed in strategic locations to facilitate contact with the formation. The induced electrical current follows the best available conductor through the subsurface, concentrating in high water-saturated zones. As the electrical current takes various paths through the area of investigation, it creates a magnetic field characteristic of the injected electrical current. The locations of field measurement stations are identified using a GPS and recorded in a data logger along with the magnetic field readings. That information is processed, contoured and interpreted in conjunction with other data for enhanced definition of the extent of saturation in the study area. Data was collected for 16 days, totaling 320 field measurements, with an additional three weeks for data processing and interpretation. To ensure data quality at each station, a Campbell Scientific CR1000, modified with AquaTrack technology, measured the 400-Hertz magnetic field strength and compared the signal to the background or ambient magnetic field strength at numerous frequencies. This information was compared to predetermined signal quality criteria to establish data quality and repeatability. Also, the data was corrected to account for distance from the source electrode, to reduce effects of antenna interference and to remove effects caused by ambient and shallow subsurface sources. The data was correlated with known geologic and hydrologic information to provide the best possible insight to groundwater location. The data was then used to generate contour maps of the induced magnetic field, showing areas of highest ground water concentration. Results. The survey provided significant information about the oil reservoir beneath the study area by identifying electrically conductive subsurface zones, probable hydrologic flow paths and hydrologic boundaries, which influence waterflood operations as they move through the formation. To confirm the results of the survey, production data was analyzed from wells within the survey area. Merged horizontal field maps show that there is a distinct north-south trend of water concentration. The sharp horizontal resolution defines edges of saturation and vertical hydrologic boundaries in the Shannon. The survey identified four hydrologic zones, representing possible differences in reservoir properties within the formation that influence the way flood water migrates when injected into the formation, Fig. 4. The areas of high electrical conductance (show in dark blue) are interpreted as areas where water likely concentrated in the subsurface formation. The observed hydrologic boundaries directed water flow much like they directed electric current. Zones I and III are the strongest zones of saturation where most of the electrical current concentrates. Zone II consists of both high and low conductive areas that form an interesting pattern similar in appearance to those seen in braided channel river systems. On the east side of Zone III, a hydrologic barrier largely blocks current flow to the east, and in Zone IV to the east, the low conductivity suggests that little if any water saturation exists. The technology demonstrated that it can generate accurate and timely groundwater characterization maps of an oil field from which informative decisions about future waterflood and steam injection practices can be made. The information provided through this technology can help to characterize water or steamflooding operations by better defining subsurface barriers, conductive zones and overall hydrologic structure of the formation analyzed. CONCLUSION For a full report on the tests conducted, or for more information on RMOTC’s test facilities, visit www.rmotc.com.
|
||||||||||||||||||||||||||||||


- Shale technology: Bayesian variable pressure decline-curve analysis for shale gas wells (March 2024)
- What's new in production (February 2024)
- Prices and governmental policies combine to stymie Canadian upstream growth (February 2024)
- U.S. operators reduce activity as crude prices plunge (February 2024)
- U.S. producing gas wells increase despite low prices (February 2024)
- U.S. drilling: More of the same expected (February 2024)
- Applying ultra-deep LWD resistivity technology successfully in a SAGD operation (May 2019)
- Adoption of wireless intelligent completions advances (May 2019)
- Majors double down as takeaway crunch eases (April 2019)
- What’s new in well logging and formation evaluation (April 2019)
- Qualification of a 20,000-psi subsea BOP: A collaborative approach (February 2019)
- ConocoPhillips’ Greg Leveille sees rapid trajectory of technical advancement continuing (February 2019)

