Exploration Technology
Experience is crucial to expanding CSEM use
This new exploration technology should not stand alone, but when used with the rest of the explorationist’s toolkit, CSEM looks very promising.
Dirk Smit and Paul R. Wood, Shell International Exploration and Production
It’s been more than 30 years since the idea of using resistivity measurements for large-scale ocean reconnaissance in exploration was first proposed in academia. In shallow water, electromagnetic energy reaching the sea surface is transmitted through the air and subsequently back through the water, swamping most of the readings coming from the geological targets, so, making sea bed resistivity measurements a commercial business would have to wait until deepwater exploration became commonplace. Obviously, both of these events have now occurred.
Since 2002, over 200 sea bed electromagnetic surveys have been conducted worldwide. Data from only a few of them have been released. Companies that were not part of the original development may have seen only modest proof of the efficacy of the technology. In addition to illustrating the technique, this article presents three examples of Shell’s Sea Bed Logging (SBL) experiences.
BACKGROUND
By the late 1990s, a group of scientists, spurred by independent investigations by Statoil and ExxonMobil, but along similar lines, were seriously considering the commercial utility of sea bed logging. Steven Constable of Scripps Institute is probably the one most responsible for bringing geo-electromagnetic methods into oilfield use, although many others played key roles as well, among them Lucy MacGregor and Martin Sinha from Southampton (now with OHM), and Terje Eidesmo and Svein Ellingsrud from Statoil Research.
In 1999, Statoil and the Norwegian Geotechnical Institute were working on their Controlled Source ElectroMangnetics (CSEM) system, often called Sea Bed Logging (SBL). When Constable was asked for a peer review of SBL by Statoil, he gave it his blessing as a possible direct hydrocarbon indicator tool. In November 2000, collaboration between Scripps Institution of Oceanography, Southampton Oceanography Centre, the Norwegian Geotechnical Institute and Statoil resulted in the first CSEM survey to see if the method could directly detect hydrocarbons in deep water over a known oil field offshore Angola, West Africa. After that success, Ormen Lange gas field offshore Norway was surveyed. A year later, the technology was used to for Shell, Enterprise and Statoil in a pre-lease fashion for an upcoming Norwegian round.
Those surveys were acquired in deep water to minimize the unwanted signal from the air-water interface, Fig. 1. An important survey took place in over the giant Troll gas field offshore Norway, acquired in relatively shallow water (330 m). That survey, which has been published many times, demonstrated a clear anomaly associated with the reservoir, as well as opened the door for surveys in shallower water.
 |
Fig. 1. The EM source is towed along receiver line 10 km before and after first/ last seafloor receiver, giving long offsets. Signal travels along resistive layer.
|
|
Statoil established a company called emgs in February 2002 (which was eventually sold to Warburg Pincus in 2004, an investment group). Shell has been partnering with Statoil since 2001 to further the development in CSEM. Shell contracted emgs to acquire over 40 surveys worldwide in 2004 and 2005.
OPERATING PRINCIPLE
SBL uses a Horizontal Electrical Dipole (HED), which is towed a little above (~30 m) the seafloor by an acquisition vessel. The towfish emits a low-frequency ElectroMagnetic (EM) signal that couples with the surrounding water and then into the underlying seabed and downwards. Some of the signal also goes upward. This “air signal” starts to interfere with the geological signal as the water depth decreases and, if present, must be removed during processing. It is an area of ongoing research and currently limits the SBL technique to a minimum of about 200 m water depth.
Since the upper sediments are effectively partial conductors, the penetration of EM fields is limited by the so-called skin-depth, particularly with high-frequency fields. In practice, this means that a low-frequency EM signal must be generated, typically between 0.25 – 10 Hz,1 to allow penetration to 2,500 – 3,000 m into the subsurface. At low frequencies, the EM field diffuses, leading to strong dispersion. An anomalous resistor will distort the dispersion. Energy is constantly returned back to the seafloor and is detected by dipole receivers placed on the seafloor. Both the amplitude and the phase of the received signal depend on the resistivity structure beneath the seabed.1
The sail line starts at about 10 km before the first receiver and ends about 10 km after the last receiver.2 This ensures that all receivers have active source data with source-receiver offsets of 10 km.
When the source-receiver distance is larger than the reservoir depth, energy from the resistive layer will dominate the directly transmitted energy. Detecting this anomalous dispersion energy is the basis of SBL, Fig. 1.
Archie’s law indicates that the method is more sensitive to high-saturation hydrocarbon-pore fill. Hydrocarbon-filled reservoirs will typically have one to two orders of magnitude higher resistivity than a water-filled reservoir. It will also have a resistivity that is one to two orders of magnitude higher than the surrounding shale or mudrock.2 This, together with the low-frequency signal, means that only relatively large accumulations of high-saturation are detectable, which is a considerable benefit.
With such low-frequency sources, the 3D interpretation of the data is complex. Different responses may be recorded from reservoirs at different depths, and with different parameters, such as thickness or hydrocarbon saturation. Bodies such as salt or volcanic sills may also give anomalous readings. Since SBL gives a single answer across a large section of the subsurface, the answer must be constrained to narrow the number of possible subsurface conditions that could produce the response. Such constraint can come from seismic data, potential fields data, basin analysis, well data, pore fluid saturation and good geologic sense. Thus, SBL requires robust and advanced 3D forward modeling.
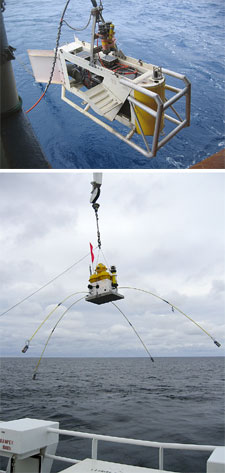 |
Fig. 2. Deploying source and receivers. Red flag aids in retrieval, (as do GPS and radio systems) when receiver surfaces. Photos courtesy of emgs.
|
|
Careful forward modeling using structural information from seismic and other data may increase the spatial resolution of the interpretation, so that stacked pay can be delineated. These models and the processes that build them are essential to furthering the SBL technique.
SBL COSTS
Seafloor receivers are deployed from a survey vessel, similar in size to a modest seismic vessel, Fig. 2. The receivers are recovered by sending an acoustic signal through the water column that causes them to become buoyant. They are then retrieved at the surface, and the data are subsequently downloaded. On rare occasions, a receiver is lost. As in seismic, costs are heavily dependent on vessel mobilization and demobilization times. The surveys themselves can be conducted quickly, so covering an exploration prospect may only cost a few hundred thousand dollars compared to several million for a seismic survey.
EXAMPLES
Over 40 surveys were acquired by Shell, including surveys offshore Norway, West Africa, the Mediterranean and in the Far East, in northwest Borneo. Data were also purchased from an existing survey in Brazil. In each case, a campaign comprising several surveys was executed. The global campaign had two goals:
- Confirm the technology in clear cases of large, relatively shallow hydrocarbon accumulations; and, more importantly
- Interpret the data in more difficult settings, in conjunction with other data, such as seismic attributes, where advanced processing would be required.
In addition, all campaigns acquired data over exploration prospects not yet drilled.
West Africa. In processing an EM survey offshore West Africa, seismic was used to guide the building of three reservoir models. The three models (Fig. 3) were:
 |
Fig. 3. Reservoir models: 1 (top scheme, blue line), 2 (bottom scheme, red line) and 3 (intermediate, grey line), and actual EM response (green curve).
|
|
- Model 1 (blue curve) expected shallow and deep reservoirs, and was modeled as hydrocarbon saturated and therefore resistive.
- Model 2 (orange curve) assumed only deep reservoirs filled with saturated hydrocarbons.
- Model 3 (grey curve) assumed an intermediate route, omitting a shallow gas anomaly.
The actual measured EM response (green curve) matches Model 2 best, indicating that only the deep reservoirs contain commercial hydrocarbons. A subsequent exploration well verified this result. This implies that shallow seismic amplitude anomalies are caused either by residual hydrocarbons or stratigraphic changes.
Brazil. In a block that would become available in a forthcoming license round, Shell identified a potentially large number of undrilled exploration prospects. A seismic amplitude extraction indicated an anomaly, interpreted as an elongated channel with a combination structural/ stratigraphic trap, Fig. 4a.
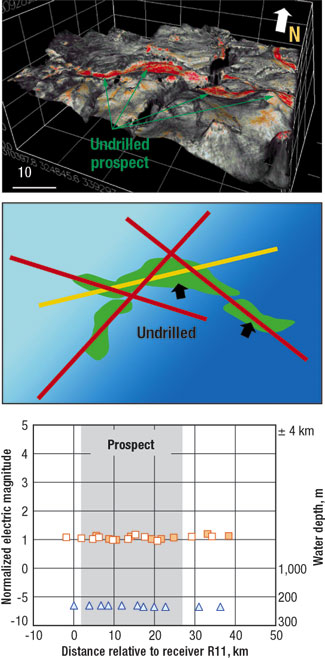 |
Fig. 4. Seismic attribute extraction (a),
SBL survey coverage (b), and
SBL response of the survey yellow line on map (c).
|
|
Detailed seismic amplitude studies had given inconclusive results in terms of pore fluid. An SBL survey was acquired over the prospect, but this survey did not show any anomalies. This evidence, when combined with further charge-evaluation studies, led the company not to pursue this prospect, which would have involved considerable license and drilling costs. While it’s easy to have a successful “don’t drill” prediction, it was the glaring lack of any SBL anomalies that tipped the decision balance in favor of not drilling.
S. E. Asia. Shell acquired several SBL lines as well as seismic over a thrust belt play in South East Asia. The main exploration uncertainty is seal integrity. Often, structures have overlying gas clouds or shallow gas layers in the overburden that reduce the seismic image quality in the crest of the structure. Seismic data quality improves down-flank, and possible direct hydrocarbon indicators, like flat spots, may sometimes be observed. However, such flat spots may be palaeo oil-water or gas-water contacts. An example, Fig. 5a, shows the first exploration well, targeting a flat spot, found only residual hydrocarbons, indicating that the flat spot could be a palaeo-contact.
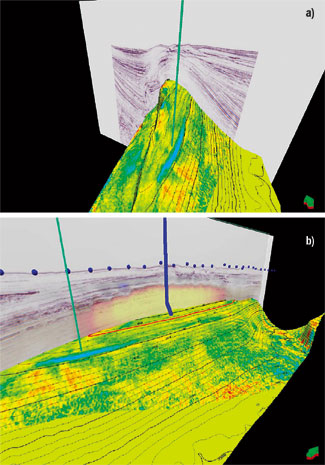 |
Fig. 5. Original well, drilled into a thrust play structure targeting a seismic flat spot, found only residual hydrocarbons (a). Visualization of the resistive body (bright yellow) overlain on seismic data led to the drilling a second well up dip, found fully saturated hydrocarbons.
|
|
The seismic section was gas obscured in the crestal area, but a later SBL survey showed an anomaly over the entire crest. Careful processing and depth imaging of the SBL data, after Mittet, et al.2, showed that the potential high-saturation hydrocarbons were indicated by the SBL data just up dip of the original well.
A second well was drilled on the crest, which encountered commercial hydrocarbons, Fig. 5b. This well might not have been drilled if there had not been independent, complementary information from SBL data that changed the uncertainty about charge retention of this trap.
FUTURE DEVELOPMENT
All of these examples show how physically different measurements can lead to a significant reduction in uncertainty. A robust data set is emerging that is being integrated in Shell’s subsurface uncertainty assessment and scenario ranking for deepwater exploration opportunities.
The technology holds great potential, although 3D data processing of SBL data is still primitive compared to seismic. We stress, however, that the technology is not a “silver-bullet,” but its optimal impact comes through careful integration with complementary data that measure different physical parameters. This is a complex task. It requires sophisticated physical modeling of the various EM effects that are recorded in the SBL experiments. Use of these effects has so far been rudimentary at best. Thus, the technique does not produce a “given” DHI, insofar as it only maps out resistors. Only after applying Archie’s law, together with higher resolution structure maps, may one arrive at an interpretation, emphasizing that forward modeling and CSEM results are non-trivial.
As with any new technology, not all examples permit clear and un-ambiguous interpretation. We expect further significant advances from sophisticated 3D acquisition, imaging and inversion of all EM effects constrained by acoustic and potential field data. Planned developments are underway to enable SBL to be used in water shallower than 200 m, and to extend the depth limit beyond 2,500 – 3,000 m below the seabed. Other research is directed at extracting more complex information more accurately from the data to predict the depths and configurations of potential reservoirs.
Shell and emgs have embarked on a joint research and development initiative to develop such techniques. Apart from scientific and technical improvements, the acceptance of remotely applied EM technologies in the geoscience community in our industry also requires good data acquisition and processing format standards, similar to the familiar SEGY seismic standards. 
ACKNOWLEDGEMENT
We thank the many staff in Shell, as well as emgs, who helped put together the data examples. We also thank our partners Petrobras, Petronas, ConocoPhillips and Dajo Oil for permission to use the examples shown.
LITERATURE CITED
1 Eidesmo, T., Ellingsrud, S., MacGregor, L. M., Constable, S., Sinha, M. C., Johansen, S., Kong, F. N. and H. Westerdahl, “Seabed logging (SBL), a new method for remote and direct identification of hydrocarbon-filled layers in deep water areas,” First Break, Vol. 20, pp. 144-152, 2002.
2 Mittet R., Maaø F., Aakervik, O. M. and S. Ellingsrud, “A two step approach to depth migration of low frequency electromagnetic data,” SEG Annual Meeting, Houston, 2005.
|
THE AUTHORS
|
 |
Dirk Smit has been with Shell since 1992. He earned an undergraduate degree in 1985 in theoretical physics and mathematics from the Univ. of Amsterdam, and a PhD in 1989 from the Inst. for Theoretical Physics, Univ. of Utrecht. Work experience includes the Theoretical Physics Dept. at the Univ. of California - Berkeley until end 1991, then on to Shell, where he started in EP Research. Together with co-workers, he introduced modern mathematical physics methods to establish imaging conditions for Kirchhoff seismic imaging in the presence of acoustic caustics, for which he received Shell’s Gold Award for Best R&D (1994). After assignments in the UK, he was Head of Geophysics for Shell Expro and responsible for Shell’s 4D reservoir monitoring program in the North Sea. He is now Vice President of Exploration Research and Innovation in Shell International and Exploration and Production. He won the Ludwig Mintrop Award (EAGE, 2001), is a member of SEG and EAGE and holds a visiting Professorship in Geophysics at the School of Earth Sciences at Leeds Univ. in the UK and is Visiting Scientist at MIT in the Department of Earth, Atmospheric and Planetary Sciences. Mr. Smit is also a member of the Solid Earth Panel of the US National Research Council, which is part of the US National Academy of Sciences.
|
|
 |
Paul Wood received a BSc honors degree in geophysics from the University of Liverpool, UK, in 1973. He joined Shell in August 1973 as a trainee seismologist. This was followed by an assignment in Borneo (Sarawak and Brunei) working on seismic data acquisition and interpretation. Subsequent assignments were in London UK in seismic processing, Tanzania, The Hague, Netherlands, Shell Nigeria as Divisional Chief Geophysicist, Oman, a return to Brunei as Chief Geophysicist, and then head of Shell EP Technology External Representation Team in Rijswijk, Netherlands. He is now global Exploration Communications Coordinator, also in Rijswijk.
|
|
|

