Drilling Report
Estimating Sw with a volume measurement
Collocated LWD-S measurements offer a solution for low resistivity pay and carbonate transition zones.
R. Griffiths and A. Carnegie, Schlumberger; A. Gyllensten, M. T. Ribeiro, A. Prasodjo, and Y. Sallam, ADCO
With a large percentage of the world’s known hydrocarbon reserves located in carbonate reservoirs, the push to increase production has revealed a need to improve oil saturation calculations in carbonate transition zones.
Numerous attempts have been made to modify the famous Archie equation’s a, m and n parameters to derive a saturation that more closely matches core saturation measurements, but these have met with limited success. Rather than continue this approach, a different model of the pore and fluid distribution has been proposed and field proven. The latest model is to change the saturation evaluation to a volume measurement and acquire that measure prior to significant invasion. Adding sigma S) measurement to LWD enables this. Using this approach, recent field examples show more hydrocarbons than indicated by resistivity or pressure gradient methods.
PROBLEMATIC CONDITIONS
Carbonate transition zones exhibit resistivity and pressure gradient phenomena that respond like water zones to resistivity and pressure gradient measurements. Interestingly, these same zones flow dry or nearly dry oil when put on production. Hydrocarbon evaluation within carbonate formations is complicated by host rock heterogeneity. More conductive laminations, which are thinner than the resolution of the resistivity measurement, may dominate the response.
Deposition and diagenesis (post-depositional changes) create complications. The distribution of pore sizes may not be constrained to neatly defined laminations. So, even if tensor resistivities are available, without a formation layer model, it is difficult to convert them to quantitative saturation.
Carbonate pore structure is complex with a wide variety of pore sizes ranging from visible to microscopic, Fig. 1. These can be divided into three groups: macro-pores, meso-pores and micro-pores. This pore structure creates a complex fluid distribution in the pore network, and it is this distribution that must be evaluated to determine hydrocarbon saturation, Fig. 2. For example, as hydrocarbon charging occurs, macro-pore water tends to be displaced first, because it has the lowest entry pressure. Depending on the buoyancy pressure and viscosity of the oil, a proportion of the meso-pores are also likely to become oil charged. During subsequent displacement of the oil by water-filtrate or water sweep, the fluid in the large pores will again move first. If the drawdown pressure is lower than the original charging pressure, then some of the meso-pores will likely remain oil-filled, while the macro- and micro-pores are water-filled.
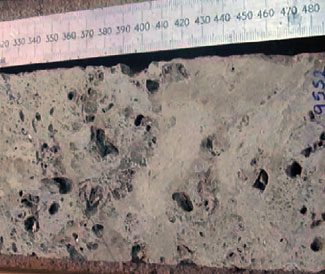 |
Fig. 1. This carbonate reservoir core section shows the spectrum of pore sizes and lack of uniform structure typical of carbonates.
|
|
 |
Fig. 2. Carbonate has a wide range of pore sizes. Micro-pores create short circuits, which produce path-of-least-resistance effects for resistivity tools.
|
|
Field results from traditional approaches of resistivity and pressure profiling have shown that greater interpretational complexity exists than previously acknowledged. While the Archie equation, linking formation water saturation to the formation porosity, true resistivity and connate water resistivity, has had tremendous success, it has a limitation in carbonates. This is due to the assumptions required, including which parameters to adjust and under what conditions. Gus Archie alluded to these limitations when he published the equation in 1942. One of the critical assumptions is that the measure current moves uniformly through the formation. Much of the resistivity interpretation difficulty arises because of path-of-least-resistance effects, Fig. 2. The presence of water-filled micro-pores in close proximity to the larger hydrocarbon-filled pores may short-circuit the resistivity measure currents, leading to underestimation of oil saturation by Archie’s equation.
Straight-line pressure gradient interpretation has also proved simplistic for carbonate transition-zone evaluation. Incorporating the capillary pressure effect on the pressure measured at the borehole wall, following invasion of water-based mud filtrate has had limited practical success, due to evaluation complexity. The complex distribution of a diverse range of pore sizes, combined with mixed wet-ability, makes capillary pressure effects in carbonates even more difficult to evaluate. In recent studies, pressure data across transition zones shows that:
- The upper part of the zone has an oil gradient, but the oil density implied is too light.
- The lower part of the zone has a water gradient and the resistivity across this section is usually low; yet, the upper section of this apparent water gradient sometimes produces oil with a low water-fraction.
- The transition between the oil and water gradients is usually an inflection and can have a negative gradient.
- Simple linear gradients applied to the pressure points can place the interpreted oil-water contact too high.
The result: the actual hydrocarbon in place may be significantly underestimated.
A SOLUTION
Fortunately, the depositional conditions under which many carbonate reservoirs were created also resulted in high salinity connate waters. The recent introduction of an LWD-S measurement has shown that a more accurate saturation is available from the volumetric-S measurement. An LWD-S measurement permits resistivity-independent, formation evaluation through salinity sensitivity. The solution to evaluating low resistivity pay appears to be in using non-resistivity methods in a substantially pre-invasion condition.
The recent introduction of EcoScope LWD delivers S within 16 ft of the bottom of the tool and prior to significant invasion. Its resistivity and pulse-neutron derived measurements are acquired at nearly the same depth with the same volume of investigation at the same time.
Thermal neutron capture cross-section (S) is a measurement that has been in use in cased- and open-hole reservoir evaluation for many years. High-energy neutrons are emitted into the formation and their subsequent capture by elements in the formation is tracked. Since the chloride ion is the most prevalent neutron-capturing element in most formations, the S-response can be equated to the proportion of chloride ions dissolved in formation water and closely related to water salinity. Knowledge of formation water salinity allows resistivity-independent, water saturation evaluation using a simple linear equation that does not require tuning parameters.
The biggest advantage of the S-measurement over resistivity is that it is volumetric. The nuclear interactions sample a volumetric average of the formation rather than following a path-of-least-resistance, as do resistivity-measure currents. Another benefit is the acquisition of resistivity and pulse-neutron derived data at almost the same depth at the same time under the same conditions. This enables direct comparison of the responses for cross-validation and derivation of formation parameters, Fig. 3. A valuable benefit is that when the S- and resistivity-derived saturations do not match, collocation of measurements limits the environmental factors that need to be considered. Instead, the difference in saturations can improve formation parameter determination and derive oil saturation with a lower uncertainty, than that derived using resistivity or S alone.
 |
Fig. 3. An example of a serious discrepancy between the hydrocarbon contacts, as defined by traditional resistivity and pressure interpretation methods, versus the contact and fluid saturation, defined by S interpretation. In this case, S was acquired in cased-hole long after the well was drilled.
|
|
MIDDLE EAST CARBONATE FIELD
One of the first measurements, acquired with the LWD tool for the Abu Dhabi Co. (Onshore Oil Operations), covered a gas zone, oil reservoir and known low-resistivity pay intervals. In the left two tracks of Fig. 4, the tool’s software derived saturations based on a range of m and n values. Track 1 shows m varying between 1.7 and 2.3 for an n value of 2. Track 2 shows n varying between 1 and 2.5 for an m value of 2. In both tracks the saturation, derived using the “standard” m=n =2, is indicated by the red line. The same water salinity value was used to derive the water-S used in the interpretation, and the Rw used in the Archie equation.
 |
Fig. 4. This saturation comparison between resistivity-derived (Archie) results and volume-derived (S) results shows good agreement in the gas zone and a significant oil saturation increase in low-resistivity pay zones.
|
|
In the top of the figure, the S saturation (black line) and the resistivity saturations overlay. In this gas zone, the low gas viscosity and high buoyancy pressure appear to have facilitated gas charge into portions of the micro-pores, disrupting most of the paths-of-least-resistance, resulting in a formation that obeys the traditional Archie equation.
In the middle of the figure, it is apparent that in the oil zone neither m nor n is close to 2. If we hold n =2, then the m value required to match the S-derived saturation is less than 1.7. This is lower than m values normally derived from core analysis. On the other hand, if we hold m =2, then n must be lowered to 1.5 to match the S-derived saturation. Either way, Archie’s parameters must be adjusted to match the S-derived saturation.
In the lower part of the figure, two low resistivity pay zones are seen. Evaluating these zones was the objective. The range of results in Track 1 indicates that there is considerable sensitivity to Archie’s m factor. Track 2 shows a similar sensitivity to n. In both zones the standard values of m and n do not give a saturation match. The volume of oil indicated by S in Track 3 is significantly higher than the resistivity analysis. On production test, both units flowed oil with low water cuts.
The fact that m and/or n must be lowered in the oil zone indicates a formation with a lower resistivity response than predicted by Archie’s equation. The parameters are being adjusted to overcome the path-of-least resistance effect on the resistivity measurement.
The divergence on the m value increases down the oil column as the proportion of water in the formation increases and the effect of the electrical “shorts” through the formation increases. As a volumetric measurement, S does not suffer from these effects and delivers formation oil-saturation without parameter adjustments.
Track 3 shows the volumetric proportion of the formation that is pore space (blue line). The green line represents the hydrocarbon volume, as calculated via Archie’s equation resistivity, while the black line shows the hydrocarbon volume indicated by the S analysis. Note the good overlay between the Archie and S saturations in the gas interval and the top lobe of the oil layer. High in the oil layer, the buoyancy of the oil is able to disrupt the continuous water phase that creates formation “shorts.” The discrepancy between the resistivity-derived and S-derived oil volumes increases with increasing water saturation and, hence, more “shorting” of the resistivity measurements moving down the oil column.
The water showing in the upper section of the oil leg is due to injection water breakthrough with mixing of original and injection waters. This results in a complex interpretation environment.
CONCLUSION
While tensor resistivity measurements yield valuable information in laminated formations, their use in carbonates is still under investigation. Using a resistivity-independent volumetric saturation methodology, such as the acquisition of S prior to significant invasion, opens the door to improved oil saturation estimates. Accurate detection of oil and determination of fluid saturation are critical, since zones that are apparently water-filled are seldom tested. 
REFERENCE
Griffiths R., and A. Carnegie, A. Gyllensten, M. T. Ribeiro, A. Prasodjo, Y. Sallam, “Evaluation of low resistivity pay in carbonates – A breakthrough,” presented at the 2006 Society of Petrophysicists and Well Log Analysts (SPWLA) 47th Annual Logging Symposium, Veracruz, Mexico, June 4 – 7, 2006.
|
THE AUTHORS
|
 |
Roger Griffiths earned an honors degree in mechanical engineering from the University of Melbourne, Australia. He is the LWD interpretation domain champion for the Arabian Gulf covering UAE, Qatar, Oman and Yemen. Griffiths joined Schlumberger as a wireline field engineer in 1987 and has held a variety of field and management positions ranging from operations management to engineering development of wireline and LWD services, and field petrophysical support.
|
|
 |
Andrew Carnegie earned BS and PhD degrees in applied mathematics from London University, UK. He has worked in the oil industry for 20 years and is reservoir engineering advisor at the Schlumberger Beijing Geoscience Centre. Carnegie has been involved with reservoir simulation studies, geostatistics and well logging, and has extensive experience in limestone and sandstone reservoirs.
|
|
 |
Asbjorn Gyllensten earned an MS from Technical University in Trondheim, Norway, and an MBA from INSEAD in France. He is the petrophysics discipline expert for the Abu Dhabi Co. for Onshore Oil Operations (ADCO). Gyllensten has been seconded from Shell to ADCO in Abu Dhabi since 1998. He served on the SPWLA board as regional director for Europe and Middle East from 2003 to 2005.
|
|
|
Maria Teresa Ribeiro earned a BS degree in economic and applied geology, and an MS degree in reservoir evaluation and management from Heriot-Watt University. She has expertise in interpretation and integration of reservoir data for clastic and carbonate reservoirs, and in deterministic and stochastic modelling. Ribeiro has more than 17 years in reservoir studies, development projects and field operations. She is the geoscience coordinator for the North East Bab team in ADCO.
|
|
|
Adi Prasodjo earned a BS in electronic engineering from ITB Bandung, Indonesia. He has 17 years of oilfield experience, including wireline field operations with Halliburton and petrophysics with Baker-Atlas. He is now a petrohysicist for the North East Bab team in ADCO.
|
|
|
Yassim Sallam earned a geology degree from the University of Ain Shams, Cairo, Egypt in 1986. He has 17 years of oilfield experience including wireline and LWD operations, mud logging, log interpretation and data management. Sallam joined ADCO in 2001 as a petrophysicist and is presently working on multi-layered carbonate reservoirs. Yassin is a member of the SPE and SPWLA Abu Dhabi.
|
|
|

