Reservoir Characterization
Management of geologic risk, uncertainty defines accurate horizontal well placement
Addressing geological challenges prior to horizontal well execution ultimately results in increased reserves recovery and enhanced return on investment.
A. Al-Fawwaz and S. Hassani, Saudi Aramco, and D. Nwabor, Schlumberger
More than 40% of horizontal wells encounter major unexpected structural geologic/ stratigraphic changes during drilling that result in wells being sidetracked or serious consideration given to this option. As the hole angle increases and measured depth of bed thickness becomes more distorted, correlation between predicted and actual geologies proportionately increases in difficulty.
Therefore, real-time correlation must be systematically planned in advance, and must identify key marker beds and decision points. Failure to recognize individual parameters within the reservoir of interest, such as stratigraphy, rock type, reservoir geometry and structure, fluid content, and formation petrophysical properties, can result in costly mistakes.
As witnessed during planning and executing horizontal drilling programs in the Hawiyah and Haradh fields of Saudi Arabia, the industry’s ability to drill horizontal and high-angle boreholes has improved with the aid of proper geological planning, execution and evaluation. Advances in wireline technology adapted to the drilling environment, in combination with present measurement-while-drilling (MWD) techniques, can allow conventional logging-while drilling (LWD) tools to provide the necessary information and insight for steering boreholes geologically, and for petrophysical evaluation.
A NOT-SO-SIMPLE TASK
The task of assembling relevant information about the geology, as mapped, and then planning a trajectory is not a given. Understanding a reservoir’s heterogeneous character and the directional relationship of reservoir permeability is required, as is the ability to adjust the well trajectory while drilling, using resistivity, gamma ray, density and porosity logs. Well planning involves delineating the targets on the basis of seismic maps, top structure maps, offset well logs, geographic target selection, and 3D modeling and visualization, to arrive at a plan of continuous well trajectory to penetrate the target reservoir zone.
Unfortunately, geologic maps are not always correct, as a result of errors in seismic processing and interpretation. Uncertainties in determining target depth and lateral position are combined with an inability to predict small-scale features, such as minor and sub-seismic faults. Therefore, real-time interpretation of all incoming data is just as important as the data, itself. Geological constraints/ problems, such as offset well mis-ties, faulting, stratigraphic variations and pinch-outs, pose significant risks during drilling.
The following concerns affect accurate well placement:
- Borehole position uncertainty related to directional survey accuracy.
- Geological uncertainty (structural dip and stratigraphic), such as lateral facies variation.
- Directional control while drilling.
- Unanticipated buildup rates and doglegs found while drilling.
- Limitations of LWD tools and methods.
- Ambiguities inherent in interpreting propagation resistivity logs in horizontal wells.
Proper management of geological risk and uncertainty leads to fewer pilots being drilled with less cost.
DIVERSE RESERVOIRS, SOLUTIONS
The Haradh and Hawiyah wells are located in a geologic trend known as the Khuff. Khuff C sediments were deposited on a shelf of very low relief, where a series of repeated short-lived changes in sea level occurred, which were accompanied by exposure to meteoric fluids and dolomitization by hypersaline fluids. This produced facies variations over large areas. Khuff C carbonates are defined at the base by the underlying regional Khuff D anhydrite and at the top by extensive Khuff C anhydrite, Fig. 1. Four high-frequency sequences make up the Khuff C carbonate interval. The four sequences have been further subdivided into 12 reservoir layers (C1-12) from top to bottom.
 |
Fig. 1. Map showing the study area, Hawiyah and Haradh fields, in eastern Saudi Arabia.
|
|
The approach to handling geologic/ petrophysical risk, uncertainty and drilling hazards resulted in a significant extension of target reservoir zone exposure. The Haradh well achieved an estimated reservoir exposure of about 2,981 ft in the target zones (536 ft in the C2 porosity and 2,445 ft in the C4-C7 interval). Original plans for the Hawiyah well would have resulted in an estimated reservoir exposure of 800 ft, compared to the achieved 2,164 ft.
METHODOLOGY
The pre-job evaluation sequence ideally begins with a geologic checklist and forward modeling. Then come the execution and reservoir evaluation stages, followed by a landing and a lateral section phase. This event sequence was applied on both the Haradh and Hawiyah wells. Geologic checklist items include the following.
- Target uncertainty. It can be target reservoir TVD, formation dip angle or lack of reliable offset wells. It is advisable to discuss these uncertainties and the possible scenarios that can overcome them.
- Fault position and type of fault (up thrown, down thrown or lateral fault) must be determined to have a ready plan on how to pass through the fault and still penetrate the target formation. Fig. 1 shows the presence of a fault in a horizontal well prospect.
- Fluid contacts. Fluid contact depth, relative to target formation, is essential for a well’s production life. It is imperative to be aware of fluid contact hazards and to know specifically where to place the drain section, relative to reservoir fluid contact points.
- Drain section length. A careful study of formation to be drilled and target reservoir should be done to identify the most appropriate LWD technology that will enhance well placement decisions. The study must include different lithologic log responses and enable key decisions that will help steer the well and position the BHA in the reservoir’s best portion.
- Survey data. A geologist usually follows a well’s direction continuously, updates his earth model and helps to interpret the logs, so he can suggest changes in the plan, if needed. The TVD, inclination and azimuth define a survey station. Survey accuracy is very crucial to successful placement of any horizontal well, so the offset and real-time well surveys must be scrutinized before being accepted.
Industry standard is to use minimum curvature to calculate wellbore position from surveys. An assumption has been made of a minimum curvature method that assumes there is no curve radial change between two surveys. In reality, while steering by motor for a deviated or horizontal well, the drilling mode often (slides/ rotates) changes between 95-ft surveys. So, the curve rates between surveys normally are not constant, and the interpolation by the same curve rate between the 95-ft spacing surveys does not reflect the wellbore’s actual trajectory. This brings further uncertainties on the 95-ft spacing surveys and leads to errors in calculated wellbore position, particularly for TVD.
The Forward Modeling phase is described as follows. Logging tool response to a layered medium depends on the relative angle between the tool axis and the bedding plane. In horizontal wells, this can lead to difficulties interpreting data from resistivity devices, particularly when adjacent bed effects are complicated by fluid invasion and anisotropic formations. Log forward modeling provides insight into possible log responses to a particular well before it is drilled, by constructing a catalog of modeled logs for a range of possible geologic and trajectory scenarios. This enables selection of the optimum logging tool configuration and demonstrates the well requirement feasibility. It also familiarizes the asset team with expected log responses in different geological scenarios and geometry-dependant events, such as polarization horns.
Pilot well or adjacent well log data are used to build up one or more formation “layer columns” to represent the sequence. The offset well log data – in these cases true resistivity (RT), bulk density, neutron porosity and gamma ray – are run through deconvolution filters to produce squared log responses. Deconvolution reduces the number of sampled layers to only the actual petrophysical changes. It also enables inclusion of thin beds that have not been properly resolved in original logs, but which may be significant during well site correlations.
The reservoir’s 3D structural model is obtained and combined with the petrophysical layer column and the proposed well trajectory. The petrophysical model is then convolved with LWD tool response functions to generate synthetic logs along the planned trajectory. Typically, various geological and structural models are run to visualize the uncertainties associated with input data, such as differing formation dips and introduction of potential faults. The forward modeling produces a database of modeled LWD log responses from 0 – 90° apparent dips. This information and data are used for steering the well during the execution stage.
Sometimes, significant differences in lithology or thickness, with respect to prediction, are encountered when landing the well. In these cases, landing data are used to update the model’s layer column, and a new database of log responses is generated.
The execution and evaluation stages are described as follows. The execution phase generally consists of two main parts, the landing and the lateral section. A strategic, good landing ensures that a well’s heel is also successfully drilled within the layer. The landing (when well deviation is very close to 90°) also involves advance planning of the lateral section, so that little steering is required in the heel. Following landing, horizontal interpretation and adjustments occur while the lateral section is drilled. The objective is to adjust the well trajectory and stay within a defined reservoir zone. A geologist controls the real-time drilling of the well, either from the rig site or remotely via network data transmission.
The landing phase is described as follows. The landing depth, based on seismic maps, is usually agreed within a multidisciplinary team before drilling begins. It can be categorized as a stratigraphic landing, or as a landing in relationship to a fluid contact. A stratigraphic landing is defined from a lithologic boundary of the subsurface, e.g. 12 ft below the top of the target reservoir. A landing in relationship to a fluid contact is simply defined from a specific contact, e.g. land 12 ft below the gas-oil contact (GOC).
The landing can also be defined, either in a combination of stratigraphic and fluid contacts, or by any other limitations. In general, a geologist will correlate all the necessary markers above the target when drilling to the landing. He will track all observed markers and compare to expected markers from an offset well. This is to control the current drilling of the well, and where it will continue to drill. From these correlations, he then gives important drilling information, with respect to whether the target will come in shallower or deeper. The drilling team can then work proactively to change the well plan in advance, so that the landing will be smooth and timely.
A marker spreadsheet usually tracks correlations and compares expected markers with observed markers. This simple table can help a geologist to track correlation trends. For example, are the markers coming in shallower or deeper? All correlations are typically communicated to everyone, both on the rig and in the office. The geologist is responsible for sending out precise information, such as correlations of important markers, how many feet, TVD and MD, before the target formation top is reached, and also whether the initial plan has changed.
Usually, the original plan is compared with reality. If the target will come in shallower or deeper, he will give advice and recommendations on how to land the well. Also, he calculates how to build to a certain angle and hold section until a specific marker is defined, e.g. how is the gas-oil contact (GOC) correlating with offset wells? One can then issue out instructions on how the well should be landed.
After landing the well in the best geological part of the reservoir (sweet spot), the objective is typically to drill the lateral section and stay within the given zone. The lateral section can either be drilled geometrically or geologically. If the lateral section is drilled geometrically, the well plan is communicated to the directional driller at the rig, and he follows the well plan without any adjustments.
If there are uncertainties in reservoir thickness or formation dip, the well might drill out of the reservoir zone. Also, if the lateral section is geologically steered, then the plan can be changed to adjust for formation dip and lateral variation of the reservoir thickness. The geologist works continuously during the drilling of the lateral section to evaluate real-time data from the wellbore. He also keeps the rig and the reservoir engineers informed continuously about where the well is drilling and if adjustments are needed.
The tools that the geologist uses to evaluate include correlation of real-time data and the modeled log response. This will give a graphical view of where the well is drilling, the prediction ahead and the apparent formation dips.
DATA PRESENTATION AND RESULTS
Two case studies from the Haradh and Hawiyah fields in Saudi Arabia were used to unveil and unravel the geologic constraints that plague horizontal well targeting. During this data presentation stage, the focus was on the initial geologic prognosis/ plans of the wells, and the inherent geologic risks and uncertainties. These risks were monitored during the well execution stage and were managed and coped with, to meet and achieve the well’s primary objectives.
INITIAL PROGNOSIS FOR THE HARADH WELL
The Haradh horizontal was proposed and drilled as a single lateral in the Khuff C reservoir as a sidetrack from the existing HRDH xxx vertical, Fig. 2. The plan was to drill in a WNW direction, close to the direction of maximum stress to minimize hole condition problems. The target was a roughly 40-ft-thick (TVD) dolomite/ limestone sequence with variable porosity. Individual porosity layers within this target were a maximum of 6 ft thick. This zone falls between the Khuff C4 and C7 markers, based on offset wells.
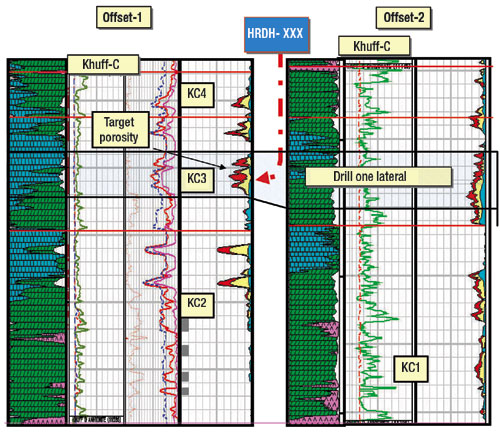 |
Fig. 2. Haradh offset wells, showing the target reservoir architecture from the sidetrack point. Lithology types, ranging from anhydrite to limestone and dolomite, are also shown. The KC3 porosity development was expected to be exposed laterally in this well.
|
|
This zone’s apparent thickness was consistent, as shown on the correlating offset well logs, although the porosity distribution was variable, both vertically and laterally. Concerns about drilling at hole angles above 90° resulted in the planned landing at 90°, allowing the up-dip structure to move the well path down the stratigraphy to the target zone. From landing to target entry, there was an expected interval of 1,000 ft of poor porosity.
Objectives. The following objectives were delineated:
- Target and drill 5,000 ft in the high-porosity, high-stand facies.
- Land at 90° and cut through the structure, based on bed dip toward the well.
- Geosteer in porous zones within the target to maximize reservoir contact.
- Avoid drilling above 90°, if possible, as this has caused problems in the past.
- Ensure that the well path is suitable for well completions.
Geological constraints. Factors to be considered included:
- The offset well control is limited.
- Seismic data suggested an anticlinal structure in the target area with high dips
- Porosity variation is expected, both laterally and vertically within the target zone.
Actual job execution. On commencement of the 5-7/8-in. hole section, the LWD suite of measurements was utilized while drilling in association with 24-hr geological and petrophysical interpretation support. As planned, the well was landed at 90° above the target porosity zone at 12,808 ft, MD (11,423 ft, TVD). This was done to allow the well path to be maintained at or below 90°, and with an up-dip structure, drilling at 90° would allow the well path to cut down through the layers stratigraphically while maintaining a constant TVD.
Drilling was maintained at 90° between the landing point at 12,808 ft and 14,100 ft, MD. At this stage, formation dips appeared flatter than expected (being <1° rather than the expected 1.5°). This implied that the well was cutting down stratigraphically slower than expected. Also, some intervals of good porosity were intersected (at 13,001 to 13,238 ft, MD; 13,411 to 13,476 ft, MD; 13,520 to 13,554 ft, MD; and 13,627 to 13,667 ft, MD).
Due to flatter-than-expected dips, a recommendation was made to drop angle at a bit depth of 13,788 ft, MD. A decision was made to carry on drilling at 90°, to see if the plan’s expected, higher dips would materialize.
The top of the Khuff C4 was observed at 15,215 ft, MD. After cutting down through two thin, porous beds, a high porosity layer was encountered at 15,360 ft, MD. This has local porosity greater than 20%, which is higher than observed in the offset wells. Correlations using the offset wells (Fig. 3) suggest that the higher porosity is similar to offset well 1. In this well, the FAL suggests better porosity development in the upper part of the C4-to-C7 interval, Fig. 4. Dips from the image suggest a slight change in formation dip from 1° toward the heel, to 0.5° toward the toe. This proved to be a local change. As a result of these observations, a decision was made to build to 89°.
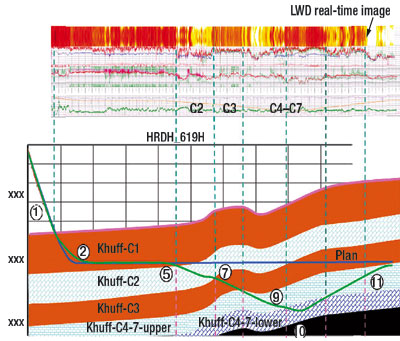 |
Fig. 3. Real-time LWD image, showing the planned well versus the actual well trajectory as drilled. The well was landed in the Khuff C1 and later penetrated the Khuff C2 before stopping the well in the Khuff C4-C7 target. The numbers 1-11 are the decision points taken as the well was being drilled. These changes were the result of major geologic plays encountered during the execution stage.
|
|
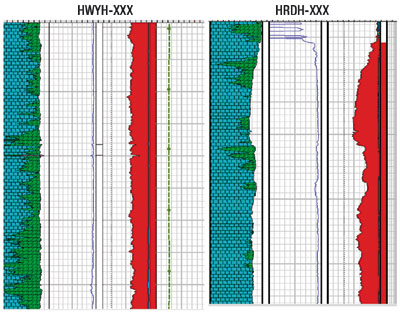 |
Fig. 4. Petrophysical interpretation and formation analysis (FAL) of the case studies using LWD data.
|
|
At 17,150 ft, MD, a section of improving porosity was encountered to a high value of over 20 Pu beyond 17,210 ft, MD. A relative dip of 1.5° was obtained from a number of clear sinusoidal features at the boundary between poor and good porosity. Initial recommendations to drop angle, to go parallel, were deferred until the zone’s extent was quantified. With the bit at 17,370 ft, MD, the decision was made to drop to 91°. A brief wiper trip was made at this time to ensure that the hole was in good condition.
The well drilled to TD in an estimated 3,940 ft of good porosity layers.
HAWIYAHA XXX/ INITIAL PROGNOSIS
Hawiyah xxx was proposed and drilled as a dual lateral well in the Khuff C reservoir, Fig. 5. The well was drilled in an ENE direction, close to the direction of maximum stress to minimize hole condition problems. The first lateral target (informally termed the “lower porosity zone”) was a roughly 40-ft, TVD, thick dolomite/ limestone sequence with variable porosity. Individual porosity layers within this target were a maximum 6 ft thick, TVD. This zone falls between surfaces C3 and C5 supplied from the seismic. The target for lateral 2 was a stratigraphically higher zone (informally termed the upper porosity zone). This zone was 12 ft thick, with the best porosity developed in the lower 4 – 5 ft of the zone. Results of the well placement for the two laterals are summarized. The integrated forward modeling was also done to predict the LWD tool responses in layered rock media, Fig. 6.
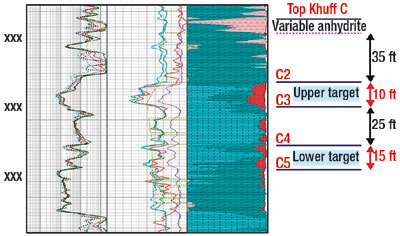 |
Fig. 5. Hawiyah well target reservoir architecture, as interpreted from the offset well. The thickness and porosity development are also shown.
|
|
 |
Fig. 6. Hawiyah well post-job model, based on the 3D surfaces and expected formation properties. The expected properties are forward-modeled, based on the tool response, formation properties and relative angle.
|
|
Objectives. The following objectives were delineated:
- Maximize the length in a higher-porosity zone within the upper part of the Khuff C target.
- Drill a 4,500-ft lateral in the C2/ C3 lobes.
- Place the well optimally by making adjustments in real time.
- Ensure that the well path is devoid of any completion problems.
- Use geosteering techniques for optimum well placement in the Khuff C reservoir, maximizing porosity and accessing two separate zones of elevated porosity.
Geological constraints. Factors to be considered included:
- Limited offset well controls.
- Target is thin (about 13 ft, TVD, in thickness) with variability in porosity development.
- Structural dip may vary from prognosis.
- Mechanical sticking, hole instability resulting from formation stresses.
- Lateral facies variation and formation heterogeneity.
- Dolomitization and solution effects.
Actual job execution. Drilling in geosteering mode continued with the BHA up to the Khuff C-2 target reservoir at 12,914 ft, MD. Key technologies and processes used in drilling this well included GOCAD, InterACT, real-time 16-sector density images, 24-hr well placement, expert interpretation and INFORM3D modeling support. LWD tools provided gamma ray, resistivity, two azimuthal densities, density correction, photoelectric effect, neutron porosity and density images in real-time
Principal techniques utilized were correlation of the full suite of real-time LWD measurements with modeled responses based on offset wells, and interpretation of images while drilling, including dip picking in near real time.
The Khuff C2 target top was encountered at 11,607 ft, TVD. The plan called for placing this well’s heel 5 ft below the pierce point, which then meant that the actual heel would be 11,612 ft, TVD. A geological constraint was observed at this stage (slight increase in dip), and this implied that landing would be a bit lower to the bed than expected. However, there was no serious concern, since it was a local dip, and the well was expected to remain in good porosity. It was then decided to continue to drill as planned. Entry into the top of Khuff C was detected by the polarization horn of the LWD resistivity and an increase in the gamma ray reading. Due to the fact that the well was drilling down dip, the apparent TVD thickness increased, compared to offset wells. The well was finally landed in the target reservoir with the aid of the formation dips from the LWD tools. The lateral section was successfully steered to a target TD in good porosity zones.
As shown in pre-, during and post-job evaluation in both of the Saudi Arabian wells, real-time images provide valuable information about the geological formation, and provide the most accurate dips. By using images, the ability to target thinner reservoirs or difficult objectives is greatly improved. 
ACKNOWLEDGEMENTS
A large number of people contributed to this project’s success. From Saudi Aramco, assistance and enthusiasm were provided by Khaled Zainalabadin, Hilal Al-Waheed, George Grover, Jamil Hajhog and Saleh Raimi, along with other team members. The authors also thank Pablo Ariel Codesal at Schlumberger, plus Professor I. P. Orajaka and Dr. Onwemese, both of the Department of Geological Sciences at Nnamdi Azikiwe University in Awka, Nigeria, for reading the manuscript and expert contributions.
|
THE AUTHORS
|
 |
A. A. Al-Fawwaz is a petroleum engineer, who works as a petrophysicist in Reserve and Assessments at Saudi Aramco, Saudi Arabia. He started in the oil field in 1987 as a wireline operator. Upon graduation in 1988, he joined Saudi Aramco as a production engineer. He has worked in the areas of geology, geosteering and reservoir description, and has authored several technical papers. He is a member of SPE and SPWLA.
|
|
 |
Saidi Hassani works for Saudi Aramco in the Gas Fields Characterization Division as a reservoir geologist. He previously worked for Qatar Petroleum as a senior reservoir geologist for the North Gas Field from 1999-2002. Prior to this, Mr. Hassani worked with BP Exploration Alaska and Deepwater Gulf of Mexico as a reservoir description geologist in development and studies from 1991-1999. He received a PhD in geology from the University of South Carolina in 1991. He is a member of AAPG, DGS and IAS.
|
|
 |
David Nwabor works for Schlumberger as an LWD account manager, dedicated to Saudi Aramco in Saudi Arabia. He started his career in the oil field as a field logging engineer in 1989. His areas of specialization are geosteering, formation evaluation using LWD data and images, technical sales and business development. Mr. Nwabor has worked in Nigeria, Indonesia and Saudi Arabia. He received a PhD in petroleum geology from Nnamdi Azikiwe University in Nigeria.
|
|
|

