Production Technology
Determining waterflood effectiveness
Voidage replacement ratio identifies potential problems while maximizing production
Binayak Agarwal, Jai Nath Ram and R. N. Bhattacharya, ONGC Ltd, India
Water injection as a means of secondary recovery and as a technique for pressure maintenance to energize the reservoir is one of the oldest techniques used in the petroleum industry. Over the years there has been tremendous advancement in this field, and in waterflood design, development, and surveillance. Of these, the design and development of the waterflood usually attracts the most attention. However, surveillance is a relatively less rigorously followed practice, although its importance in the waterflood's success cannot be understated.
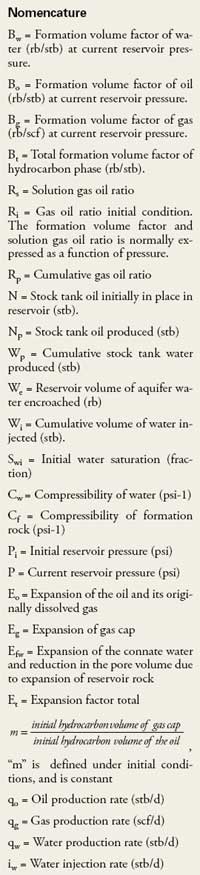
There are many easy-to-use techniques for monitoring a water injection/ waterflood project, e.g. Hall plot, WOR, GOR plots, voidage replacement ratio, etc. Voidage Replacement (VR) and Voidage Replacement Ratio (VRR) derive from an analogy with liquid tanks, Fig 1. Liquid production from a well creates a void in the reservoir and water injection into the reservoir fills the void. This article explains the technique's effectiveness and describes some of its pitfalls.
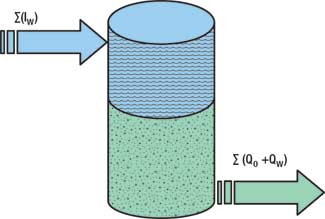 |
Fig. 1. In the tank model, reservoir production can be viewed as the withdrawal of oil, water and gas from a tank. Production creates a void, which leads to a pressure drop. Injection of external liquid into the tank leads to Equation 1. Equation 2 can be used to convert all the liquid into reservoir conditions.
|
|
Waterflooding is accepted worldwide as a reliable and economic recovery technique; almost every significant oil field without a natural water drive or with a partial water drive has been, is being, or will be considered for waterflooding. Waterfloods need to be initiated at an optimal time to enhance field recovery and maximize profits. The optimal time for a particular reservoir depends on the operator's primary waterflooding objective:
- Maximizing oil recovery
- Maximizing future net worth
- Maximizing rate of return
- Stabilizing monetary return
- Maximizing net present value.
In a homogeneous reservoir, maximum oil recovery can be expected if flooding is initiated when the bubble point pressure is reached. This is because of the high free gas saturation in residual oil and favorable oil-viscosity conditions. However, heterogeneity causes the optimal pressure for the highest recovery to be lower than the bubble point pressure.
In the case of low bubble point pressure, by the time it is reached, production rates may have declined substantially, making a waterflood unattractive. In this situation, the operator may initiate a waterflood much before the bubble point pressure is attained. Therefore, waterflood initiation may require an integrated reservoir management process during a reservoir's producing life to arrive at the best time to start a waterflood. Besides the waterflood's start time, a waterflood asset management program is the key to a successful waterflooding program. Upon post mortem, a majority of unsuccessful waterflood projects reveal lacunae (shortcomings) in the practice of Waterflood Asset Management (WAM). Generally, the surveillance and monitoring system is the weakest part of the WAM process. With the initial oil production gain from waterflood, the operators become complacent about surveillance and monitoring, thereby, loosing control over the entire flood process.
In the WAM's surveillance and monitoring system, VR and VRR are crucial components. VR is an important goal of any waterflood project, not only in terms of federal or country laws, but also in terms of performance and recovery. Analysis and understanding VR and VRR gives insight into the waterflood process, reservoir response, volumetric sweep and pattern performance.
WATERFLOOD ASSET MANAGEMENT
An effective program runs in harmony with the reservoir management strategy of the field.1 WAM encompasses these steps:
- Identify the need for the waterflood.
- Develop a technically and economically feasible plan. This involves assessing the technical feasibility of the process, analysis of different scenarios, evaluation of the process' economic viability in extreme conditions and deciding on the injection pattern, producer combinations and injection/ production profile.
- Schedule and implement the plan. This has several steps: preparing a blueprint of technical implementation, surface facility scheduling, a timeline for injector and injection profile, data-collection schedules for surveillance and monitoring, and execution and implementation of the plan.
- Surveille and monitor performance. This includes data acquisition and streaming, data mining and plotting (Hall plot, WOR plot, GOR plot, VRR, pressure fall-off study, etc.), and data analysis and performance monitoring of injector behaviors, producer and reservoir waterflood response.
- Assess reservoir performance. This includes production performance, reservoir pressure response, injection schedule and miscellaneous issues.
- Modify or correct the plan, including the waterflood's future strategy.
These WAM components are interdependent and their integration is essential for successful reservoir management. It is a live process, and functions throughout the waterflood's life. In some cases, it continues after the plan is abandoned.
A careful analysis of the operator's waterflood program reveals that a high degree of attention is given to the planning phase and to reservoir performance assessment. This is also reflected in the software, equipment and support available for this purpose. By comparison, scheduling, monitoring, surveillance and correction receive less attention. For a successful waterflood program, these areas need attention.
The surveillance program generally addresses the needs of reservoir description, reservoir performance, sweep efficiency, injector and producer behavior, water quality and reservoir response, facilities and equipment maintenance, troubleshooting, potential problem diagnosis and cost compliance.
A comprehensive surveillance program involves data acquisition and monitoring reservoir response by pressure, rate, patter, volumetric sweep, communications, barriers, channels, thief zones, wells, producers and injectors, facilities and water system.
Evaluation, analysis and monitoring of VR behavior encompass waterflood reservoir surveillance. A conscientious application of VR concepts gives insight into the reservoir's waterflood response, through fill-up, sweep, pressure increase, etc. It also aids in patter-balancing, mid-course corrections, and troubleshooting potential problems of channels or thief zones, fingering, fracture communications, gravity under-ride, etc.
MATHEMATIC DERIVATION
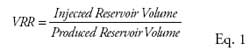
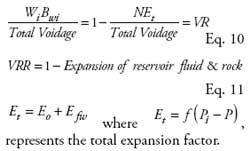
VRR is defined as:
The instantaneous VRR may be calculated:
The computations are done both cumulatively and instantaneously and plotted versus time to understand waterflood performance. Intuitively, it suggests that, if the VRR is unity, then the injection process is volumetrically replacing exactly the produced fluid.
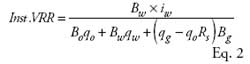
According to the material balance principle2
where, (a) DDI = Depletion Drive Index:
(b) SDI = Segregation Drive Index
where, HCV = Hydrocarbon Voidage
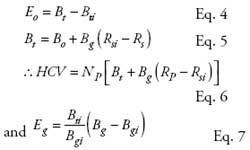
(c) CDI = Compressible Drive Index
where: m = size of initial gas cap to the size of oil zone
and (d) WDI = Water Drive Index
Assuming there is an under-saturated oil reservoir, under solution gas drive, i.e., with no gas cap (m = 0), no segregation of gas in the reservoir as a secondary gas cap, no encroachment of aquifer (We = 0) and no mobile water in the reservoir to produce (Wp = 0), the drive index identity of Eq. 3 can be rewritten as
The terms can be rearranged
With production from the reservoir, the pressure in the well depletes. This leads to expansion of reservoir fluid and rock. As water injection continues to occupy the void created, there will be a gradual increase in average reservoir pressure. Therefore as the pressure, P, tends to Pi,
This means that there will be gradual reservoir pressure increase and as cumulative VRR reaches unity, there will be complete re-pressurization of the reservoir to the original reservoir pressure condition.
VRR ANALYSIS
 |
Fig. 2. An idealized VRR vs. time plot shows that as injection continues, and the reservoir fills, VRR will gradually approach unity.
|
|
In general, VRR data is plotted against time. Perhaps this is the plot commonly requested by regulators. However, the calculation of VRR can have a significant impact on the nature of this plot, Fig. 2.
As injection continues, and the reservoir fills, VRR will gradually approach unity. If the operator does not deliberately desire to repressurize the reservoir, VRR can be maintained at unity. Unity is one of the primary requirements of many federal laws. However, depending upon the methodology adopted and the parameters chosen for calculation, the estimate of VRR can vary.
For example, if the initial pressure is the pressure at injection start, VRR can go beyond unity, even though the reservoir has not been properly repressurized. If the initial pressure is considered the bubble point pressure, then it may be a long time before the reservoir arrives at unit-VRR values. In a cumulative VRR, as with almost all volumetric or material balance estimates, the interpretation normally demands a significant amount of data, which restricts its utility to middle and late waterflood life.
VRR vs. DP PLOT
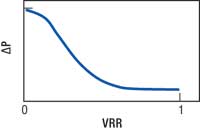 |
Fig. 3. The VRR vs. DP plot helps determine if the water is lost to a thief zone.
|
|
The objective of this plot is to understand the effect of VRR on pressure. As can happen with injection, the water may be lost in some thief zone or to the aquifer. This plot can be a good diagnostic tool, Fig. 3.
As the reservoir is produced, the pressure in the reservoir depletes. Intuitively, as more and more reservoir fluid withdrawn is replaced by injected water, either, the DP, (Pt=0 – Pt=t), will be an increasingly smaller value or it will be zero, when the reservoir approaches its original pressure condition. As the relative pressure differential asymptotically approaches zero, the VRR should approach asymptotically to unity. However, if the cumulative VR is not showing any appreciable decrease in the DP, and the instantaneous VRR is showing VR close to unity, then there might be a condition where the injected water is either siphoned out from the injected layer through a thief zone or channeled into a different layer.
VRR vs. Np/N PLOT
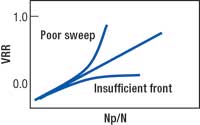 |
Fig. 4. The VRR vs. Np/N plot should produce a linear relationship indicating a good waterflood front displacing the reservoir liquids.
|
|
This is a plot to understand the VRR from the sweep efficiency of the waterflood, Fig. 4. Intuitively, VRR plotted against Np/N should produce a linear relationship, which indicates a good waterflood front displacing the reservoir liquids and sufficient producers to recover the displaced liquid (oil and water). Otherwise, it signifies that every unit volume of injected water pushes a unit liquid volume out of the system. However, since the natural systems are not so well behaved, a non-linear relationship is normally observed. If the curve takes an asymptotic turn towards the VRR axis, then the injected water is not aiding oil production. This may be due to:
- Non-formation of a stable flood front
- Poor reservoir sweep
- A thief zone
- An aquifer taking injected water.
On the other hand, if the curve takes an asymptotic turn towards the Np/N axis, then the water injected is not enough to yield results and the reservoir is producing on its own.
VRR SITUATIONS
The formation volume factor for VRR calculation is normally some reference pressure. This brings subjectivity into the VRR computation process. For example, if the reference pressure is the start of the water injection process and if water injection is initiated at a pressure much below the initial reservoir pressure or the bubble point pressure, then even though the computed VRR is unity, the volumetric replacement is not exact. This means the process will not sufficiently address depletion problems. Other ironic situations can occur:
- Even though the instantaneous voidage is unity, the cumulative or reservoir wide voidage replacement may be far from unity
- Even though a unity in cumulative voidage replacement should reflect a complete re-pressurization of the reservoir, it may not be the case
- VRR assumes a homogeneous reservoir; however, reservoirs are rarely homogeneous
- A heterogeneous reservoir may mean that VR may be more than unity at some places, and less than unity at some other places
- Because producer and injector distribution, there can be aberrations in real-time VR
- There can be thief zones or fractures that seriously affect VR
- If the reservoir is underlain by water, then it may lose water to the aquifer, which can distort VR.
The intrinsic factors affecting flow through porous media will always dictate the injection and production process. Therefore, reservoir properties, porosity, permeability, heterogeneity, fluid properties, reservoir disposition, geological complexity etc. will have a bearing on the VR process.
SUMMARY
VRR has been widely used as a method of reporting the performance of the water injection process. The analysis of the calculation methodology for VRR indicates that the start condition of the water injection process and the conditions envisioned in the initial plan have a significant bearing on estimated VRR.
The VRR analysis indicates that it can be a useful quick-look tool to evaluate the performance of the water injection process, either for pressure maintenance or for the waterflooding process. As a surveillance technique, it can aide in the evaluation. However, there are pitfalls associated with the estimate of VRR. 
ACKNOWLEDGEMENT
The authors thank ONGC for allowing publication of this article. The authors also express their gratitude to the asset manager, Mehsana Asset, ONGC for his support and guidance. Thanks also to Mehsana subsurface team members for their opinions.
LITERATURE CITED
1 Thakur G. C. and A. Satter, Integrated Water Flood Asset Management, PennWell, 402 pp., 1998.
2 Craft, B. C., M. Hawkins and R. E. Terry, Applied Petroleum Reservoir Engineering, Prentice Hall PTR, 464 pp., 1991.
|
THE AUTHORS
|
|
Binayak Agarwal earned degrees in petroleum engineering from Imperial College, London, UK, and in applied geology from Indian Institute of Technology, Roorkee, India. He has nine years of petroleum industry experience in reservoir management, surveillance and analysis waterflood scheme, well test interpretation, well performance evaluation, and fluid dynamics. Agarwal is a reservoir engineer in a multidisciplinary team sub-surface team of Mehsana Asset, ONGCL.
|
|
|
Jai Nath Ram earned an MS degree in geology from Banaras Hindu University, Varanasi, Uttar Pradesh, India. He has 23 years of petroleum industry experience in basin mapping and modeling, integrated geological modeling, basin analysis, integrated reservoir management, and production management, and has many publications in national and international journals. Ram is deputy general manager (geology) and area manager of Mehsana Asset, ONGCL.
|
|
| |
R. N. Bhattacharya earned an MS degree in physics and geophysics from Banaras Hindu University, Varanasi, Uttar Pradesh, India. He has over 30 years of petroleum industry experience in integrated asset management, waterflood asset management, in-situ combustion, reservoir management and field development, and has many publications in national and international journals. Bhattacharya in deputy general manager (reservoir) and is the sub-surface manager of Mehsana Asset, ONGCL.
|
|
|