LWD/ MWD Formation Evaluation
Recent advances in LWD/ MWD and formation evaluation
Developments include wireline and while-drilling logging, autotuning NMR technology, radial acoustic measurements and 3D digital core-evaluation methods.
Stephen Prensky, Consultant, Silver Spring, Maryland
Most recent advances in logging, MWD and formation evaluation can be grouped into four general categories by primary application.
Well construction, particularly geosteering, is benefiting from advances in real-time acquisition of drilling and logging data in a wide variety of borehole and drilling environments. Enabling technologies include advanced telemetry systems (acoustic, mud-pulse, wired drillpipe); new methods for tool deployment (through the bit, tractor and pipe conveyed); more compact logging platforms and integration of more measurements in both wireline and LWD; azimuthal LWD measurements and imaging techniques; pore pressure-while-drilling; and seismic-while-drilling.
Anisotropy is always present in the subsurface. Resistivity anisotropy is primarily a function of thin bedding, while acoustic anisotropy can be a fracture indicator. Improvements in anisotropy evaluation benefits production by identifying low-resistivity pay and natural fractures, improving completions (fracture stimulation) and predicting borehole instability (stress analysis). Enabling technologies are wireline acoustic crossed-dipole devices, LWD quadrupole shear, multicomponent (triaxial) induction devices; and, at the processing level, resistivity inversion methods for both wireline and LWD tools.
Accurate in-situ identification and evaluation of reservoir pore fluids is, of course, essential. Enabling technologies are new and improved wireline and while-drilling NMR, formation testers, downhole resistivity, optical, IR, and NMR analyzers.
Optimized field management is increasingly achieved by monitoring reservoir fluid movement and saturation changes during production via wireline and/or permanent sensors. Enabling technologies are new and advanced cased-hole measurements (acoustic, resistivity, pulsed-neutron); near-well, cross-well, and interwell imaging and tomography; permanent resistivity and fiber-optic acoustic, and temperature sensors.
Some specific advances discussed here are: In MWD/ LWD – depth accuracy, new telemetry methods, pulsed-neutron formation evaluation, directional resistivity, and pressure-while-drilling. In formation testing – a new single-probe pressure-only tool, and downhole fluid evaluation. In wireline logging – electrokinetic logging, radial acoustic imaging, openhole pulsed-neutron logging, and an autotuning NMR device. Within coring and analyses, there is high-resolution digital imaging, and 3D digital petrophysical evaluation. Also included are gas hydrate formation evaluation and data uncertainty analysis.
MWD/ LWD
Depth accuracy. Depth accuracy remains a serious concern in the logging industry and there is no consensus for reconciling wireline and LWD depth. Baker Atlas has proposed a new approach, using experience gained with directional-survey measurements, for quality control and quantification of uncertainty in measured depth (MD), wireline and LWD depth measurements.1,2,3 They propose a model for quantifying uncertainty in MD and also show that applying even simple weight-on-bit and drillpipe-stretch corrections to LWD logs results in significant improvement.
Telemetry. The viability of Grant Prideco’s “intelligent” wired-pipe telemetry system was demonstrated in two field tests using an existing MWD drilling dynamics tool.4 At a transmission rate of 5 kbit/sec, a fraction of the full 2 Mbit/sec capability, the telemetry system provided 13, 8-bit updates per second. A third field test will deploy a full suite of MWD/ LWD measurements. Baker Hughes has been providing the downhole MWD/ LWD technology that interfaces with the telemetry drill-pipe system.
Halliburton is conducting field tests of its LWD Acoustic Telemetry (LAT) system.5 This wireless system – based on the earlier Acoustic Telemetry System (ATS) – uses acoustic signals carried along the drill pipe for real-time transmission of LWD/ MWD data. A downhole transmitter above the LWD string generates acoustic waves that propagate along the drill pipe to a surface receiver. At certain frequencies, constructive interference involving the acoustic reflections generated by the pipe joints and BHA allows the carrier signal to pass up the drillstring, instead of suppressing it. At these carrier frequencies (400 Hz to 2 kHz), signal strength up the drillstring is reduced only by passive attenuation.
Because transmission data rate is directly related to signal-to-noise ratio, the system has been designed to mitigate environmental noise. Results indicate that at the same bit-error rate accepted in mud-pulse telemetry, this system has the potential for transmitting up to several hundred bits per second under typical drilling conditions – a multifold increase over current rates.6
Deep-reading resistivity. Deeper-reading measurements provide earlier indications of approaching fluid contacts and bed boundaries, especially in thin reservoirs or oil rims. This information enables rapid and accurate adjustments in a borehole trajectory to stay within the target. DeepTrak, the latest service in Baker Hughes Inteq Trak while-drilling system, was developed in collaboration with Norsk Hydro. This propagation-resistivity tool can detect bed boundaries as far as 39 ft from the borehole, several times greater than conventional LWD resistivity tools. Greater depth of investigation is achieved through lower operating frequencies (20 kHz and 50 kHz) and longer transmitter-to-receiver (TR) spacings (39 and 58 ft), Fig. 1.
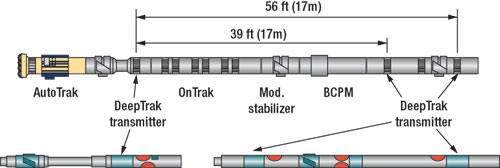 |
Fig. 1. Bottomhole assembly containing the Baker Hughes DeepTrak tool. In this illustration, the conventional dual-frequency LWD resistivity tool (OnTrak) is positioned between the DeepTrak transmitter and receiver subs.7
|
|
A range in radial depth of investigation, from 3.3 to 39 ft, is possible when DeepTrak is run in combination with a conventional, dual-frequency propagation resistivity tool, Fig. 1. Using this combination, six resistivity measurements are transmitted in real time: 2 MHz phase shift, 400 kHz attenuation, 20 kHz and 50 kHz phase shift and attenuation.7
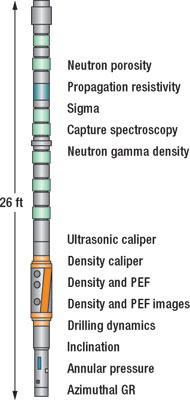 |
Fig. 2. Schlumberger EcoScope LWD tool.8
|
|
Schlumberger SCOPE LWD system. Schlumberger has introduced Scope, its new LWD system. This system consists of four new tools: LWD (Ecoscope), geosteering (PeriScope 15), telemetry (TeleScope), and formation pressure (StethoScope). The LWD and geosteering tools are of particular interest here.
Formation evaluation. EcoScope is a compact, single-collar tool that integrates LWD propagation resistivity and sourceless nuclear porosity with drilling-related sensors. The service uses technology developed through collaboration between Schlumberger and Japan Oil, Gas and Metals National Corporation. The 6.75-in. tool is 26-ft long (Fig. 2) and rated to 20,000 psi and 300°F. The shortened bit-to-sensor distance reduces environmental effects on the measurements and places the nuclear measurements twice as close to the bit (50 ft) as previous tools. The elimination of chemical sources and multiple drill collars reduces operational risk.
Drilling measurements include inclination, annular static and dynamic pressure, temperature, triaxial shock and vibration. The tool has ultrasonic and density calipers. A side-loaded, high-energy pulsed-neutron generator provides azimuthal gamma-ray, azimuthal density and azimuthal neutron porosity, formation capture cross-section (sigma) and neutron-capture spectroscopy. New data-interpretation software can perform elemental analysis for quantitative lithology determination. Measurements are acquired every 6 in., up to an ROP 450 ft/hr or 900 ft/hr (resistivity).8
Geosteering. PeriScope 15 is a deep-reading directional propagation-resistivity device capable of detecting bed boundaries and fluid contacts up to 15 ft away from the borehole. While the tool is specifically designed for geosteering, it is also capable of formation evaluation. The tool comprises a symmetrical sensor array of six transmitters and four receivers. Five transmitter antennas are arranged axially along the tool, and one transmitter is positioned transversely. One pair of receiver antennas is positioned in the center of the tool and arranged axially, and a second pair positioned at each end of the tool with the receivers tilted 45° to the tool axis, Fig. 3.
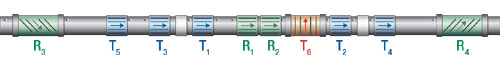 |
Fig. 3. Schlumberger’s PeriScope 15 antenna design. Illustration shows the position of the axial and directional transmitters (T) and receivers (R).10
|
|
The axially positioned coils provide conventional propagation-resistivity measurements at four spacings (96, 84, 34 and 22 in.) and three frequencies (100 kHz, 400 kHz and 2 MHz). The nonaxial coils provide directional (azimuthal) measurements at an effective spacing of 59 in. at two frequencies (100 kHz and 400 kHz). Changes in phase-shift and attenuation-resistivity polarity are used to indicate the position of a bed boundary relative to the tool.9 The directional measurements, provided by the nonaxial coils, are sensitive to, and can be used for, characterizing resistivity anisotropy, and they permit shoulder-bed correction of measured formation resistivity.
Formation tester. Schlumberger is testing a new formation-pressure-while-drilling service called StethoScope. The probe is embedded in a stabilizer blade. When the stabilizer blade is forced against the formation during a pause in drilling, the probe extends and a sealing element serves as a packer. The tool is built into a 6.75-in. drill collar with stabilizer diameters of 8.25-in. and 9.25-in. and is powered by the mud turbine in the telemetry tool during circulation and by battery power when the mud pumps are off.
The stabilizer design directs mud away from the probe to minimize mudcake erosion and filtrate leakage into the formation. Mud-pulse telemetry provides two-way data communication for operating the tool. An electromechanical pretest system controls pretest rate and volume. Four fixed-mode pretest sequences (sandface buildup and drawdown pressure) are available. Pressure gauges continuously monitor annular pressure. Downhole memory stores up to 100, 5-min. tests.11
FORMATION TESTING
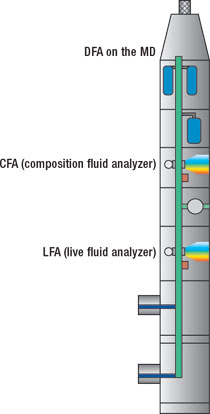 |
Fig. 4. Downhole Fluid Analysis (DFA) is performed using data from the LFA and CFA modules on the Schlumberger MDT. Positioning the analyzers to straddle the pumpout greatly enhances DFA.13
|
|
Wireline testing. Schlumberger announced a new single-probe tool solely dedicated to formation-pressure measurements. This 3.375-in. tool has been designed for operational efficiency in wells where the reservoir fluid type and contacts are already known. It can operate in boreholes ranging from 4.75 to 15 in. and over a wide range of formation permeability, down to 0.01 md. It has a new mechanism that provides improved stability and accuracy of the pretest rate and volume and, unlike previous tools, this device can pass through wireline telemetry which allows it to be placed anywhere in the logging tool string.12
In-situ fluid analysis. Schlumberger’s Downhole Fluid Analysis (DFA) is an interpretation product that uses the near-infrared spectroscopy data obtained by the Live Fluid Analyzer (LFA) and Composition Fluid Analyzer (CFA) MDT modules (Fig. 4) to provide in-situ compositional analysis (type and properties) of formation fluid samples.13 This information is useful for identification of compositional grading (variation in composition with depth), compartmentalization, and for flow assurance. The results of multiple DFA station measurements can be presented in the form of a continuous downhole fluid log.
A new pH sensor deployed on the MDT can distinguish formation water from mud-filtrate contamination in fluid samples.14 A pH-sensitive tracer dye is injected into the flowline while the sample is entering the tool. A pH-induced color change is detected with an optical fluid analyzer. The pH of the mud filtrate is typically much greater than the pH of the formation water. Fluid pH can also characterize oil/ water transition zones. Data from this sensor can be integrated into the DFA (described above).
Shell proposed procedures for capturing and preserving the hydrogen sulfide (H2S) content in FT fluid samples, techniques for accurate surface analysis, and discussed development of an in-situ H2S sensor.15 Accurate determination of H2S content is critical to avoidance of operational hazards and production problems and for determining oil market value. Currently, the loss of H2S in fluid samples due to reaction (absorption/ adsorption) with the FT tool’s metal components commonly results in an underestimation of true H2S content, especially at very low H2S levels. The proposed workflow entails modification of the FT flowline, pumping unit and sample chambers using nonreactive or inert materials.
WIRELINE LOGGING
Electrokinetic logging. Following on the work of Oyo and Groundflow Ltd. in groundwater applications, reported here in 2003, additional research by Sondex suggests that acoustically generated electrokinetic (EK) signals have the potential for in-situ, porosity-independent permeability determination and greater sensitivity to low mobility (low permeability) than Stoneley-derived permeability.16 The Stoneley-induced electrical field generated by an acoustic source is related to permeability, i.e., the ratio of EK field to Stoneley-induced pressure, and is relatively insensitive to porosity. Sondex has built a prototype electrokinetic logging tool to test laboratory results and a new finite-element electrokinesis model. Tests in water wells and in the Callisto research boreholes show good repeatability and encouraging correlations with permeability from cores and tests. Further research is required to prove the potential.
Acoustic logging. Schlumberger’s Sonic Scanner is a 3.625-in. modular, azimuthal, crossed-dipole tool designed for radial acoustic profiling. The receiver array consists of 13 axial stations of 8 azimuthal receivers each. The stations are 6-in. apart and provide T-R short spacings ranging from 1 to 7 ft, and T-R long spacings of 11 to 17 ft. This multipole tool uses a new wide-bandwidth (300 Hz to 8 kHz) dipole transmitter for crossed-dipole mode and three monopole transmitters (300 Hz to 25 kHz) that allow a high-frequency CBL cement-evaluation mode, a standard frequency BHC and long-spaced-sonic P- and S-wave mode, and low-frequency monopole Stoneley-wave mode.
The azimuthal measurements allow radial imaging of acoustic parameters and measured properties. Radial profiling of Stoneley- and dipole-shear slowness can identify formation damage (i.e., reduced permeability). Improved electronics and signal processing provide increased accuracy in permeability estimation (Stoneley and refracted shear) and detection of very low stress-induced anisotropy. The large T-R spacings allow near-well imaging of acoustic reflectors (e.g., bed boundaries, faults, fluid fronts), up to 25 ft away from the borehole.17,18
Nuclear logging. Halliburton has developed environmental corrections for openhole use of pulsed-neutron carbon/ oxygen tools. These corrections translate the openhole measurements to standard cased-hole conditions (7-in. casing in a 10-in. borehole) to allow the use of standard interpretation software for determining oil saturation.19 To date, openhole pulsed-neutron applications have been primarily in barefoot completions where water injection has resulted in formation fluids of unknown salinity.
NMR. The latest tool in Schlumberger’s CMR series automatically tunes and corrects the operating frequency for changes in the static magnetic field (B0). Changes in the operating frequency directly affect the Lamor frequency and, thus, the ability of the tool to accurately measure porosity. The primary cause of frequency drift is metallic drilling debris adhering to the tool’s powerful permanent magnets, Fig. 5. Frequency drift can also occur where low formation porosity (< 5 p.u.) results in low measured-signal amplitude, in high borehole temperatures (BHT > 135°C), and in conductive muds (Rm < 0.05 W-m). Distortion in the out-of-phase echo signal serves as an indicator of drift and allows continuous monitoring of frequency drift. Whenever changes in B0 exceed a specified threshold, a feedback loop automatically adjusts the operating frequency.
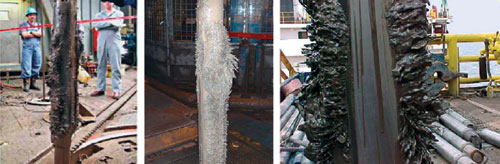 |
Fig. 5. Metallic debris adhering to an NMR tool’s permanent magnet.20
|
|
A second feedback loop maintains the antenna at resonance frequency. Additional features of this tool – including increased echo acquisition capability (d 16,000), experiment wait time (up to 26 sec) and shorter echo spacing (e 200 µsec) – extend the tool’s application range, especially for complex fluid evaluation.20
CORING AND ANALYSES
High-resolution digital images. High-resolution (1,200-dpi) digital images of slabbed core offer the equivalent of 10X magnification and permit core analysis at any location with Internet access. This resolution is sufficient for core-plug selection and determination of net reservoir, sedimentary fabric, fracture density and orientation. Image-analysis techniques can determine grain-size distribution and determination of net pay is possible with the addition of digital UV imagery. Permeability can be estimated using a relationship between modal grain size and porosity and a continuous permeability log is possible when core-plug measured permeability or thin-section data are available for calibration.21
3D digital evaluation. New X-ray CT technology and computer visualization techniques developed at the Australian National University Department of Applied Mathematics, enable 3D petrophysical examination and evaluation of core.22 A high-resolution X-ray microcomputed-tomography system is used to scan core plugs up to 5-cm diameter, generating 3D tomographic images of 2,0483 voxels at resolutions up to 2 microns (cf. 1 – 2 mm for conventional CT equipment).
Representative core subsamples (5-mm dia.) are typically used to keep computing time to an acceptable level. Mathematical and image-analysis techniques identify mineral and pore phases. Petrophysical properties, calculated directly from the digitized CT images (e.g., porosity, permeability, sorting, grain-size distribution, formation factor, drainage capillary pressure), are in good agreement with SCAL results on the same cores. This methodology may offer a solution for predicting the petrophysical properties of material unsuitable for laboratory testing, such as cuttings and friable or fractured core.
NMR properties are studied by partitioning the pore space into multiphase fluid distributions by simulating drainage (Fig. 6) and then using an NMR simulator to simulate NMR response of the core image. These methods are being used to test the validity of existing empirical correlations between permeability, grain-size distribution, porosity, and surface-to-volume, sorting, and capillary pressure.23,24 This may lead to improved core and log evaluation.
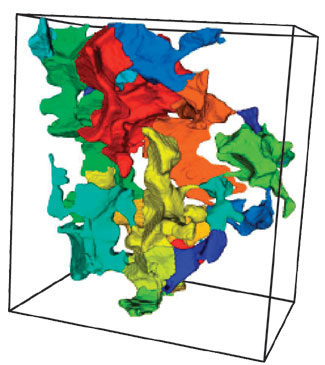 |
Fig. 6. 3D visualization of pore partitioning using X-ray CT tomograms. The figure shows only the pore network contained in a 2003-voxel cube of core. Colors represent different aspects of pore space, e.g., void or pore-fluid type.23
|
|
GENERAL
Data uncertainty in logging and petrophysics. Quantifying the uncertainty inherent in measured core and log values, as well as understanding the limitations of different methodologies, is essential to accurate data interpretation and quantitative determination of reservoir saturation and pore volume. Yet these data are commonly provided without uncertainty quantification. The primary sources of uncertainty are tool response, data acquisition (technology and methodology) and the interpretation model. A paper by ExxonMobil, an outgrowth of the 2004 SPWLA Topical Conference on high-angle/ horizontal wells, demonstrates that uncertainty increases with increasing well angle relative to the rock formations. In some cases, especially at and above 80°, quantitative formation evaluation of high-angle and horizontal boreholes may not be possible.25 Another paper, using Monte Carlo simulation, demonstrates that choosing an inappropriate interpretation model may result in excessive uncertainty and unusable data.26
Gas hydrates. The number of formation-evaluation and petrophysical studies of gas hydrates has increased with the expanded international research effort to characterize and produce gas hydrates, a potentially enormous hydrocarbon resource.27 In addition to scientific interest, strong industry interest in gas hydrates is reflected in the special technical sessions held at the annual meetings of AAPG and OTC.
In 2005, the encouraging results from the 2002 Gas Hydrate Production Research Well Program in the Mackenzie Delta, were published by the Geological Survey of Canada in Bulletin 585.28 Additionally, related papers were presented at SPWLA.29,30 Also in 2005, the 5th International Gas Hydrate Conference, a quadrennial meeting covering all aspects of gas hydrates, was held in Trondheim, Norway.31 
LITERATURE CITED
1 Wilson, H., et al., “Depth control: Reconciliation of LWD and wireline depths, standard practice and an alternative simple but effective method,” paper SPE-89899, SPE Annual Technical Conference and Exhibition, Houston, 2004.
2 Lofts, J., et al., “Reconciling depth effectively between wireline and LWD: Use and case histories of a new improved method for handling depth,” paper BBB, 46th SPWLA Annual Logging Symposium, 2005.
3 Brooks, A., et al., “Quantification of depth accuracy,” paper 95611, SPE Annual Technical Conference and Exhibition, Dallas, Texas, 2005.
4 Reeves, M.E., et al., “Intelligent drill string field trials demonstrate technology functionality,” paper SPE/ IADC-92477, SPE/ IADC Drilling Conference Proceedings, Amsterdam, 2005.
5 Shah, V., et al., “Design considerations for a new high data rate LWD acoustic telemetry system,” paper SPE-88636, SPE Asia Pacific Oil and Gas Conference and Exhibition, 2004.
6 Gao, L., et al., “Limits on data communication along the drillstring using acoustic waves,” paper SPE-95490, SPE Annual Technical Conference and Exhibition, Dallas, Texas, 2005.
7 Helgesen, T. B., et al., “Accurate wellbore placement using a novel extra deep resistivity service,” paper SPE-94378, SPE Europec/ EAGE Annual Conference, 2005.
8 Weller, G., et al., “A new integrated LWD platform brings next-generation formation evaluation services,” paper H, 46th SPWLA Annual Logging Symposium, 2005.
9 Li, Q., et al., “New directional electromagnetic tool for proactive geosteering and accurate formation evaluation while drilling,” paper UU, 46th SPWLA Annual Logging Symposium, 2005.
10 Chou, L., et al., “Steering toward enhanced production,” Schlumberger Oilfield Review, Vol. 17, No. 3, Autumn, 2005, p. 54 – 63.
11 Pop, J., et al., “Operational aspects of formation pressure measurements while drilling,” paper SPE/ IADC-92494, SPE/ IADC Drilling Conference, Amsterdam, 2005.
12 Marin, Y., Jacobson, A., and Codera, J., “A new generation of wireline formation tester,” paper M, 46th SPWLA Annual Logging Symposium, 2005.
13 Mullins, O.C., et al., “Compartment identification by downhole fluid analysis,” Petrophysics, Vol. 46, No. 4, 2005, pp. 302 – 312.
14 Raghuraman, B., et al., “Downhole pH measurement for WBM contamination monitoring and transition zone characterization,” paper SPE-95785, SPE Annual Technical Conference and Exhibition, Dallas, Texas, 2005.
15 Elshahawi, H., and M. Hashem, “Accurate measurement of the hydrogen sulfide content in formation fluid samples – case studies,” paper SPE-94707, SPE Annual Technical Conference and Exhibition, Dallas, Texas, 2005.
16 Singer, J., et al., “Electrokinetic logging has the potential to measure permeability,” paper TT, 46th SPWLA Annual Logging Symposium, 2005.
17 Pistre, V., et al., “A modular wireline sonic tool for measurements of 3D (azimuthal, radial, and axial) formation acoustic properties,” paper P, 46th SPWLA Annual Logging Symposium, 2005.
18 Sinha, B., et al., “Optimal well completions using radial profiling of formation shear slownesses,” paper SPE-95837, SPE Annual Technical Conference and Exhibition, 2005.
19 Jacobson, L.A., “Carbon/ oxygen tool response in open hole,” paper RR, 46th SPWLA Annual Logging Symposium, 2005.
20 Minh, C.C., et al., “Field test results of the new combinable magnetic resonance autotune logging tool,” paper SPE-96759, SPE Annual Technical Conference and Exhibition, Dallas, Texas, 2005.
21 Prince, C.M., Dixon, M.W., and Haynes, L.L., “The use of high-resolution core imagery in reservoir characterization: An example from unlithified Miocene turbidites,” paper SCA2005-02, Society of Core Analysts Annual International Symposium, 2005.
22 Knackstedt, M.A., et al., “Digital core laboratory: Properties of reservoir core derived from 3D images,” paper SPE-87009, SPE Asia Pacific Conference on Integrated Modelling For Asset Management, 2004.
23 Arns, C., et al., “NMR petrophysical predictions on digitized core images,” paper MMM, 46th SPWLA Annual Logging Symposium, 2005.
24 Ghous, A., et al., “Resistivity and permeability anisotropy measured in laminated sands via digital core analysis,” paper VVV, 46th SPWLA annual logging symposium, 2005.
25 Rendeiro, C., Passey, Q., and H. Yin, “The conundrum of formation evaluation in high-angle/ horizontal wells – observations and recommendations,” paper SPE-96898, SPE Annual Technical Conference and Exhibition, 2005.
26 Adams, S.J., “Quantifying petrophysical uncertainties,” paper SPE-93125, SPE Asia Pacific Oil and Gas Conference and Exhibition, 2005.
27 Collett, T.S., “Results at Mallik highlight progress in gas hydrate energy resource research and development,” Petrophysics, Vol. 46, No. 3, 2005, pp. 237 – 243.
28 Dallimore, S.R., and T.S. Collett, “Scientific Results From the Mallik 2002 Gas Hydrate Production Research Well Program, Mackenzie Delta, Northwest Territories, Canada,” Geological Survey of Canada Bulletin 585, 2005, 140 p. + DVD. http://gsc.nrcan.gc.ca:80/gashydrates/mallik2002/bulletin585_e.php
29 Anderson, B.I., T.S. Collett, R.E. Lewis, and I. Dubourg, “Using open hole and cased hole resistivity logs to monitor gas hydrate dissociation during a thermal test in the Mallik 5l-38 research well, Mackenzie Delta, Canada,” paper SS, 46th SPWLA Annual Logging Symposium, 2005.
30 Murray, D., et al., “Formation evaluation of gas hydrate reservoirs,” paper SSS, 46th SPWLA Annual Logging Symposium, 2005.
31 5th International Gas Hydrate Conference Proceedings. http://www.icgh.org
|
THE AUTHORS
|
 |
Stephen Prensky has 32 years’ experience in petroleum geology and petrophysics. He has worked for Texaco, US Geological Survey and Minerals Management Service, and now works as a consultant to logging service companies. He has served as SPWLA vice-president of Technology, as editor of SPWLA’s Petrophysics, and now serves on the SPWLA Technology Committee and the SPE Formation Evaluation Committee. His annual “Bibliography of Well-Log Applications” has been published by SPWLA for 20 years. He is a member of AAPG, SPE and SPWLA.
|
|
|

