Drilling Technology
Gulf of Mexico operator eliminates unneeded casing string
Real-time well hydraulic monitoring and pore-pressure updating optimize drilling.
Ed Tollefsen, Sheila Noeth, Roger B. Goobie, Colin Sayers, Lennert den Boer, Pat Hooyman, Goke Akinniranye, Schlumberger; Jay Cooke, Helis Oil & Gas Company, L.L.C.; Ron Thomas and Edgar Carter, PPI Technology Services
A combination of Logging-While-Drilling (LWD) services, coupled with a pre-drill pore pressure model, provides significant insight into well stability and pressure monitoring. This allows pore pressure prediction updating, while reducing drilling uncertainty, and optimizing both drilling and casing points. By using this methodology the operator drilled in a very tight hydraulic envelope and eliminated a string of casing.
Using LWD technologies, a new methodology optimized drilling on a Gulf of Mexico (GOM) Vermillion 338 well. Continuously updated LWD annular pressure measurements gauge wellbore pressures and help the driller rapidly intervene in pressure and/or geomechanical wellbore stability issues. A complete understanding of the hydraulic forces on a borehole can increase ROP, provide greater safety, minimize casing strings, reduce or eliminate kicks and formation fracturing, and allow faster and less expensive completions.
The technique allowed the operator to incorporate real-time measurements into a pre-drill model, reducing uncertainty. The operator was able to extend both the 9-5/8-in. intermediate casing and 7-in. liner to TD. As a result, a critical casing string was pushed 1,287 ft deeper than planned, and a pre-planned 5-in. liner was eliminated. This saved casing expense, as well as slimhole drilling and completion costs.
The methodology used streaming data from the downhole tools through mud-pulse telemetry via satellite to an Operation Support Center (OSC) for real-time drilling operations. OSC personnel monitored and updated the wellbore hydrodynamics and earth model, incorporating observations during drilling. The results, along with mud weight recommendations, were sent to the rig, and the appropriate action was taken to ensure that surface mud weight, Equivalent Circulating Density (ECD) and Equivalent Static Density (ESD) were kept within pore pressure and fracture gradient limits.
In the past, engineers used wireline formation pressures and interval velocity data to update the compaction-driven, pore pressure model at the end of the drilled section. This technique is often used in areas such as the GOM, where compaction disequilibrium is the most important cause of overpressure.1
The technique’s limitations include:
- A lack of formation pressure data while drilling
- No accounting for variations and/or divergence in the actual pore pressure from pre-drill models
- Under- or over-estimated computed pore pressure (If the velocity-to-pore-pressure transform is not correctly established, underestimation can lead to avoidable well control incidents, while over-estimation can impede optimal casing point selection and reduce the chances of completing the well).
A critical success factor was the combination of LWD technology, and continuous communication between the rig and the OSC. Within minutes engineers analyzed LWD sonic and formation pressure data, then calibrated the velocity-to-pore-pressure transform, reducing the geopressure model’s uncertainty.
Sonic data (Dt) was the primary pore pressure indicator in the undercompaction model, because this measurement is less affected by temperature and salinity than resisitivity. The variation of velocity with depth for normally pressured sediments was established during the pre-drill phase, using an inversion technique2,3 that takes the errors in the offset well data into consideration. This was re-calibrated using the direct pressure measurements from the formation pressure-while-drilling tool and LWD sonic data. This invesion avoids an inappropriate normal compaction trend, such as a linear best fit.
Using the LWD formation pressure tool to calibrate the formation pressure prediction derived from the LWD sonic increased the confidence in the real-time geopressure prediction model. The calibrated transform was then applied to revise and update the pre-drill pore pressure model, both behind and ahead of the bit. The pre-drill model uses velocities extracted from a 3D Mechanical Earth Model (MEM) of the northern GOM.4 The 3D cube includes velocity data from checkshots and sonic logs released by the Minerals Management Service (MMS). The data is kriged to give a 3D velocity model over the northern GOM, Fig. 1, with uncertainty estimates.
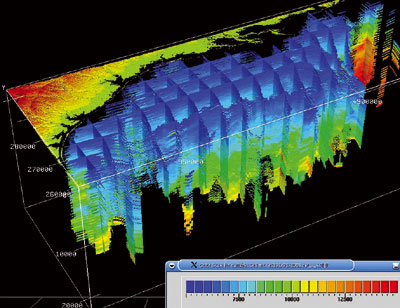 |
Fig. 1. Velocity model (in ft/s) obtained by trend krigging inverted checkshots and sonic logs wells released by MMS.
|
|
BACKGROUND
The operator approached a turnkey company to drill a prospect in Vermillion Block 338. After studying the potential risks, the turnkey company insisted on running a 7-5/8-in. liner and 5-in. liner to TD. This option would have mitigated some drilling risk, but with a substantial increase to the project cost.
Using real-time LWD measurements to optimize drilling, the operator thought a string of casing could be eliminated by extending the depth for the 9-5/8-in. intermediate casing string and for the planned 7-in. liner to TD. If successful, this would eliminate the 7-5/8-in liner. Because there was no longer a need for a pass-through diameter to accommodate a 5-in. liner, a less expensive 7-in liner was used. This saved casing cost and avoided slimhole drilling and completions.
The pre-drill pore pressure model was available on the rig and in the OSC. Velocities used in the model were extracted from the MEM into a 1D pre-drill model for the well. The measurements from the LWD suite provided annular pressure, sonic, formation pressures, gamma ray and resistivity, together with the rig surface data. These were used to update and refine the pressure model while drilling.
Combining the pre-drill model with the LWD data allowed the drilling team to better understand the well’s hydrodynamics. The LWD annular pressure tool provided swab and surge pressures from the ESD minimum and ESD maximum data points, and information on annular hole-loading. Engineers used the LWD velocity information to define the geopressure predictions in the shales and update the pre-drill model. The LWD formation pressure tool gave formation pressures in permeable formations, which were used for model calibration and updating. The gamma ray tool assisted with lithology, while the resistivity data gave an independent pore pressure estimate, Fig. 2.
 |
Fig. 2. Real-time pore pressure work flow allows for a reduction in uncertainty.
|
|
PORE PRESSURE DETERMINATION
The pre-drill pore pressure model was based on interval velocities extracted from the MEM. Elastic wave velocities normally increase during compaction, due to porosity reduction and increased grain boundary contact. Since any pore pressure above hydrostatic reduces compaction, elastic wave velocities can help predict pore pressure, shown by Pennebaker5 and Hottman and Johnson.6 Most pore pressure prediction methods are based on Terzaghi’s7 effective stress principle. This implies that elastic wave velocities are a function of the effective stress tensor, which is defined as the difference between the total stress tensor and the pore pressure, p. In the current work, the authors assumed that elastic wave velocity is a function only of the vertical effective stress, s, and Terzaghi’s relationship can be written as:
| |
 |
(1) |
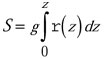
The vertical component, S, of the total stress is assumed to be the weight of the rock matrix and the fluids in the pore space overlying the interval of interest. S is calculated by integrating the bulk density from the surface to the specific depth:
| |
 |
(2) |
where r(z ) is the density at depth, z, below the surface and g is the acceleration, due to gravity.
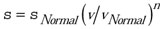
Effective stress methods commonly used to predict pore pressures include those of Bowers8 and Eaton.9 Eaton’s method is widely used in the industry and estimates the vertical component of the effective stress, s, from the P-wave seismic interval velocity, v, using the relation:
| |
 |
(3) |
sNormal and vNormal in Eq 3 are the vertical effective stress and seismic velocity that would occur if the sediment was normally pressured, and the exponent, n, describes the velocity sensitivity to effective stress. Data from offset wells in the area of interest show that n = 3 gives a good pore pressure estimate. The pressure can then be calculated from Eq 1, given the vertical component of total stress, S.
For this study, Eaton’s method was used following the inversion methodology of Sayers et al.2,3 Eaton’s method uses the deviation of the velocity from the velocity in normally pressured sediments (normal velocity). An inversion using offset well data accurately defines the normal velocity, identifying shallow overpressures. This is in contrast to current methods that fit a normal trend line to velocity vs depth data. The calibration of the transform is based on the misfit between the predicted pore pressure and the measured pore pressure, and is quantified by the root mean square of the residuals.3 An estimate of the inherent uncertainty is given by minimizing and mapping the root mean square with respect to the parameters defining the pore pressure transform.
REAL-TIME UPDATING
To reduce uncertainty, drilling operations closely monitor well conditions and update the pre-drill model with measurements from the LWD tools. This provides new constraints to update the model, Fig. 3. Pressure measurements while drilling and real-time sonic data (red) are used to derive a locally calibrated velocity-to-pore-pressure transform. This is then applied to checkshot velocities (blue), which were extracted from the MEM. By incorporating the calibration data behind the bit, the pore pressure transform is better constrained and uncertainty ahead of the bit is reduced with every update. As a quality control, mud weights from an offset well are also displayed, together with the formation integrity test (FIT) values.
 |
Fig. 3. First model update using pressure measurements and real-time sonic (red curve) to derive a locally calibrated velocity-to-pore pressure transform.
Legend: (a) Velocities: blue – kriged checkshot velocities from GOM 3D cube; red – upscaled sonic velocities from real-time drilling; black – normal velocity model;
(b) Pressures in lb/gal: green – overburden; blue – pore-pressure prediction from kriged checkshot velocities; blue dots – mud weights from an offset well; black dots – LOT from offset well; red line – pore-pressure based on real-time sonic.
|
|
To constrain the pore pressure in deeper sections, the updated transform was applied to the sonic log of an offset well (magenta), Fig. 4. The resulting pore pressure prediction allows for high confidence in the derived transform, shown by agreement between pressure prediction and mud weights at this offset well. Real-time data were continually monitored, allowing daily updates of the velocity-to-pore-pressure transform, Fig. 6. The pore pressure based on the real-time sonic is in very good agreement with the prediction, based on the extracted checkshot velocities, especially for depths below 9,000 ft, TVDSS.
 |
Fig. 4. Second pore pressure update at the drilling location, comparing offset well data with real-time data.
Legend: (a) Velocities: blue – kriged checkshot velocities from GOM 3D cube; red – upscaled sonic velocities from real-time drilling; magenta – upscaled sonic velocities from an offset well;
(b) Pressures in lb/gal: brown – pressure prior to second real-time update; green – overburden (extracted); blue – pore-pressure prediction based on kriged checkshot velocities; magenta – pore pressure prediction based on upscaled sonic from offset well; blue dots – mud weights from an offset well; black dots – LOT from an offset well; red – pore-pressure based on real-time sonic (upscaled sonic log); red dots – real-time pressure measurements.
|
|
12¼-in. SECTION
The objective was to extend the 9-5/8-in. casing point as deep as possible. The operator thought that LWD could provide information to push this depth to 8,500 ft. Based on the turnkey company’s casing program, the 9-5/8-in. casing point coincided with a mud weight of 13.0 lb/gal. According to their pre-drill plan, this would be 7,000 ft. In actuality, the mud weight was 13.0 lb/gal at 6,800 ft; therefore, casing would have been placed 200 ft shallower, Fig. 5.
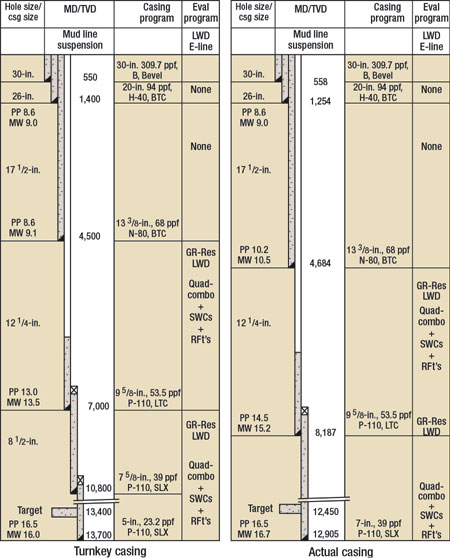 |
Fig. 5. The casing plan from the turnkey company (left) required one additional casing string compared to the casing plan (right) using data from real-time LWD monitoring and an updated pore pressure model.
|
|
Using real-time data, it was possible to monitor the downhole hydraulics and establish a safe mud weight operating margin for extending the 9-5/8-in. casing to 8,187 ft. Prior to making the decision to place casing at 8,187 ft, the ECD was within 0.1 lb/gal of the calculated fracture gradient, Fig. 6. The pore pressure ramp, which began at 6,560 ft, TVD, was confirmed by the LWD sonic, resistivity measurements and from the increase in background gas and cavings observed.
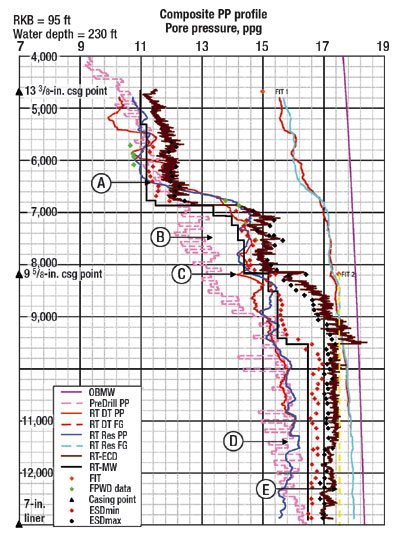 |
Fig. 6. The composite wellbore hydrodynamics profile displays all the data. (a) The top of the pore pressure ramp confirmed by sonic, resistivity and formation pressure while drilling. (b) The discrepancy between 7,000 and 8,000 ft with the pre-drill model (dashed pink line) and the measured formation pressures demonstrates the need to incorporate real-time measurements to reduce pore pressure uncertainty. (c) The annular pressure tool showed the ECD rapidly approaching the fracture gradient. (d) Both the sonic and formation pressure tools were removed from the borehole at 11,400 ft. (e) The maximum ECD, established by FIT at 8,187 ft, was limited to 17.5 lb/gal (yellow dashed line).
|
|
8½-in. SECTION
In this section, the hydrodynamic challenge was more a function of the mud system than the formation overpressure, Fig 6. The FIT at 8,252 ft was 17.5 lb/gal. Modeling indicated that the formation would fail at 18.0 lb/gal. When drilling resumed, the ECD measurements from the annular pressure gauge rose. This was contradictory to hydraulic modeling, which calculated ECD to be 0.4 lb/gal above ESD. The mud weight at surface was 15.5 lb/gal and the ECD was 2 lb/gal higher than the ESD and rising. The initial opinion of the drilling operator was that the strain-gauge readings of the downhole annular pressure sensor were erroneous.
To resolve this, the operator deployed the formation pressure tool to gather three independent annular pressure readings. At 9,500 ft, the pressure was close to fracturing the formation. As the LWD crew began the downlink sequence, they focused on minimizing surge pressures. During downlink, mud losses occurred, and it appeared that the formation had broken down. Well control measures followed for the next three days, including pumping lost circulation material, squeezing the shoe and drilling out.
The drilling team concluded that a failure to the mud mixing system was the reason for the large discrepancy between the ESD and ECD. The water supply to the mud hoppers had been cut off for a number of hours, resulting in improperly hydrated mud being added to the wellbore. This increased the viscosity of the water-based mud system, which increased the pressure seen by the LWD annular pressure tool.
Time-lapse resistivity analysis indicated two depths below the squeezed zone near the casing shoe where the formation may have been damaged. The economics and probability of performing a successful open-hole squeeze job favored drilling ahead. A low-flow MWD tool was used while limiting the ECD to 17.5 lb/gal. Carefully monitoring and maintaining the annular pressures within an accurately calibrated hydraulics envelope gave the operator confidence to complete the well in the target reservoir without a drilling liner. Thus, the 5-in. liner and slimhole completion expense was eliminated.
The target reservoir, expected at 13,400 ft, was fully penetrated by 12,507 ft. Although the operator thought drilling had reached the target at 12,450 ft, a sublease agreement required them to drill to 13,700 ft. This requirement was renegotiated when a rig failure delayed drilling.
LWD sonic data were available to process a real-time synthetic vertical seismic profile (VSP). Instead, the VSP was run from the dipole sonic tool during wireline analysis of the final hole section. The seismic tie showed that the target reservoir had been penetrated. If this had not been the case, the operator would have had to drill ahead and repeat the final hole section’s logging program. Fortunately, the wireline VSP helped verify that the assumed velocities in the interval velocity model were faster than actual velocities, and that the target was hit.
CONCLUSION
The operator achieved the goal of eliminating the 5-in. casing and avoiding a slimhole completion. LWD technologies and OSC services addressed drilling-related issues and pore pressure model updating in real time. This technique affects:
- Lost time from kicks and losses
- Lost-in-hole risk
- Casing seats
- Borehole hydraulics
- Eliminating casing
- ROP
- Drilling practices.
Real-time hydrodynamic monitoring identified fracture points, allowed drilling in a tight mud envelope, and pushed a 9-5-/8-in. casing depth 1,287 ft deeper than planned. This eliminated an entire casing section and saved several rig days.
By measuring true formation pressure and using these to calibrate pore pressures derived from inverted LWD sonic velocity data, the drilling team could update the existing pore pressure model and reduce the uncertainties in the pore pressure prediction ahead of the bit. This feedback and updating of the pre-drill velocity-to-pore-pressure transform with real, measured data represents a step forward in pore pressure prediction. The reduction of risk allows for greater confidence while drilling, and significant cost savings. 
LITERATURE CITED
1 Bourgoyne, A.T. Jr., M.E. Chenevert, K.K. Millhelm and E.S. Young, Jr., Applied Drilling Engineering ,SPE Textbook Series, v. 2, Richardson, Texas, 1991.
2 Sayers, C.M., M.J. Woodward and R.C Bartman, “Seismic pore pressure prediction using reflection tomography and 4C seismic data,” The Leading Edge, pp. 188 – 192, 2002.
3 Sayers, C.M., G.M Johnson and G. Denyer, “Predrill pore pressure prediction using seismic data,” Geophysics, v. 67, n.4, pp. 1286 – 1292, 2002.
4 Sayers, C, L. den Boer, Z. Nagy, P. Hooyman and V. Ward, “Pore pressure in the Gulf of Mexico: Seeing ahead of the bit,” World Oil, pp. 55 – 58, December 2005.
5 Pennebaker, E.S., “Seismic data indicate depth, magnitude of abnormal pressure,” World Oil, 166, pp. 73 – 78, 1970.
6 Hottman, C.E. and R.K. Johnson, “Estimation of formation pressures from log-derived shale properties,” Journal of Petroleum Technology, v. 17, pp.717 – 722, 1965.
7 Terzaghi, K., Theoretical Soil Mechanics, John Wiley & Sons, New York, 1943.
8 Bowers, G.L., “Pore-pressure estimation from velocity data. Accounting for pore-pressure mechanisms besides undercompaction,” SPE Drilling and Completion, v. 10, pp. 89 – 95, 1995.
9 Eaton, B.A., “The equation for geopressure prediction from well logs,” SPE 5544, 1975.
|
THE AUTHORS
|
| |
Ed Tollefsen is a new technology product champion, Drilling & Measurements, at Schlumberger.
|
|
|
Sheila Noeth is a senior reservoir engineer-geologist at Schlumberger, Data & Consulting Services.
|
|
|
Roger B. Goobie is PERFORM/ No Drilling Surprises manager, North and South America, Operations Support Center, at Schlumberger, Drilling & Measurements.
|
|
|
Colin Sayers is a scientific advisor at Schlumberger, Data & Consulting Services.
|
|
|
Lennert den Boer is a senior geomechanics engineer at Schlumberger, Data & Consulting Services.
|
|
|
Pat Hooyman is geomechanics manager at Schlumberger, Data & Consulting Services.
|
|
|
Goke Akinniranye is drilling engineering manager at Schlumberger, North and South America Operations.
|
|
|
Jay Cooke is senior petroleum engineer at Helis Oil & Gas, LLC.
|
|
|
Ron Thomas is president of PPI Technology Services.
|
|
| |
Edgar Carter is a drilling engineer at PPI Technology Services.
|
|
|

