Supply and Demand
Shaping the peak of world oil production
The bell curve has a sharp crest, and you can’t see it coming.
Robert L. Hirsch, SAIC
To gain insight into the potential time-varying shape of world oil production peaking, this author examined regions that have already peaked. Unencumbered regions and countries were considered. All had significant peak production and all are past their peak. Their experience shows that the onset of peaking can occur quite suddenly and is not obvious, even a year prior to the event. The peaking of world conventional oil production may or may not follow previous trends, but these observations may be valuable for planning.
World production of conventional oil will reach a maximum – a peak – and then decline. The timing is uncertain; some think it could occur within a matter of years, others in a decade or two.1 – 11 Without a major effort to mitigate related oil shortages starting well before the onset of peaking, the economic consequences worldwide will be dire.12
By conventional oil, we mean oils of higher gravity that make up over 95% of current world production. The likely world oil production profile before, during and after world conventional oil peaking is almost certainly not predictable, because it will be a function of an array of unknowable factors:
- World economic development prior to peaking
- Oil prices a decade or more prior to peaking
- The application of advanced technology in the world’s largest oil fields
- Damage and past mismanagement of large oil fields
- Oil supply-demand expectations a decade or more before peaking
- Concession and contract policies affecting outside investment
- Political stability in regions with the largest production before peaking
- Geology of major oil producing regions.
A scenario analysis involving these and other variables might be possible, but it is likely to be so complex as to be of questionable value.
BELL CURVE
Modeling of oil production peaking is often based on a bell curve (also known as a normal or logistic curve) an approximation of oil production as a function of time. This approach was utilized by M. King Hubbert in 1956 in his forecast of US oil production peaking.13 Fig. 1 shows the 30-yr interval near the apex of a bell-curve that was fitted to US Lower 48 states conventional oil production by Deffeyes.14 Production data follow the curve closely from 1910 – 1960 and from 1980 – 2003 (not shown here). The curve indicates a peak in 1976, while the actual peak occurred in 1970, as Hubbert predicted.
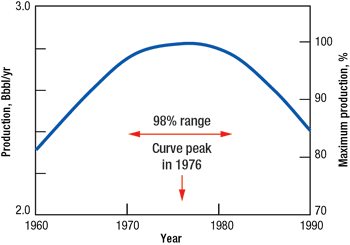 |
Fig. 1. The top of the bell curve is relatively flat over a 10-year period.
|
|
The top of the bell curve in the figure is relatively broad. The period from 98% of maximum on the upslope to the 98% point on the decline side is about 10 years long. If world oil production peaking were to be characterized by such a relatively broad maximum, the task of mitigation would be easier than if the peak were sharp. In addition, a bell curve production profile would provide a degree of forewarning of the approaching peak.
REGIONAL OIL PRODUCTION
Consider what happens in the development of an economically viable oil field. After a confirmed discovery, development proceeds, production rises to a maximum after which it goes into decline. Along the way, oilfield operators apply various technologies to increase production beyond what nature would otherwise provide, e.g., water flooding, fracturing, artificial lift, etc. Nevertheless, the geology of each oil reservoir will ultimately set an upper limit on the amount of oil that can be practically produced. In addition, the time-varying production profile for an oil field can be strongly influenced by management decisions and politics, that can affect oilfield dynamics.
Geographically, large oil production regions contain reservoirs of different sizes and types. Regional output is the sum of all its producing oil fields, which varies over time. An example of regional oil peaking is the US Lower 48 states, Fig. 2.15 This region is of particular interest because it was the world’s most prolific conventional oil production region for much of the 20th century.
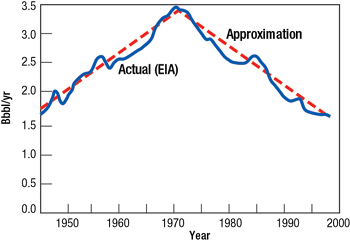 |
Fig. 2. Oil production in the US Lower 48 states 1945 – 2000 shows a triangular profile, not a bell curve shape.
|
|
The dashed lines provide a reasonable fit to the data for the 55-yr period and show a triangular pattern, not the bell curve described earlier. The approximate slope of both dotted lines is 2%. Accordingly, a 2% decline after peaking is a useful benchmark for judging the decline profiles of other regions. A decline of less than 2% could be considered gradual, while a decline of more than 2% could be considered steep.
Some forecasters believe that higher oil prices and new technology will have a dramatic impact on oil production. The Lower 48 experience indicates otherwise. Oil prices increased dramatically in 1973 and 1979, but those price escalations did not alter the general oil production decline in the Lower 48 region, Fig. 3. In addition, the period 1975 – 2000 was characterized by large improvements in oilfield technology, including affordable 3D seismic imaging, low-cost directional and horizontal drilling, greatly enhanced geochemical understanding, dramatically improved geological modeling, etc. Nevertheless, the decline in Lower 48 production continued, essentially unabated. This long-term, real-world experience provides strong evidence to challenge the thesis that high oil prices and advanced technology can mitigate oil production decline.
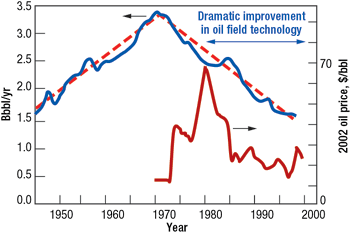 |
Fig. 3. Neither oil price nor advanced technology had a major impact on production.
|
|
No production data set is without numerous complications. In the case of the US Lower 48 states experience, a number of factors beyond price and technology impacted, for example:
- Over the period 1945 – 1970, the Texas Railroad Commission set allowable production in the state, which represented a significant fraction of total Lower 48 production
- After peaking in 1970, low-priced oil from the Middle East entered the US market in increasing volumes, almost certainly affecting domestic oil decision-making
- During the period 1970 – 2000, the US experienced four recessions.
It would be extremely difficult, if not impossible to isolate these and other influences in an effort to develop a clear picture of what production might have otherwise been. In fact, every oil-producing region of the world has been and will be influenced by complex forces that defy definitive isolation and evaluation.
THE LIKELY SHAPE
Not all regional production histories are useful because of easily identified distortions. To avoid the obvious pitfalls, certain criteria were adopted:
- A relevant region (often a country) must represent a large, geologically varied province and be clearly past its maximum likely oil production. While the cases cited here all appear to be past their likely maximum production, there is the possibility of a major new discovery. For some of the regions and countries cited, such a trend reversal is essentially impossible. For others that have recently peaked, a major reversal is unlikely because of extensive exploration with the latest technology
- Production at peaking must have been significant, greater than 1 one million barrels of oil per day at peak
- Production data must be available several years before and after peaking
- The region had to have been generally managed for maximum oil production prior to and after oil peaking. Accordingly, we did not consider regions whose production was constrained by cartel considerations or extraordinary political events. As part of this analysis, we took note of production one year before and one year after peaking in an effort to identify related short-term trends.
The regions that fit our criteria were: Texas, North America, United Kingdom, and Norway. Each is certainly or almost certainly years past its peak production, so major new discoveries are unlikely to change their peaking profiles. In each case, management, market and political factors influenced oil production in ways that we considered second-order. None were subjected to extreme political influences of the types experienced in Russia and Venezuela, for example, and none were part of OPEC.
Many countries with large oil production were not useful for this analysis. First are the OPEC countries – Algeria, Indonesia, Iran, Iraq, Kuwait, Libya, Nigeria, Qatar, Saudi Arabia, UAE and Venezuela. Over the past three decades, OPEC limited member production to less than their maximum productive capacity in an effort to control world oil prices, so from time to time their production histories were strongly manipulated. Oil production in Russia was dominated by significant mismanagement prior to the fall of the Soviet Union. Most recently, political turmoil and transportation constraints have had a major impact on Russian oil production. Venezuela is a member of OPEC and thus limited its oil production over past decades. In addition, recent political turmoil and oilfield mismanagement have distorted their production in complex ways.
PAST PEAK PRODUCTION DATA
Figs. 4 – 7 show annualized daily production data for a 10-yr period around peak production for the selected regions and countries. Yearly data were considered appropriate for identification of major changes, because monthly data can fluctuate dramatically and obscure longer-term trends. While heavy oil was produced in some of the regions of interest, it was fractionally small enough to be neglected for our purposes.
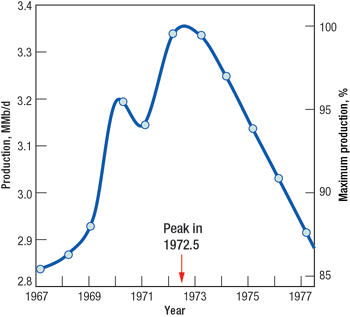 |
Fig. 4. Texas oil production peaked in mid-1972.
|
|
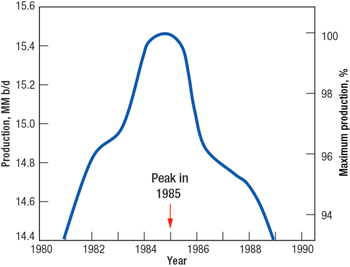 |
Fig. 5. North American oil production peaked in 1985.
|
|
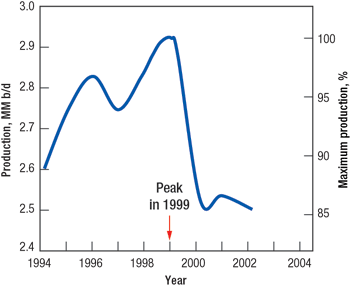 |
Fig. 6. United Kingdom oil production peaked in 1999.
|
|
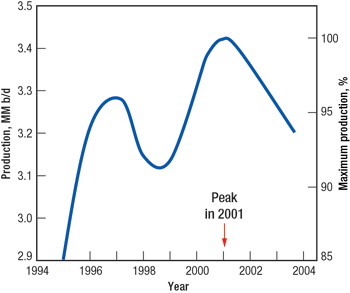 |
Fig. 7. Norwegian oil production peaked in 2001.
|
|
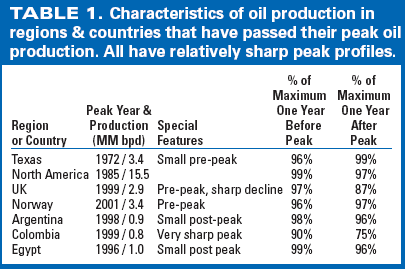
Table 1 is a summary of the data, including the fraction of maximum production one year before peaking and one year after for Texas,16 North America,17 the UK15 and Norway.17 In addition, peak production data are shown for three countries that are also past peak production, but whose maximum production was less than one million barrels of oil per day – Argentina,17 Colombia,17 and Egypt.15 Examination of the data leads to the following observations:
- In all cases, it was not obvious that production was about to peak a year prior to the event
- The peaks were sharp, not gently varying bell curves and not flat topped, as some forecasters have hoped
- Post-peak production declines were much greater than our 2% benchmark in some cases
- Pre-peaks occurred in three cases.
SUMMARY
To understand the possible character of the peaking of world conventional oil production, oil peaking in a number of relatively unencumbered regions and countries was considered. All had significant production, and all were certainly or almost certainly past their peak. The data shows that the onset of peaking can occur quite suddenly, peaks can be very sharp, and post-peak production declines can be comparatively steep (3 – 13%). Thus, if historical patterns are appropriate indicators, the task of planning for and managing world conventional oil peaking will indeed be very challenging. 
ACKNOWLEDGEMENTS
The author thanks Dr. Roger Bezdek, MISI, Robert Wendling, MISI, Lawrence Kummer, UBS, David Morehouse, EIA, Maria Vargas, NETL, and Jean Laherrere, TOTAL, retired, who all provided very helpful comments on drafts of this study. The final report is solely the responsibility of the author.
This work was sponsored by the National Energy Technology Laboratory of the Department of Energy, under Contract No. DE-AM26-99FT40575, Task 21006W. The author is indebted to NETL management for encouragement and support.
LITERATURE CITED
1 Bakhtiari, A.M.S., “World Oil Production Capacity Model Suggests Output Peak by 2006 – 07,” Oil & Gas Journal, April 26, 2004.
2 Simmons, M.R., Twighlight in the Desert, Wiley, 2005.
3 Skrebowski, C., “Oil Field Mega Projects – 2004,” Petroleum Review, January 2004.
4 Deffeyes, K.S., Hubbert’s Peak – The Impending World Oil Shortage, Princeton University Press, 2003.
5 Goodstein, D., Out of Gas – The End of the Age of Oil, W.W. Norton, 2004
6 Campbell, C.J., “Industry Urged to Watch for Regular Oil Production Peaks, Depletion Signals,” Oil & Gas Journal, July 14, 2003.
7 “Drivers of the Energy Scene,” World Energy Council, 2003.
8 Laherrere, J., Seminar Center of Energy Conversion, Zurich, May 7, 2003.
9 DOE EIA, “Long Term World Oil Supply,” April 18, 2000.
10 Jackson, P. et al., “Triple Witching Hour for Oil Arrives Early in 2004 – But, As Yet, No Real Witches,” CERA Alert, April 7, 2004.
11 Davis, G., “Meeting Future Energy Needs,” The Bridge, National Academies Press, Summer 2003.
12 Hirsch, R.L., Bezedk, R., Wendling, R., “Peaking of World Oil Production: Impacts, Mitigation, & Risk Management,” DOE NETL, February 2005.
13 Hubbert, M.K., “Nuclear Energy and the Fossil Fuels,” American Petroleum Institute Drilling and Production Practice, Proceedings Spring Meeting, San Antonio, 1956.
14 Deffeyes, K.S., Beyond Oil: The View From Hubbert’s Peak, Hill and Wang, 2005.
15 US Department of Energy, Energy Information Administration, “Long Term World Oil Supply,” April 18, 2000.
16 Railroad Commission of Texas, Oil Production and Well Counts (1935 – 2003), www.state.tx.us
17 Statistical Review of World Energy 2004, BP, June 15, 2004.
THE AUTHOR
|
| |
Robert L. Hirsch is a senior energy program advisor for SAIC. Previous employment includes senior positions at the Energy Research and Development Administration, ARCO, Exxon, EPRI, APTI and Rand. He is a past chairman of the Board on Energy and Environmental Systems at the National Academies. He has a PhD in engineering and physics from the University of Illinois.
|
| |
|
|


