Heterogeneity quantification, fine-scale layering derived from image logs and cores
Reservoir CharacterizationHeterogeneity quantification, fine-scale layering derived from image logs and coresFine-scale layering results in an improved static geological model that, in turn, improves reservoir simulation in a large oil field offshore Abu Dhabi.Hamad Bu Al-Rougha and Hesham Shebl, ZADCO; and Sandeep Chakravorty, Schlumberger Most carbonate reservoirs offshore Abu Dhabi are characterized by complex textural heterogeneity that can be detected by high-resolution borehole image logs. This textural heterogeneity gives rise to extreme permeability variation that is the controlling factor in reservoir production. A study conducted by ZADCO and Schlumberger illustrates an approach to improve carbonate reservoir characterization of an offshore Abu Dhabi oil field, by quantifying fine-scale heterogeneity using borehole image logs and core measurements. The reservoir under study ranges from mud-supported to grain-supported limestones with variable degrees of grain sorting and cementation. Detailed core analysis indicates the presence of small-scale, fining-upward cycles of 0.5 – 5 ft thick. The base of each cycle is coarse-grained sediments with high permeability that can directly affect field development plans. An attempt has been made to detect this cyclicity from image logs to aid correlations in uncored wells. The study illustrates a methodology to quantify vuggy and cemented textures of the carbonate rocks at a resolution that is closest to actual core scale, and to use image logs to better identify stratigraphic surfaces and vertical staking patterns in the carbonate reservoirs. The fine-scale layering identification resulted in an improved static geological model that improves reservoir simulation, because it is constrained by better stratigraphic architecture of the reservoir and, therefore, its matrix-determined fluid flow structure. LOCATION/ SCOPE OF STUDY The study area is 65 km (40 mi) offshore Abu Dhabi, in one of the largest producing fields, covering more than 1,600 sq km. More than 1,000 wells have been drilled into the field’s Lower Cretaceous reservoir. Variable production and injection performances indicate extreme permeability variations. The study illustrates an approach to improve carbonate reservoir characterization by quantifying small-scale heterogeneity, using borehole image logs and core measurements with a view to minimizing coring in future wells. DATA SET The study is based on detailed analysis of six wells, four from the eastern area and two from the western area, Fig. 1. All have excellent core coverage over the entire reservoir.
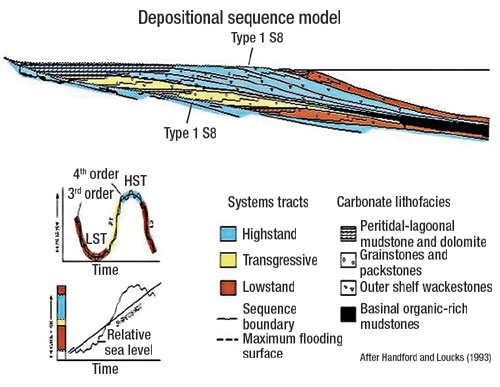
The core examination concentrated on recording key lithology changes, including coarse grainstones, rudist accumulations, stylolite locations, dolomite bands and dolomitic-cemented grainstones. This was followed by a thin-section study for reservoir quality and digenetic petrographic studies on different reservoir rock types. Additionally, permeability and porosity were measured from core plugs sampled per foot. The core analysis was later loaded into a workstation to be integrated with borehole electrical image logs. Results were validated by dynamic measurement and simulation. RESERVOIR GEOLOGY The Lower Cretaceous reservoir was deposited within a regionally extensive, low-energy, shallow-water carbonate ramp on the Arabian cratonic margin, Fig. 2. Despite widespread lateral lithofacies continuity, reservoir quality varies from superior in the field’s eastern part to inferior (more cemented) in the western area. This regional variability is locally complicated by cyclical, minor (low-amplitude) eustatic cycles in an overall, relative sea level rise. This resulted in deposition of a series of parasequence sets in a major, high stand systems tract (HST). The upward shallowing HST is capped by deepening-upward, transgressive system tract (TST) shales.
The best reservoir intervals occur in the uppermost parts of HSTs. Extreme variations in reservoir productivity result from wide-ranging differences in facies, texture, fauna and flora. The complex lateral and vertical stacking pattern has implications for well trajectory optimization, perforation and completion strategies, and well injection and production planning. PARASEQUENCE CYCLICITY Cyclicity patterns in the study area occur at a variety of scales, some of which are appropriate for reservoir layering, while others are either too fine or too gross-scaled. Consequently, the definition of sequence, stratigraphic-based reservoir layers involves a two-step process: 1) Identification of the smallest-scale shallowing- and deepening-upward cycles in the cores and image logs; and 2) Consolidation of these small-scale cycles into geological reservoir layers that can be confidently correlated throughout the field, Fig. 3.
Recognition of cycles and cycle boundaries is based on the following criteria:
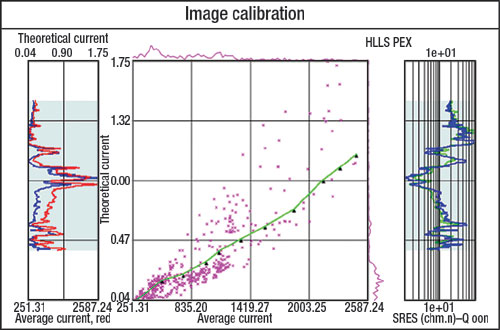
Core-based shallowing and/or deepening-upward cycles can be matched to the image logs to define the smallest scale cycles resolvable on the wireline logs. High-resolution logs can often identify subtle changes in rock fabric and reservoir properties that are not resolved on conventional logs. Furthermore, the relative number of cycles will vary, depending upon the position of each well on the field structure. Wells drilled on the structure’s flanks are likely to contain more cycles than those drilled on the crest, due to changes in relative sea level more profoundly affecting the middle to outer ramp. On the inner ramp, lithofacies variation in response to sea level fluctuations might be expected to be more modest. IMAGE LOGS METHODOLOGY The estimation of reservoir layering using conventional wireline logs is possible, although low vertical resolution limits their utility for characterizing fine-scale heterogeneity that exists in most carbonate reservoirs. For example, conventional wireline logs have vertical resolution capabilities (2 – 4 ft or greater) that commonly are much more gross compared to the study area’s scale of geological heterogeneity. Any geological heterogeneity below the vertical resolution of a conventional wireline tool has gone unrecognized in uncored wells. Ideally, borehole image logs are well suited for such a purpose. For this study’s purpose, the logging tool’s vertical resolution is more important than the depth of investigation. In this application, small-scale geological heterogeneity in the invaded wellbore region of the formation – reflected in microresistivity measurements from image logs – provides valuable information on reservoir heterogeneity and, ultimately, on reservoir quality. Heterogeneity quantification and fine-scale cyclicity identification from image logs is a two-step process. Image scaling. Despite providing great borehole coverage and high resolution, the measurements of all resistivity-imaging tools are relative. Consequently, a layer’s true resistivity cannot be quantified without special processing techniques. To perform quantitative analysis, the image log button response is transformed to a measurement resembling the formation resistivity as measured by a true resistivity tool. This is achieved through scaling, a process that calibrates the button response using a cross-plot of the average image button response against shallow resistivity, Fig. 4.
In this study, shallow, high-resolution lateral log resistivity is used for image scaling as follows:
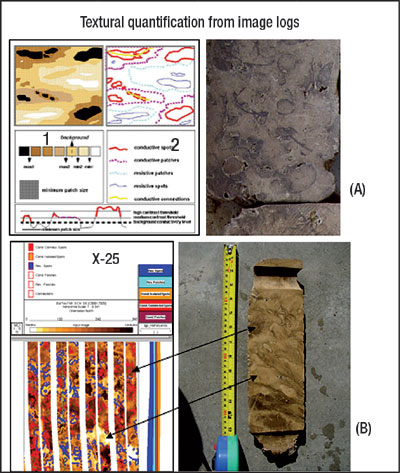
Reservoir heterogeneity. The scaled image is then contoured by applying a threshold on resistive and conductive anomalies frequency histograms to capture reservoir heterogeneity. Several iterations are performed in the study wells to optimize parameters used for extraction of formation heterogeneities. Each iteration’s results are validated by visual examination of images and cores, to see whether all heterogeneities are identified and contoured. Conductive events are further classified into three types – large patches, connected spots and isolated (within the wellbore) spots. Resistive events are classified into resistive patches and resistive spots, Fig. 5.
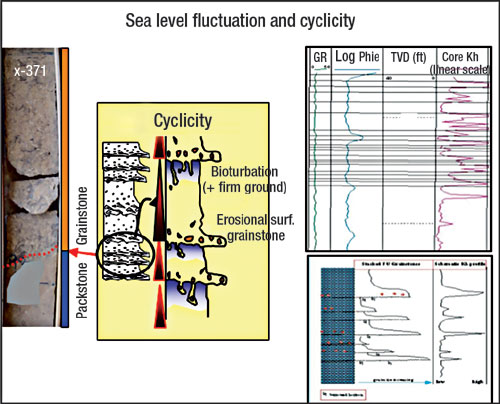
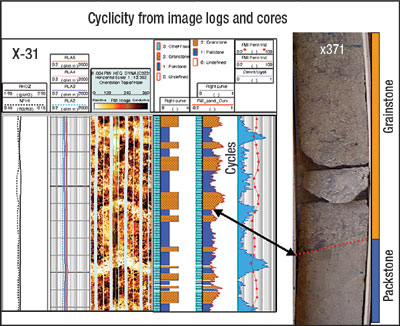
Results of heterogeneity contour analysis are converted into continuous depth-indexed channels or curves to get the proportion and size of each type of formation heterogeneity. Such curves can be averaged over any window length and output at any sampling rate. In this study, they are averaged over a 6-in. window and output at 0.2 in. to capture fine-scale, core textural variability. To detect such a fine, complex sedimentary hierarchy, a cumulative conductivity curve (conductive inclusion proportion, the sum of conductive isolated spots, conductive connected spots, and conductive patches) and a cumulative resistivity curve (resistive inclusion proportion, the sum of resistive spots and patches) were extracted from image logs. Since conductive and resistive heterogeneities in the borehole image represent vuggy and cemented zones, respectively, an overlay of the image conductive inclusion proportion and resistive inclusion proportion curves was used to detect fine-scale cyclicity. Electrical image data showed repetition of very fine conductive and resistive layers within reservoir units, which agreed with core examinations. Each conductive (grainstone) cycle is capped by a high-resistivity (cemented packstone) layer, Fig. 6. The resistive layers represent hard ground that can be used in assisting interwell correlations in the absence of core data. Major erosional surfaces are characterized by a sharp change in conductive inclusion and resistive inclusion types of proportion curves.
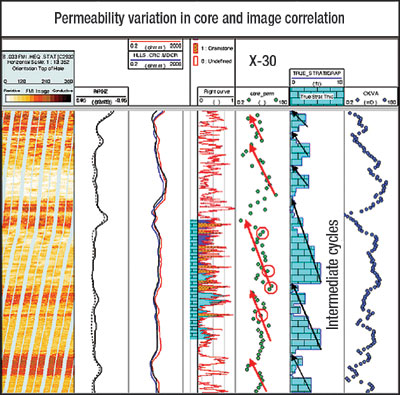
DISCUSSIONS/ OBSERVATIONS The major objective for the fine-scale layer mapping effort has been to understand complex permeability heterogeneity. Core and thin-section observations show that the highest core permeability is related to grain size, sorting and degree of cementation, and linked to lithotype distribution. Very good correspondence of grainstone occurrences with higher image conductivity and core plug permeability peaks was observed. Several discrete grainstone/ higher permeability levels were identified and successfully correlated, despite significant lateral variations in both thickness (<1 to 5 ft) and permeability. Each grainstone layer tends to fine upward; the upper section is generally packstone or fine grainstone with lower permeability, Fig. 7. In many wells, the permeability profile is very subdued, especially downflank and to the west. Nevertheless, it has been possible to use even these subtle permeability data for correlation.
Plotting the image conductivity profile, along with core sedimentary cycles, shows higher permeability values near the base of the grainstone cycles and gradual reductions toward the top (cemented packstone facies). This relationship may not be clear, if core plug measurements are random and permeability is derived from low-resolution logs. The highest permeability layers compare well with the pattern of the well test permeability and saturation profile, suggesting a strong primary lithological (grainstone) control on well productivity. Borehole imaging was not able to resolve cycles with high confidence in areas where cycles are very thin, and/or the contact between grainstone and packstone facies is characterized by gradual texture changes. This limitation is occasionally seen in the crestal area, where the grainstone facies are either poorly sorted (due to bioturbation) and/or overlaying packstone facies are not well cemented. CONCLUSIONS The image-derived curves successfully identified small-scale, fining-upward cycles seen on cores. The base of each such cycle represents coarse-grained sediments with high permeability, capped by cemented fine-grained sediments. This can lead to recognition of fine-scale cyclicity even in the non-cored wells, to map the areal extent of these facies, and, hence, their field-wise distribution. High-resolution image logs are the only means to achieve this objective. Recognition of high-permeability grainstone facies is crucial to understanding the water injection performance of such a mature field.
|
||||||||||||||||||||||||||||||||||||||||||


- Advancing offshore decarbonization through electrification of FPSOs (March 2024)
- Oil and gas in the Capitals (February 2024)
- Subsea technology- Corrosion monitoring: From failure to success (February 2024)
- Driving MPD adoption with performance-enhancing technologies (January 2024)
- Digital transformation: A breakthrough year for digitalization in the offshore sector (January 2024)
- Quantum computing and subsurface prediction (January 2024)

