Exploration/ Reservoir
Improved gross rock volume calculation with better time interpretation
Methodology review and case study example emphasizes importance of accounting for two-way traveltime uncertainty in reserve estimations.
Nicolas Jeannee and Jacques Deraisme, Geovariances, and Peter Shiner, Shell Italia E&P S.p.A
Assessment of gross rock volume (GRV) uncertainty is a key issue in hydrocarbon resource evaluations across the exploration-appraisal-development cycle. Geostatistics provide a variety of techniques for deriving velocity models by combining well information with, for instance, more densely sampled stacking velocity data. Stochastic simulations extend these techniques and, by providing a range of iso-probable velocity models, allow assessment of velocity uncertainty and its impact on GRV distributions. This article presents an innovative approach to quantify Two-Way Traveltime (TWT) uncertainty successfully applied to a complex hydrocarbon field. The impact of TWT interpretation uncertainty on GRV is quantified and discussed.
METHODOLOGY
In quantifying depth uncertainty, it is common practice to quantify velocity uncertainty using classical stochastic simulation techniques: collocated co-simulations, simulations with external drift (Deraisme and Jeannee, 2003). TWT interpretation being often taken for granted, depth converting Vav realizations with TWT Best Technical Case (BTC) consequently underestimates the depth uncertainty.
In the proposed workflow, top reservoir TWT uncertainty is described by complementing the conventional Best Technical Case top reservoir interpretation with optimistic and pessimistic interpretations. These maps show sharp jumps in TWT uncertainty across faults, and common asymmetry in the uncertainty envelope around the Best Technical Case interpretation. A confidence interval for the top reservoir TWT interpretation may be calculated by assigning probability levels to the interpreted horizons based on the interpreter’s subjective assessment of the described probability range (10% – 50% – 90% for instance).
The idea of the approach is to generate TWT realizations honoring the information contained in these three maps (see Jeannee et al. (2004) for details). These TWT realizations are obtained by: 1) simulating non-conditional gaussian (0,1) realizations honoring TWT uncertainty spatial structure; and 2) rescaling these simulations by the appropriate difference grid, and generating TWT top reservoir realization by adding the previous error grid to the Best Technical Case interpretation.
This approach allows reproducing the locally varying uncertainty on TWT, as well as the asymmetry of the TWT uncertainty around the Best Technical Case.
Finally, top reservoir depth maps were generated by depth converting TWT realizations with classically obtained Vav realizations. Top reservoir depth realizations are finally used to perform volumetric calculations over areas of interest, and GRV distribution and uncertainty are finally assessed.
CASE STUDY
Top reservoir TWT interpretation. The onshore oilfield presented contains areas of high structural complexity and poor seismic data quality. TWT interpretation was produced by conventional seismic interpretation with the bulk of the field being covered by 3D seismic. Seismic data quality is highly variable and so is the confidence in the seismic interpretation of the target horizon, Fig. 1:
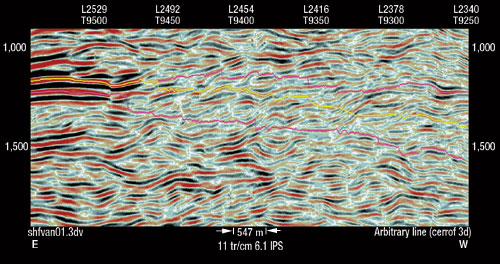 |
Fig. 1. Cross-section of shallow (violet), BTC (yellow) and deep (violet) TWT interpretations.
|
|
- In areas of moderate to good-quality seismic image, the pick can be made with a high degree of confidence, and uncertainty is related solely to interference effects a rising from overlying structures and from intra-reservoir reflectors.
- In contrast, in areas of poor seismic data, quality is due to a combination of factors that commonly degrade seismic quality in onshore thrust belts. In such areas, the Best Technical Case top reservoir pick represents the interpreter’s subjective opinion as to the most likely top reservoir interpretation and is commonly driven by the structural model the interpreter has in mind. It can thus be regarded as the mode of a range of possible structural interpretations.
 |
Fig. 2. Experimental variogram and fitted model for the TWT standard deviation, computed along the main grid axes.
|
|
Quantification of TWT uncertainty and validation. TWT uncertainty is described by complementing the Best Technical Case interpretation with optimistic and pessimistic interpretations. This uncertainty is assessed by applying the methodology presented above. The TWT errors variogram is computed, using the mean standard deviation grid, see Fig. 2.
Time uncertainty is therefore assumed to be expressed by its standard deviation, given by the MIN and MAX maps, assuming a gaussian distribution and a 10% – 50% – 90% probability range. For top reservoir TWT, 100 realizations were generated with the modeled variogram using the turning bands technique, with proprietary Isatis software. Resulting TWT realizations honor the varying uncertainty level: low uncertainty in wells area, increased uncertainty far from wells, Fig. 3. The asymmetry is also noticeable.
 |
Fig. 3. Cross-section of TST BTC pick, shallow and deep picks (in red), TWT realizations in blue; two-way-time expressed in msec.
|
|
Several sets of TWT realizations were imported into a seismic interpretation work station and reviewed for relevance when compared against the original seismic dataset.
 |
Fig. 4. GRV distributions obtained from uncertainty quantification approach, with (blue) and without (orange) taking into account the TWT uncertainty; indication of P10, -50 and -90 quantiles.
|
|
GRV estimation. Average velocity (Vav) realizations were obtained using a classical collocated cosimulations approach that integrates well pseudo-Vav and a Free Air Anomaly dataset.
Depth realizations are finally obtained by depth converting TWT realizations with Vav realizations. These depth realizations may finally be used in a variety of ways. For instance, P10 and P90 top reservoir depth maps might be generated and used to assess GRV uncertainties or for full STOIIP calculations. For instance, Fig. 4 illustrates GRV results in a particular area of interest.
Several comments about these GRV results include:
- First, the underestimation of GRV uncertainty is remarkable if TWT uncertainty is ignored: the coefficient of variation (P90-P10)/P50 is reduced by a factor larger than 2, varying from 14% (with TWT uncertainty) to 6% (without TWT uncertainty).
- Taking into account TWT uncertainty introduces asymmetry in the GRV distribution.
- Even though the Best Technical Case is considered as the mode of the TWT realizations, the asymmetry of the TWT uncertainty leads to a decrease of the P50 median GRV.
In conclusion, these results highlight the importance of taking into account TWT uncertainty in reserves estimations. 
BIBLIOGRAPHY
Deraisme, J. and N. Jeannee (2003), “Quantifying uncertainty in depth conversion and volumetrics,” 1st North Africa/ Mediterranean Petroleum & Geoscience Conference & Exhibition, Tunis, October 6 – 9 2003.
Geovariances (2004), Isatis Software Manual, 5th Edition, Geovariances & Ecole des Mines de Paris, 710p.
Jeannée, N., P. Shiner and J. Deraisme (2004), “Geostatistical assessment of time picking uncertainties and their impact on GRV,” Proceedings, AAPG Conference, Prague, October 2004, to be published.
THE AUTHORS
|
| |
Nicolas Jeannee joined Geovariances in 2001, after graduating with a diploma of education, a master in statistics and several years at the Centre de Geostatistique of the Ecole des Mines de Paris. He earned a PhD in 2001 on geostatistical characterization of soil contamination. Since joining Geovariances, he supervised numerous consulting/ training activities mainly for environmental and oil/gas industry companies.
|
| |
Jacques Deraisme, cofounder of Geovariances, is technical manager in charge of the consulting and training department. After graduating as a mining engineer from Ecole des Mines de Nancy, in 1969, he worked from 1972 to 1986 at the Centre de Geostatistique of the Ecole des Mines de Paris, where research activities focused on stochastic/ mining simulations. He earned his PhD in 1978. Since 1986, he conducted many geostatistical studies for mining/ oil companies for Geovariances, and led numerous training sessions in applied geostatistics.
|
| |
Peter Shiner has been the lead geophysicist in Shell Italia E&P’s development group since 2002. Prior to this he worked for Enterprise Oil in Italy and in the Central North Sea. He has worked extensively on seismic interpretation, depth conversion and quantification of depth uncertainties in structurally complex settings, and cultivates a part time passion for the sedimentology of Southern Italian carbonate platforms.
|
|

