OUTLOOK 2005: United States
US Production
Oil and gas production remarkably flat – again
Crude and condensate. Early results from December shows that US crude production fell back to a more typical decline rate in 2004, to -4.2%. And this, despite record oil prices that peaked at $55.17. Governmental revisions recently applied to 2002 (5,739 bopd) and 2003 (5,681) data show the actual trend.
The Lower 48 shared the falloff, with Texas, Louisiana and Alaska each losing about 20 million bbl of production last year. For the last two years, the Alaskan decline has been smaller than usual, due to an aggressive enhanced recovery effort; but the inevitable slide began to resurface last year.
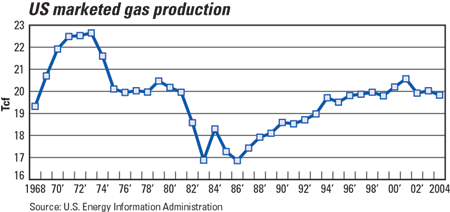
Natural gas. Preliminary year-end data indicate that gas production was on par with 2003, perhaps 1% or so lower. As seen in the graph, production has remained relatively flat since 1994, hovering around 20 Tcf. So far, 1973 was the peak year of production. Will it turn out to be the all-time peak? Indications are that current production is not due to lack of effort. Gas well completions in 2004 have likely set a new record. Also, while depletion rates are a problem, they are also intentionally strived for, to bring as much gas to market as quickly as possible. The problem is reservoir size and deliverability.
Conventional wisdom is that demand destruction is occurring with high gas prices – which averaged $5.54/Mcf (wellhead) in 2004. For 2005, we see gas prices at about $6.25/MMbtu ($6.42/MMcf) and, at those prices, production and demand will probably follow the same flat trend that it has in recent years.
Somewhat bolstering this steady production profile is the considerable unconventional gas resources that are coming onstream. The problem with these resources is that they often deplete too fast, and/or deliver too slow. For now, it appears that the growth rate in unconventional gas resources is beginning to level off, at best replacing the decline in conventional gas fields. 
| |
US crude and condensate production by state (thousand barrels) |
|
| |
|
Barrels daily
|
Barrels annually
|
|
|
| |
State |
2004* |
2003** |
2004* |
2003** |
% Diff. |
|
| |
|
|
| |
Alabama |
21 |
22 |
7,594 |
7,877 |
–3.6% |
|
| |
Alaska1 |
908 |
974 |
332,272 |
355,582 |
–6.6% |
|
| |
Arizona |
0 |
0 |
52 |
47 |
0.1 |
|
| |
Arkansas |
18 |
20 |
6,740 |
7,226 |
–6.7% |
|
| |
California2 |
740 |
767 |
270,911 |
280,000 |
–3.2% |
|
| |
Colorado |
55 |
58 |
20,303 |
21,109 |
–3.8% |
|
| |
Florida |
8 |
9 |
2,927 |
3,262 |
–10.3% |
|
| |
Illinois |
32 |
32 |
11,713 |
11,696 |
0.0 |
|
| |
Indiana |
5 |
5 |
1,799 |
1,865 |
–3.5% |
|
| |
Kansas |
91 |
93 |
33,135 |
33,944 |
–2.4% |
|
| |
Kentucky |
7 |
7 |
2,625 |
2,538 |
0.0 |
|
| |
Louisiana2 |
1,429 |
1,494 |
522,850 |
545,416 |
–4.1% |
|
| |
Michigan |
16 |
18 |
5,919 |
6,524 |
–9.3% |
|
| |
Mississippi |
46 |
45 |
16,993 |
16,593 |
0.0 |
|
| |
Missouri |
0 |
0 |
73 |
82 |
–10.7% |
|
| |
Montana |
62 |
53 |
22,822 |
19,320 |
0.2 |
|
| |
Nebraska |
7 |
8 |
2,562 |
2,755 |
–7.0% |
|
| |
Nevada |
1 |
1 |
516 |
493 |
0.0 |
|
| |
New Mexico |
172 |
181 |
62,982 |
66,130 |
–4.8% |
|
| |
New York |
0 |
0 |
146 |
144 |
0.0 |
|
| |
North Dakota |
83 |
81 |
30,381 |
29,406 |
0.0 |
|
| |
Ohio |
16 |
15 |
5,763 |
5,647 |
0.0 |
|
| |
Oklahoma |
175 |
179 |
63,933 |
65,356 |
–2.2% |
|
| |
Pennsylvania |
6 |
7 |
2,350 |
2,425 |
–3.1% |
|
| |
South Dakota |
4 |
3 |
1,340 |
1,237 |
0.1 |
|
| |
Tennessee |
1 |
1 |
314 |
311 |
0.0 |
|
| |
Texas2 |
1,338 |
1,424 |
489,753 |
519,627 |
–5.7% |
|
| |
Utah |
38 |
36 |
13,942 |
13,096 |
0.1 |
|
| |
Virginia |
0 |
0 |
5 |
5 |
0.0 |
|
| |
West Virginia |
4 |
4 |
1,464 |
1,334 |
0.1 |
|
| |
Wyoming |
141 |
144 |
51,749 |
52,407 |
–1.3% |
|
| |
|
|
| |
US Total |
5,426 |
5,681 |
1,985,929 |
2,073,454 |
–4.2% |
|
| |
Lower 48 |
4,518 |
4,706 |
1,653,657 |
1,717,872 |
–3.7% |
|
| |
Totals may not add due to rounding
*Estimated using API and DOE data
**Revised using DOE data
1Includes state waters
2Includes state and federal waters |
|
|
|


