|
|
|

By Petroleum Technology Transfer Council |
Internet access to well information
From generating prospects to increasing production, an easily accessible and minable database, offered by governmental agencies, can provide benefits to operators.
Steve Gustison, John Grube and Beverly Seyler, Illinois State Geological Survey
Opportunities for increased oil production have been overlooked in Illinois due to complex development histories, multiple stacked pays, heterogeneous reservoirs, and commingled production. Exploitation of pays and application of secondary or improved/ enhanced recovery strategies often underperforms. The Illinois State Geological Survey (ISGS) has developed a new GIS-referenced database that is Internet delivered. It is being successfully used to identify new fields and bypassed oil in underdeveloped areas.
THE ILoil WEBSITE
The interactive map website is called ILoil. It was activated in February 2003 and funded by a PUMP (Preferred Upstream Management Practices) award through the Department of Energy’s (DOE’s) National Energy Technology Laboratory (NETL). ILoil has enabled easy public access to well data information from over a century of drilling. Response to the new ILoil website has been very positive, and, since January 2004, the number of daily visitors has more than doubled to almost 2,700. Oil and gas operators, using only their web browsers, can easily manipulate very large databases by activating different combinations of layers, creating customized maps that can be used for development and exploration purposes.
The Petroleum Technology Transfer Council’s (PTTC’s) Midwest Region has conducted several instructional technology transfer workshops at various locations that train the public about the fundamentals of ILoil. Over 400 people have attended these workshops, with a beneficial result from use of the website being an increase in Illinois oil production.
INDUSTRY BENEFITING
Ron Perkins, vice president of Residuum Energy in Durham, North Carolina, attended a workshop. He states, “The ILoil site has been extremely useful. I don’t know how I could continue to work in Illinois without it. It is relatively easy to survey an area of potential interest to determine the density of wells, the producing intervals in each field, and the current status of each well. The ability to screen for individual pay zones allows one to generate production distribution maps of specific horizons. The capability to overlay well data on topographic maps or aerial photographs is extremely valuable.”
Alex Booth, geologist with Continental Resources of Illinois in Mt. Vernon, Illinois, has used the ILoil site in combination with GeoGraphix software to check the accuracy and completeness of their in-house well database. He commonly uses the site to generate maps showing the producing formations within a particular area to illustrate complex, multi-pay production characteristics of a prospect and to enhance prospect reports. The site has saved his company time and money by making data available quickly and easily via the Internet.
Bruce Schonert, geologist in Olney, Illinois, attributes a new oil discovery to using the ILoil website. Historically, the Mississippian-age Aux Vases sandstone reservoirs exhibit a complex depositional pattern, and a somewhat hit-and-miss approach has been used to find reserves. Bruce has used the ILoil site to delineate intricate stratigraphic trends that successfully identified new prospective areas.
USING THE WEBSITE
Users can link to the ILoil website from the ISGS homepage at: www.isgs.uiuc.edu. The site offers the user online tutorial and evaluation techniques for detecting underdeveloped areas. Direct access to the ILoil site is available at the following address: http://meltwater.isgs.uiuc.edu/website/iloil_arcmap. The opening page displays a statewide map of Illinois, oil fields and Interstate highways, Fig. 1. A toolbar is located on the left of the display and is used to manipulate the map display and data retrieval. To the right of the map is a list of selective visible layers, and below the map an area used to display queried data. Additional detail is scale dependent and becomes available by using the Zoom In tool
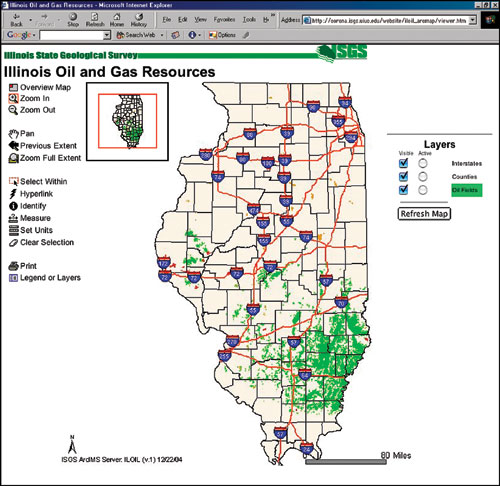 |
Fig. 1. Interactive display format for the opening page of ILoil website
|
|
Other interactive layers and associated data tables include: wells, oilfield data, pay zones, state and federal highways, municipalities, state parks, lakes, USGS 7.5-minute quadrangles and Digital Orthophotographic Quadrangle (DOQ) maps. Recent additional layers include contoured structure maps, waterflood areas with associated injection and production data, and core analysis data.
Fig. 2 shows a Zoom In view of Miletus field in Marion County, Illinois. Notice that the layers available are expanded with increased map scale. The oilfield data layer has been activated and the Identify tool selected and clicked inside the green field outline. Activating this combination sends a query to the ISGS Oracle database that produces a field summary table as shown below the map display. The user now has vital information, including cumulative production, pay zones present and their average depth and thickness. This table can be copied into a text document or a spreadsheet.
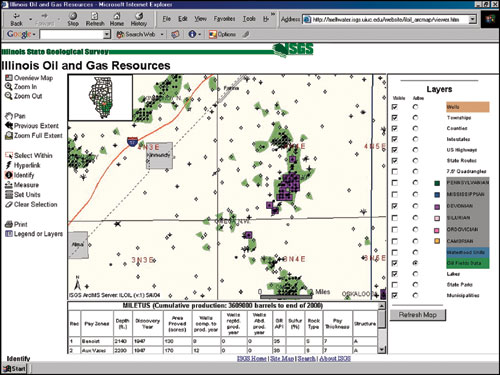 |
Fig. 2. Miletus field using Zoom In tool and queried oilfield table. Purple are wells with Devonian production.
|
|
Continue to Zoom In and all the wells will be symbolized and labeled with their total depths. By activating the wells layer and using the Identify icon to click on a particular well, a row of attributes will appear showing basic header information including: API number, well status, company name, farm name and number, section-township-range, completion date and total depth.
Another option is to use the Select Within icon to draw an area on the map that will generate a table containing the attributes of all the wells within the box. By clicking on the blue, underlined API number, a summary sheet of that well will be displayed in .pdf format. Another widely used option is to make the DOQ layer visible and click the Refresh Map button. This provides an aerial photo overlaid with user-defined layers. This map can be used by engineers and field personnel to plan oilfield development. The Print option can be used at any time to obtain a paper-size copy of the map display. Continue to Zoom In and the layers of the top 27 producing zones in Illinois become visible. These pay zones can be examined individually or in combination with other zones, and then overlain on the structure maps for further analysis.
ILoil’s FUTURE
The PTTC Midwest Region assumed responsibility for maintaining, updating and expanding the ILoil map website once the DOE PUMP project was finished. A series of pay zone maps, combined with structure maps, will soon be generated and distributed on CD-ROM. User feedback will continue to be assessed, and suggestions for new layers and upgrades will be accepted. Time will ultimately decide the total success of this website, but early indications point toward an increased number of enthusiastic users that are benefiting from this Web application. Various governmental agencies should take note of this project, to see how they may be able to assist operators in maximizing their oil and gas production. 
THE AUTHORS
|
 |
Steve Gustison is a petroleum geologist with the Illinois State Geological Survey in Champaign, Illinois. He also serves as the Midwest Petroleum Technology Transfer Council (PTTC) Program Manager. Before joining the Survey, Gustison operated an independent oil company in Ottawa, Kansas. He holds a bachelor’s degree from the University of Tulsa and a master’s degree from Western Illinois University. He may be reached at gustison@isgs.uiuc.edu.
|
 |
John Grube is a petroleum geologist with the Illinois State Geological Survey in Champaign, Illinois. He has worked as an oil and gas exploration and development research scientist at the survey for over 15 years and has worked in the oil industry in the Rocky Mountain region for over 13 years prior to coming to the Survey. Grube holds a bachelor’s degree from the University of Denver and a master’s degree from the Colorado School of Mines. He may be reached at grube@isgs.uiuc.edu.
|
 |
Beverly Seyler is a petroleum geologist and the head of the Oil and Gas Section at the Illinois State Geological Survey in Champaign, Illinois. She has worked as an oil and gas exploration and development research scientist at the survey for over 24 years. Seyler holds a bachelor’s degree from the State University of New York at Buffalo and a master’s degree from the State College of New York at Fredonia. She may be reached at: seyler@geoserv.isgs.uiuc.edu.
|
| |
|
|

