North American
Outlook
Rig efficiency improves in the US land market
However, there are indications some technical advances may have run their course.
Richard J. Mason, Land Rig Newsletter
The domestic oil and gas industry has been awash in anecdotal tales of efficiency improvements in the land drilling market for the last four years. One sees them on the presentation slides E&P companies display at investor conferences or industry seminars. And telephone interviews with contractors over the last half-decade have been laced with stories about wells that once took 25 or 30 days to drill in 2000 now being finished in two weeks – or less.
 |
Fig. 1. Total footage for Top 20 and Top 75 US land rigs 2001 – 2004.
|
|
Other accounts describe 25% to 40% improvements in drill days for 2004, vs. wells drilled to similar targets in 1999 or 2000. While such stories are impressive, there has been little comprehensive evidence to determine whether the gains represented “best in class” performance, occasional fortunate events, or were representative of all drilling activity.
Some evidence of efficiency improvements was available through annual surveys of the most active individual US land rigs. Total footage rose for both the Top 20 and the Top 75 most active rigs each year. Further, trends changed over time. Initially, the Top 20 group recorded the largest percentage gains. In recent years, the largest percentage gain has been for the Top 75 group, implying that efficiency improvements became more broadly based over time, Fig. 1.
GEOGRAPHIC DRILL DAYS STUDY
The samples noted above represented only the top 5% of US land rigs and involved equipment that was operating in developmental programs that resembled a harvesting mode, which was ideally suited for realizing manufacturing style efficiency gains. It is possible to measure industry-wide changes in efficiency using drill days as a metric. Drill days are defined as the length of time between spud date and rig release date. The Land Rig Newsletter, working with completion data supplied through Fort Worth-based RigData, conducted a study of four geographic areas in late 2004 to measure change in drill days over time.
The study found that efficiency actually declined between 2000 and 2001, but improved from 2001 through 2004. The July 2001 activity peak is a watershed in measuring rig performance. Drill days subsequently improved as inexperienced hands were released for lack of work and contractors stacked the least efficient rigs. The rapid adoption of drilling practices such as increased hydraulic horsepower (HHP), better bit design, and more powerful rigs also played a major part in improving rig performance, as measured by the fact that it took fewer drill days to reach similar depth ranges in several regional markets between 2001 and 2002.
The study found overall improvements in drilling days are more typical in depth ranges from 9,000 to 12,000 ft. Efficiency improvements are evident in shallower wells too, though usually on a smaller basis, percentage-wise, in most markets. The deepest wells exhibited extreme variability in drill days, and this portion of the study was hampered by a small sample.
But the study shows a marked decrease in the rate at which efficiency has improved in the last couple of years, though performance is still significantly better than the 2001 benchmark.
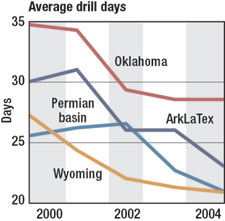 |
Fig. 2. Changes in drill days, spud to release, 9,000 – 12,000-ft wells.
|
|
EFFICIENCY GAINS BY REGION
The study looked at drill days by depth range in East Texas, Oklahoma, Wyoming and the Permian basin. In Texas Railroad Commission District 6, the study examined more than 6,000 wells. Data was averaged by year, by depth range into two categories: 9,000 to 12,000 ft, and 6,000 to 8,999 ft. The deeper category saw a 26% reduction in drilling days, from 31 in 2001 to 23 in 2004. Drill days for shallower wells declined 33% between 2001 and 2002, but have shown little change since.
In Oklahoma, the industry shaved a week to 10 days off the average well in depth ranges between 9,000 and 12,000 ft during the 2000 to 2004 time period, Fig. 2. From a practical standpoint, wells that took 35 days to drill in 2000 were completed in 28 days in 2004, or a 20% improvement. At the same time, average drilling days for wells in the shallowest classification, or 6,000 to 8,999 ft, changed little.
Similarly, the industry witnessed a 24% improvement in drill days for Wyoming during the 2000 to 2004 time period. Essentially, it took the major part of a month to drill a Wyoming well between 9,000 and 12,000 ft in 2000. In 2004, industry achieved the same depth in less than three weeks, based on a study of 1,500 wells. For wells between 6,000 and 9,999 ft, drill days fell from 15.8 on average in 2002, to 12.9 in 2004.
The Permian basin was the surprise region. Assumptions that the region would show little change in drill days because of the relative maturity of the hydrocarbon play proved to be incorrect. Drill days for wells in the 9,000 to 11,999 ft category declined from 27 days in 2002, to 21 at the end of 2004. Overall, the region witnessed an 18% reduction in drill days for wells less than 12,000 ft, and a 10% reduction for wells deeper than 12,000 ft.
 |
Fig. 3. Hydraulic horsepower vs. drill days, US ArkLaTex area.
|
|
Reasons for the change. There are two components in efficiency gains. The most commonly cited reasons for reduced drill days are greater HHP and improved drilling bits. An increase in HHP provides greater motive power for new PDC bit designs and flushes larger volumes of debris out of the wellbore during the drilling process.
It is possible to illustrate this as a cause and effect relationship. Using data supplied by Nabors Drilling USA, HHP increased more than 200% over the last four years in the company’s East Texas drill fleet, while drill days declined up to 45% for certain geologic targets, Fig. 3. Specifically, typical hydraulic pressure moved upward from a range of 1,800 to 2,000 psi in 2001, to 2,500 to 3,200 psi in 2004. This was accomplished through use of larger rigs, or by equipping existing rigs with oversized mud pumps and greater engine power.
A typical East Texas rig configuration in 2001 featured HHP in a range from 315 to 410 hp for wells drilling to targets in the Bossier Sand or Cotton Valley plays. By 2004, the range had increased to 660 hp on the low end, and up to 1,120 hp at the top, Fig. 3.
The second component involves reducing cycle time through faster rig moves. Rig moves have become a recurring theme in the land contract drilling industry over the last half decade. The process was set in motion with the advent of Helmerich & Payne IDC’s FlexRig3 program, which coupled system and component modularity with trailer-mounted equipment. The FlexRig3 series moves between wells and can rig up in three days, which is nearly 60% less than moving conventional rigs of similar size, Table 1. Within a couple of years of the advent of the new rig series in 2001, other drilling contractors sought methods to reduce move time on conventional rigs.
| |
TABLE 1. Move times by rig type, 1998 to 2004 |
|
| |
Rig type, hp |
Days to rig up |
|
| |
|
|
| |
1,200 Trailer mounted |
2.39 |
|
| |
1,500 FlexRig |
3.31 |
|
| |
1,000 Conventional |
5.75 |
|
| |
1,500 Conventional |
7.27 |
|
|
Implications of the change. The drill-day study also found some truth to an anecdote circulating among contract drillers. Rig efficiency benefited E&P firms, but was of marginal benefit to contractors. The explanation has to do with revenue days. Assume moving days between wells stay constant. Next, assume drill days decline from 31 in 2001 to 23 in 2004. The operator ends up with 10.4 wells per year on the 31-drill-day cycle. On a 23-day well cycle, the operator generates 13.5 wells per year, or a 30% gain.
For the contractor, revenue days equal work days with mobilization costs as a break-even endeavor. On the 31-day work cycle, the contractor experiences 323 revenue days per year. On a 23-day work cycle, the contractor records only 311 revenue days per year, if move time stays constant. If day rates stay the same, the contractor experiences a 3% decline in revenues unadjusted for inflation; Table 2 illustrates this concept.
| |
TABLE 2. Reduced drill days: More wells for E&P firms, fewer dollars for contractors |
|
| |
Year |
Work days |
Move days |
Wells/yr. |
Rev., days |
Rev./rig, $ million |
|
| |
|
|
| |
2001 |
31 |
4 |
10.4 |
323 |
2.97 |
|
| |
2004 |
23 |
4 |
13.5 |
311 |
2.86 |
|
|
WHAT’S ON TAP
Forecasting is a dangerous undertaking in the ever-volatile oil and gas industry. However, it appears that efficiency improvements are nearing an end in the current cycle for two reasons. First, while there may be incremental changes, the technological improvements brought by higher hydraulic horsepower, improved bit design, and greater power packages have been captured by a larger share of the industry, which is evident in the flattening curves for regional drill days. It will take another round of technological improvements to accelerate the downward trend line.
Second, demand for drilling services is drawing out the industry’s last remaining equipment and stretching the supply of experienced labor. An influx of inexperienced labor during periods of high demand for drilling service has, previously, resulted in declining rig performance and operational safety.
These trends are offset somewhat because technological adaptation continues to diffuse through the industry, which could stimulate gradually improving trend lines among a larger subset of drilling rigs. As always, experienced rigs and crews consistently produce better than average performance and are commanding premium rates. This is offset by the fact that high demand for drilling services is drawing incremental rigs with less experienced crews into the market. Ultimately, those rigs should improve in performance as well.
At first glance, it appears that industry has entered a pattern similar to the 2001 peak. The ensuing market collapse late that year was caused by a combination of rising rig rates, declining rig performance, and a drop in commodity prices. The current market exhibits only one of the themes, which is day rates near replacement cost economics. Recent operator anecdotes suggest some evidence of a modest decline in rig performance overall, though performance is still much improved over the 2001 benchmark. Lastly, commodity prices are robust.
That last point is worth noting. E&P firms spent the 2002 to 2004 era in the sweet spot of the industry. Rig rates were low, commodity prices underwent a step level change, and rig efficiency improved by 25% for intermediate depth wells. It produced a surge of free cash for operators. The pendulum is now swinging toward the service side of the industry. Although field expenses have risen, cash flow remains strong for E&P firms, thanks to commodity prices.
In 2002, an industry bumper sticker petitioned the Deity for one more drilling boom. The industry had its request answered. Today’s challenge is to keep the second part of the bumper sticker’s promise, which is to not mess up the boom this time. 
THE AUTHOR
|
 |
Richard Mason, is publisher of The Land Rig Newsletter, a monthly publication that provides trends analysis for the land-based contract drilling sector of the oil and gas industry. He previously worked 10 years as a field historian for the Texas Tech University archives, collecting historical materials on petroleum, agriculture and irrigation development in the American Southwest. Mr. Mason is a 1974 graduate of Ohio University with a bachelor of arts degree, with honors, in history.
|
| |
|
|

