Drilling and Completion Technology
“Roadmaps” improve extended reach well performance and decision making
Use of real-time mechanical and hydraulic modeling extends rig capabilities in modern, complex well environments, providing instructions to follow while drilling.
Brandon Foster, K&M Technology Group, Houston
Advances in downhole tool technology have improved operators' ability to extend the limits of existing rig capabilities in modern extended reach (ER) and complex well environments. However, the maximum benefit of using this equipment is only realized when theoretical drag and hydraulics modeling is applied. Several examples are cited in which operators have used real-time roadmaps to provide insight at the rig floor into what is happening downhole, therefore improving drilling performance and overall decision making.
The practice of collecting torque & drag (T&D) and equivalent circulating density (ECD) data and observing trends is relatively common-place in drilling modern wells. However, decision making is often hampered – if not incorrect – because the rig team and decision makers do not know what normal looks like, and therefore cannot know what abnormal looks like – unless the change is sudden. Most problems develop in a subtle manner, so the roadmap concept is used to take existing data and make it much more useful.
The following discussion, with three case histories, concludes that real-time mechanical and hydraulic modeling can help improve performance and reduce risk in today's complex well environments. Sophisticated downhole tools can be used to their full potential when sound high-angle drilling practices and theoretical roadmaps are used to prevent mis-diagnosis of observed trends. Three case histories are cited, that demonstrate the synergy of sophisticated surface-based and subsurface-based tools.
BACKGROUND
Existing technology is not always used to its full potential in today's high-angle and complex wells. Misconceptions in the industry with regard to hole cleaning and cuttings behavior sometimes lead to a false sense of security when advanced technology is thrown at a difficult well. Two major misconceptions about downhole tools are: 1) great hole cleaning is assured when a rotary steering tool (RST) is in the hole, and 2) a pressure while drilling (PWD) tool will warn the driller if the hole is loading up.
Without doubt, RST and PWD tools are useful technologies that can greatly improve drilling performance. However, relying on the fact that these technologies alone will prevent a hole cleaning problem is a dangerous notion.
Like PWD and RSTs, hydraulics and drag models are not new tools in the ERD toolbox. However, operators are finding better ways to use surface-based tools (modeling) to take advantage of subsurface-based equipment. Combining these tools allows relatively small drilling rigs to successfully drill well beyond the industry's standard definition of a rig's reach limit, which is typically related to pumping capability, i.e., 1,000-gpm minimum in 12-1/4-in. hole.
METHODS: EQUIPMENT/TECHNIQUES
Downhole equipment has evolved dramatically in the last decade. The following tools have enabled faster penetration rates, reduced risk and improved wellbore conditions, compared to those used only 10 years ago: 1) RSTs; 2) PWD tools; and 3) reaming while drilling (RWD).
Regarding techniques, a concept introduced by K&M in the 1990s called “Drilling in The Box,” Fig. 1, is becoming more widely utilized as complex wells become more prevalent in the industry. The Box is defined as the hole cleaning system's relative capability to remove a certain amount of cuttings out of a well. Conceptually, the size of The Box is governed mainly by flowrate, rotary speed and low shear-rate viscosity. However, many other factors also contribute to Box size, most of which are difficult to control, and/or the magnitude of which are largely unknown. Herein lies the question: Can the unknowns be accounted for?
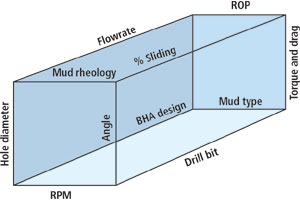 |
Fig. 1. Drilling in The Box concept represented by known and unknown elements of the hole cleaning system. Ideally, ROP will be maximized such that it remains inside, but on the edge of The Box walls.
|
|
Drag monitoring is the preferred way to detect whether the drillrate is too fast in high-angle wellbores. Assuming that ROP is inside The Box, drag trends will remain constant. Simply tracking drag values is generally not adequate for detecting diverging trends. A roadmap must be in place to incorporate theoretical values to determine what a normal drag trend should look like.
The drag monitoring process is a commonly used tool for staying out of trouble. However, drag monitoring while drilling can be taken one step farther to optimize ROP. Basically, ROP is systematically increased until drag trends diverge, thus defining the edge of The Box. ROP is then maintained slightly lower than this threshold level until drag trends again diverge or tight hole appears during connections, either due to known factors (reduced flowrate, rotary speed or viscosity) or unknown factors (hole size, cuttings size/shape, pipe eccentricity). The edge of The Box must be redefined on a continual basis as these factors begin to affect hole cleaning performance.
Similar to drag monitoring, ECD monitoring must incorporate a real-time roadmap to be fully utilized. Since drilling is a dynamic environment – both downhole and at surface – frequent updates to the theoretical model are pivotal in achieving a relevant roadmap. At a minimum, rheology assumptions should be updated after each complete mud check, preferably four times a day.
It may become necessary to perform rheology-only spot checks on a more frequent basis if annular pressures are approaching the fracture gradient, if the mud properties are widely variable, or if the PWD shows a downhole change. This is especially important, since PWD downhole response is very sensitive to slight rheology changes, that can mask or mimic other downhole problems.
CASE HISTORIES
Three case histories from the North Sea, the Gulf of Mexico and South America illustrate: 1) application of PWD and hydraulics modeling; 2) benefits of staying in The Box all the way to TD; and 3) applying roadmaps and proven ERD drilling/ tripping practices.
Well A. This well highlights the ability to interpret downhole behavior when a PWD tool is used in conjunction with real-time hydraulics modeling.
Overview. A North Sea operator recently drilled an 8-1/2-in. x 9-7/8-in. sidetrack from existing 9-5/8-in. casing to 26,500-ft MD (10,200-ft reach), Fig. 2. The existing 9-5/8-in. casing was sidetracked at 13,450-ft MD via a hydraulic set whipstock. Drilling used a rotary steering tool in conjunction with a 9-7/8-in. hydraulic RWD tool – for the purpose of ECD reduction – placed 82 ft above the bit. Real-time torque, drag and hydraulics monitoring were used to evaluate hole conditions in the interval.
 |
Fig. 2. Examples of complex wells in various world locations that have recently adopted “roadmaps,” in conjunction with existing downhole technologies, to improve performance and assist in real-time decision making.
|
|
The ECD information was used pro-actively to determine whether ROP and/or rheological properties required adjustment to stay below the 15.0-ppg formation integrity test (FIT) limit at the 9-7/8-in. window.
Operations summary. The first BHA run drilled from 13,450 ft to 23,450 ft in six days. A planned trip was made to pick up a drilling formation tester (DFT) tool to acquire pressure data in the reservoir target interval. The well was drilled to 23,600 ft, and two attempts were made to conduct the planned formation test with the DFT tool without success, due to a component failure within the DFT. The well was drilled to 26,000 ft, where drilling was halted due to lost returns.
PWD data in Fig. 3 shows a fairly linear increase with depth, quite typical of horizontal wells, with a direct response to mud weight changes during the second BHA run.
 |
Fig. 3. Well A: 8-1/2-in. x 9-7/8-in. ECDs. PWD measured data only. Data for both BHA runs show overall increasing trend (typical for a horizontal well, as annular pressure increases without a corresponding TVD change). Behavior in second run seems to match the first, with seemingly expected response for mud weight changes. To a large degree, this is how PWD is often used on most rigs.
|
|
As can be seen in Fig. 4 – where the same data is over-laid against theoretical curves of what normal looks like – a good theoretical match is achieved throughout the first BHA run, and the early part of the second BHA run. Theoretical curves matched measured ECD values while drilling the first BHA run – once the mud system settled into a steady-state condition. However, there is a distinct deviation from the theoretical trend during the second BHA run, from 24,300 ft onward – that otherwise looked quite normal when the theoretical lines were removed, Fig. 3.
 |
Fig. 4. Well A: 8-1/2-in. x 9-7/8-in. ECDs, original modeling assumptions. Real-time ECD modeling matches predicted values until 24,300 ft. In theory, ECDs should have been about 0.4-ppg lower, due to reduced ROP and thinner mud.
|
|
The model predicts a drop in ECD, due to some minor thinning of mud properties by the fluids engineer while, in contrast, actual ECDs continued as per previous trend. The diagnosis was that the under-reamer had failed, and that the BHA was then drilling in 8-1/2-in. hole. The DFT BHA component also appeared to be creating an annular restriction inside the 8-1/2-in. hole. When this scenario was modeled, Fig. 5, a good match was achieved.
 |
Fig. 5. Well A: 8-1/2-in. x 9-7/8-in. ECDs, remodeled scenario. The scenario matches measured values quite closely. The new scenario assumes 8-1/2-in. hole below 24,300 ft, and an 8-in. OD across the DFT tool.
|
|
It is important to note that the hydraulics model calibration was not altered throughout the interval. Validation of the input assumptions within the first 1,000 ft to 2,000 ft of hole drilled is usually all that is required to achieve calibration. If the model is constructed properly, it will model the hydraulics regardless of depth, flowrate and changing mud properties.
Conclusions. During the trip out of the hole, 22 kips overpull was encountered as the DFT tool was pulled through the window. Inspection at surface revealed that the packers were torn, suggesting the elements were indeed swelled, which explained the excess drag at the 9-5/8-in. window. The underreamer was also found to be damaged.
The ability of a hydraulics model to detect hole-size changes is a great example of two relatively old technologies – PWD and hydraulics modeling – used in combination to improve decision making. The PWD information, while important, was greatly enhanced with a simple what does normal look like roadmap as a reference.
Well B. This well is an excellent example of what is possible with a typical rig package when theory and reality are used in unison to guide thinking at the rig floor.
Overview. A Gulf of Mexico operator recently drilled a 26,000-ft MD (21,000-ft reach), 12-1/4-in. interval, Fig. 2 – an offshore world record for 12-1/4-in. hole in an ERD well. This well is particularly notable, given that the rig's hydraulics capability is significantly less than most of the rigs used for comparable ERD intervals. Flowrate at TD was surface-pressure limited to 820 gpm. Major rig components included:
- Three Oilwell A-1700 PT triplex pumps
- 5,000-psi, high-pressure system, effectively limited to 4,400-psi standpipe pressure with 5.5-in. liners
- 27,000-ft racking capacity for 5-7/8-in. drill pipe, and
- Varco TDS 4H top drive, limited to 38 k ft-lb continuous torque at 120 rpm.
A rotary steering tool was used to maintain directional control and allow high-speed rotation for hole cleaning; plus synthetic-base mud (SBM) for inhibition/ rheological control.
Operations summary. The interval was drilled in 15 days with a total of two unplanned trips for downhole tool failures. The well reached TD eight days faster than the closest offset. No wiper trips were conducted throughout the 15,300-ft section. No sweeps were pumped below 16,000 ft after deciding to discontinue their use due to high ECD surges.
No stuck pipe incidents or significant downtime were encountered in the interval. Intermediate casing was on bottom 25 days after drilling out 13-3/8-in. surface pipe. The 9-5/8-in. casing was installed using selective flotation and roller centralizers to overcome drag, which provided >250 kips string tension at TD.
Drag modeling. Real-time drag modeling was used to maximize ROP, based on diverging drag trends, Fig. 6. Historical wells in the area limited ROP to 100 ft/hr instantaneous, throughout the 12-1/4-in. hole section. By maximizing ROP within The Box for the entire interval, significant improvement over the offset wells was realized. Drillrate was reduced below 18,000 ft based on drag trends, when flowrate became limited by the rig's surface pressure constraints of 4,400 psi.
 |
Fig. 6. Well B: 12-1/4-in. drilling hookloads. Drag monitoring techniques were used to optimize ROP while drilling the interval. When drag trends began to diverge, ROP was reduced to maintain consistent friction factors.
|
|
If the hole cleaning mechanism is thought of as a conveyor belt, one would expect maximum ROP to be directly linked to flowrate. As shown in Fig. 7, ROP did indeed mirror the flowrate profile as the section was drilled to TD.
 |
Fig. 7. Well B highlights relationship between ROP and flowrate when “Drilling in The Box” is used to maintain consistent hole cleaning. As the hole cleaning “conveyor belt” (flowrate) slowed down, ROP was adjusted to prevent overloading the system. Well B was drilled significantly faster than other offset wells, partially because ROP was maximized within The Box.
|
|
Drag was also closely monitored on trips in and out of the well as a stuck-pipe prevention tool. On several occasions, while tripping out of the well, drag trends indicated the BHA was pulling into a cuttings bed (slow increase in friction factors). When this trend was recognized, the string was tripped back into the hole some distance – two to five stands – to safely move away from the drag increase. Cleanup cycles with maximum flowrate and rotary speed were conducted.
Conclusions. Aggressively chasing the confines of The Box all the way to TD provided substantial gains in drilling performance. The interval was drilled and cased in record time, despite rig limitations that were well below the industry-accepted standard for 12-1/4-in. hole.
Well C. As a contrast to Well B, this well got into trouble, despite massive rig capabilities, tremendous flowrates and rotary steerable BHAs. Even the largest rig packages must be able to determine The Box size, as this example shows.
Overview. A South American operator drilled a relatively short stepout well, which was planned at 12-1/4-in. hole to 13,400-ft MD (9,300-ft reach) at 60° inclination, Fig. 2. The rig underwent extensive modifications prior to the drilling campaign, incorporating an estimated US$20 million upgrade to the drillstring, pumps, top drive and high pressure/ power systems. The accompanying table compares Well B and Well C.
| |
Table 1. Rig capability comparison |
|
| |
Equipment/capability |
Well B |
Well C |
|
|
|
|
| |
Pumps |
3 x 1,700 hp |
3 x 2,000 hp |
|
| |
Working pressure limit |
4,400 psi |
6,750 psi |
|
| |
Top drive |
Varco TDS 4H |
Canrig 1245AC |
|
| |
90% torque limit at 120 rpm |
38 k ft-lb |
43 k ft-lb |
|
| |
Drillstring |
5-7/8-in., 26.4 lb XT57 |
5-7/8-in., 23.4 lb XT57 |
|
| |
Power generation |
6,300 KW |
5,800 KW |
|
| |
12-1/4-in. tangent angle |
78° |
60° |
|
| |
Flowrate at 12-1/4-in. TD |
820 gpm |
1,100 gpm |
|
|
Operations summary. Early attempts to drill the well used a rotary steering tool and PWD tool, without real-time drag or hydraulics modeling. Instantaneous ROPs of 300 to 400 ft/hr were commonly used in the 12-1/4-in. interval, albeit with relatively high flowrates of 1,100 to 1,200 gpm. Two stuck pipe incidents resulted in two lost RSTs – the first permanently stuck, the other destroyed during fishing operations.
The first stuck pipe incident resulted in loss of the entire 12-1/4-in. hole section and, subsequently, an openhole sidetrack. When 9-5/8-in. casing was stuck 2,800 ft off bottom, the well was eventually abandoned after multiple attempts to clean out and sidetrack below the 9-5/8-in. casing. Further investigation of the failed attempts suggested that both tripping practices and wellbore instability were to blame for the problems.
A redrill of the well was conducted from an available slot. Changes to the well design included setting 13-3/8-in. surface pipe slightly deeper to accommodate 0.60-ppg higher mud weight for wellbore stability assurance. Real-time roadmaps were used to monitor well conditions, limit ROP and prevent stuck pipe while tripping. Flowrate was actually reduced to 1,000 gpm in the redrill – from 1,100 gpm at TD in the original well. ERD tripping practices were used, which had not been in place on previous attempts to drill the well. The redrill successfully landed 9-5/8-in. casing on bottom without any stuck pipe incidents while drilling or tripping in the interval.
Conclusions for Well C. High flowrate, rotary speed and high-tech downhole tools did not assure success in this well. Only when roadmaps and proven ERD drilling and tripping practices were put into place was the well drilled without incident. 
THE AUTHOR
|
 |
Brandon M. Foster, a senior drilling engineer with K&M Technology Group, The Woodlands, Texas, holds a BS degree in petroleum engineering from Montana Tech University. Prior to joining K&M, he worked for Mobil Oil Corp., ExxonMobil and Pure Resources as a drilling engineer at each firm. His background includes experience with horizontal, HPHT and ERD wells.
|
| |
|
|

