Oil Country Tubular Goods
Advanced OCTG topics for critical service, deepwater well design
Non-conventional demands on downhole tubulars require closer look at critical design factors.
Dr. Mike Payne, BP, Burnie Simpson, BP, and Ron Livesay, Hecate Software Inc.
This article presents advanced tubular topics key to the successful design and installation of oil country tubular goods (OCTG) in critical-service, deepwater wells. The topics have been identified as key technologies based on recent and ongoing experience in the development of a number of deepwater fields. The topics include: 1) advanced uprating procedures for critical service drillstem tubulars, and 2) probabilistic tubular design for optimal well design efficiency.
INTRODUCTION
Several considerations are identified herein as key technologies for the successful design/ installation of critical deepwater wells. The topics have been developed during engineering of a number of different deepwater developments. Some of the subject wells are among the deepest ever developed, in over 6,000 ft of water, and among the hottest with temperatures up to 325°F at the reservoir and 275°F at the mudline during production. The areas to be discussed include the following:
- Drilling tubular optimization and assurance: Despite optimization, well depths and casing weights in deepwater are increasing. As a result, drillstring loads now frequently exceed levels that have historically been accepted for operational practice. These load levels create additional risks that must be addressed. Using advanced NDT measures, various optimization techniques will be covered which have been successfully used to upgrade deepwater drillstring/ landing strings.
- Probabilistic optimization of tubular designs: For deepwater well design, it is imperative that high dimensional efficiency be achieved in the design. Radial clearances are at a premium and affect many operational aspects, including: running of casings/ liners, ECDs and mud losses, and cementing efficiencies. These objectives must be balanced with appropriately robust design margins. Such complex optimization is best suited for probabilistic treatments. Material is presented which demonstrates the capability of the technology.
DRILLSTEM OPTIMIZATION AND ASSURANCE
Deeper water depths and deeper drilling horizons below mudline (BML) are resulting in higher and higher drillstring and landing string loads. These increased loads have forced a re-examination of how load ratings are established for deepwater drillstem products. Historically, drillstring elements were automatically derated to “premium” class once they were put into use. This premium class tensile rating was limited to 80% of the “new” or nominal rating.
While such a conservative tensile rating may be tolerable for many conventional wells, in many deepwater wells, such conservatism results in an unacceptable reduction of the operating envelope. Thus, a focused effort was initiated to look at alleviating this constraint.
Advanced inspection techniques. Collaborative work was pursued on more advanced inspection techniques for drillstem tubulars. Specifically, upgrades were sought in the sophistication of ultrasonic wall thickness (UT) inspections. By adding circumferential and axial position decoders to the UT inspection units and by developing computer algorithms to gather and manage large amounts of data, capabilities were developed to comprehensively map the actual wall of critical service drilling tubulars.
Typically, the cross-sectional area (XSA) of a drillstem tubular has been considered as governed by the minimum wall. If the drill pipe was purchased with a minimum wall of 87.5% of nominal, the XSA was also calculated to be 87.5% of nominal, based on the assumption that the minimum wall could be present 360° around the circumference. This is not a reasonable assumption based on how pipe is manufactured, and this is one area of excessive conservatism that was removed from the rating methodology.
Wall tolerances are primarily applied only to prove-up areas where an indication found by either electromagnetic inspection (EMI) or UT has been ground out of the pipe. At such a grind area, it is necessary to demonstrate both, that: 1) the indication has been completely removed, and 2) the remaining body wall (RBW) at the location is still above the specified minimum. Because such areas are very localized, their effect on the total XSA at a given location is limited.
Overall, because most pipe is rolled oversized, i.e., on the plus side of the OD tolerance, and at or above the nominal wall, most tubulars will provide 95% to 100+% XSA not only in their new condition, but also for a substantial period of time. Only as wear accumulates, is it necessary to derate the string. Even in that process, the deratings should occur in stages, e.g., 95%, or 90% of new XSA.
Resolving wall thickness data. In order to rely on higher tensile capacities however, it is necessary to develop comprehensive data ensuring that the pipe is fit for these higher ratings. For many years, UT inspection systems have measured extensive wall data during the inspection of each joint. Unfortunately, the systems were only programed to look for thin walls and to mark such areas. The vast majority of the data was thus discarded.
With this new initiative, changes were made to retain the raw inspection data and to map this data against the relevant position in the pipe. Different vendors have addressed these requirements in different ways. A typical approach is to develop a three-channel system which records wall thickness, t, and position using standard cylindrical coordinates, z,q, meaning length down the cylinder, z, and angular position, q.
Length encoder information is generally referenced to a stable origin and thus can be converted to an offset distance using a linear transformation, such as:
Whereg is the encoder value and z is length.
Depending on the inspection apparatus, an additional 12-o'clock indicator may also need to be introduced. Using the 12-o'clock information to delimit revolutions, the angle is calculated for one revolution using a linear transformation, such as:
Wheref is the encoder value andq is the angle.
Regardless of the inspection apparatus used, there will be spurious wall thickness reports. Removal of this erroneous data is critical to establishing valid load ratings for the joint. Unfortunately, discussion of the advanced algorithms to filter and validate the data is beyond the scope of this paper. Once the data has been filtered, validated and mapped with the position encoder data, a full matrix can be constructed representing the pipe wall thickness in equally spaced rows (length intervals) and columns (angle intervals).
Construction of the matrix renders the massive amount of irregularly spaced data generated by the inspection into a much smaller, regularly spaced set. In practice, the matrix intervals are typically one degree angle,q, and 1/3 -in. length, z, intervals. Since the raw data is retained, a variety of matrix resolutions can be compared. The optimal matrix is the smallest one that still retains the full character of the pipe.
Calculating cross-sectional area. As an example of the involved resolution, up to 745,000 wall thickness readings may be taken on a single 30-ft joint, equating to ~2,000 wall readings per inch. This resolution is quite high, however, and lower data resolutions (50,000 readings/ joint) are also possible while still retaining very accurate pipe characterization. Fig. 1 shows an upgraded yard UT unit capable of these advanced inspection procedures.
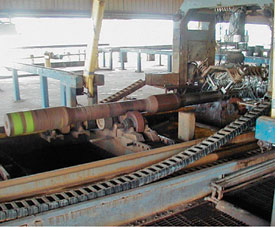 |
Fig. 1. Ultrasonic thickness inspection unit for advanced data acquisition on critical service drillstem components.
|
|
Assuming equal angular spacing, cross-sectional area can be calculated as:
| |
 |
Eq. 1 |
Where N is the number of thickness readings per revolution, ti is the thickness at report i, and D is an assumed or measured outside diameter.
By using extensive data from such a full-body wall thickness inspection, the traditional thin wall report can be replaced with a value that is much more representative of the tensile strength of the joint, specifically the minimum cross-sectional area per joint. This has been shown to result in a significantly stronger evaluation of the joints. This is reasonable since the entire joint is being evaluated rather than reducing the data to a single thin wall report.
An examination of an inspection job on 275 joints of 5-in., 19.50-ppf drill pipe demonstrates the difference between using the traditional thin-wall report and the minimum cross-sectional area. All joints were found to have cross-sectional areas greater than Nominal XSA, even though all had a thin-wall report of less than Nominal Wall. Results show there is a poor correlation between the thin-wall report and the minimum cross-sectional area.
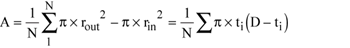
This lack of correlation suggests that thin-wall reports are not particularly good predictors of minimum cross-sectional area. Fig. 2 shows a detailed wall map of a heavy wall landing joint. Note in the fourth column (red graphic) the exact location of the critical XSA for the joint is identified.
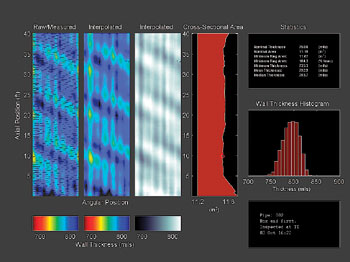 |
Fig. 2. 3-D wall mapping of critical service drillstring joints.
|
|
Beyond minimum XSA, other more advanced pipe properties can also be calculated to support probabilistic OCTG ratings, as discussed in the next section. An example is eccentricity calculations for one revolution, accomplished with:
| |
 |
Eq. 2 |
PROBABILISTIC TUBULAR OPTIMIZATION
Designing well casings requires the engineer to compare tubular performance ratings with anticipated loads. This task is required, irrespective of whether the design method is deterministic or probabilistic. Thus, a fundamental step in the design process is determination of the tubular performance rating. In well design, the most common tubular performance ratings are pipe body yield strength, internal pressure “burst” rating and external pressure (collapse) rating. These ratings have historically been governed by procedures and equations described in the document API 5C3.
Many key rating equations in API 5C3 date back to work in the late 1960s. However, due to significant advances in OCTG manufacturing, the well design community has recognized a need to re-examine these performance property equations. The effort to modernize OCTG performance properties started in 1998 under a joint API/ISO work group.1 These efforts are now well advanced, and new versions of API 5C3 and its sister document ISO 10400 are nearing completion.
One major program to enable these API/ISO modernization efforts was the joint industry project (JIP) DEA-130 launched under the US Drilling Engineering Association.2 DEA-130 was developed to address the issue of modernizing collapse ratings of OCTG. In addition, parallel API/ISO efforts have been ongoing to re-examine the internal pressure ratings of tubulars.
In addition to enhanced performance properties from improved manufacturing technology and development of higher quality steels, drilling trends have changed significantly with the exploration and development of deeper horizons. Deeper water depths and target horizons, and completions in harsher environments impose significantly higher loads on the tubulars, that are required to operate closer to capacity ratings.
Within constraints of the well, overburden and reservoir characteristics, corrosivity of drilling and producing environments, and nature of planned and contingency service loads during the field life, well tubulars must be optimized for a number of objectives, including:
- Maximum safety/reliability
- Efficient dimensions, i.e., minimum OD and maximum ID and drift
- Material suitable for corrosive/ embrittlement factors
- Appropriate balancing of connection/ pipe performance
- Minimum cost.
Extensive studies on achieving these optimization objectives have been conducted. Advanced work in this area consistently identifies probabilistic engineering as pivotal to effective solutions of such design optimizations. Therefore, an understanding of probabilistic performance ratings is required.
Probabilistic ratings are based on a careful examination of the involved tubular's actual material and dimensional properties. This information is obtained from mill and yard inspections, or from databases that describe statistical characteristics of key tubular properties. In addition to a probabilistic treatment of tubular capacity, a statistical consideration of the subject service load can be included in the analysis.
Acquiring, utilizing tubular properties. Fig. 3 illustrates the typical way in which tubular properties are specified. The tubular is described by its nominal, or minimum, values for geometry and material properties. For example, 7-in., 23-ppf, L-80 casing has a nominal OD of 7 in., a nominal weight of 23 ppf and a minimum yield strength of 80 ksi. However, due to the nature of the manufacturing process and quality control procedures, each property is actually bounded within prescribed limits of manufacturing tolerances.
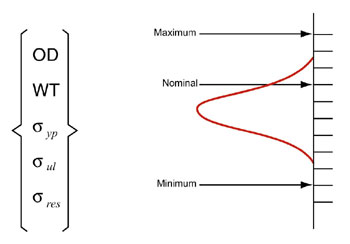 |
Fig. 3. Typical OCTG property specification vs. actual statistical variation.
|
|
Each property is described by maximum and minimum values and a statistical distribution. Statistical distribution of the properties of a tubular in a given batch, or “heat,” depends on the manufacturing procedures used at the mill. The usual procedure for characterizing properties consists of choosing random specimens from the “lot” and measuring properties of interest for these specimens. In statistical terms, the set of randomly chosen specimens is known as the “sample,” and the set of all the specimens in the heat is known as the “parent population.”
The overall number of specimens in the sample is known as the “sample size.” When properties fit a normal distribution, sample test data is statistically analyzed by computing mean and standard deviation. The sample mean and standard deviation represent the parent population within certain specific confidence limits. These values are used to determine the expected performance ratings of the entire population.
As an example of the impact of a probabilistic design, consider an example string design involving 9-7/8-in., 62.8-ppf Q-125. This casing is representative of both production and protective casings in popular use. Nominal properties for this item are as follows:
| |
OD, in. |
|
9.875 |
|
|
Wall, nom., in. |
|
0.625 |
|
|
Wall, min., in. |
|
0.547 (with standard – 12.5% tolerance) |
|
|
Min yield, ksi |
|
125 |
|
|
API MIYP, psi |
|
13,840 |
|
|
API collapse, psi |
|
11,140 |
|
|
PBYS, kips |
|
2,270 |
|
By agreement with the manufacturer, advanced mechanical and dimensional data can be obtained on tubulars at the mill. This data is key to optimizing designs and provides additional benefits in terms of quality assurance. For internal pressure capacity, it is leveraging to have comprehensive information concerning the product's actual wall thickness and yield strength.
Similar to the discussion above on drillstem optimization, work has been conducted with leading world-class mills on gathering extensive wall data during the in-line UT inspections. As described above, enhanced algorithms are used to gather the raw wall data, map the data into axial and circumferential locations and develop a full 3-D description of the pipe wall map.
Example mill inspection data display and use. Fig. 4 shows an example of a 3-D wall map developed from in-line mill UT inspection. A substantial amount of information is shown in this figure. The map on the left hand side shows the actual raw data measured by the UT unit. The resolution for acquisition of this data is extremely fine and is then filtered to be presented every ~3 in. axially and 24° circumferentially.
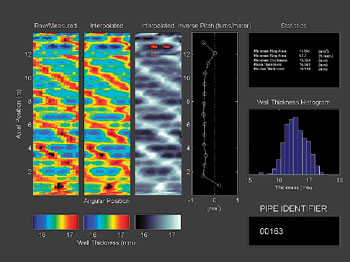 |
Fig. 4. Advanced 3-D wall mapping of critical service production casing using mill inspection data.
|
|
The next two plots to the right of this figure are interpolated wall plots where certain data smoothing and filtering have been performed. For example, the 0° and 360° edge boundaries on this plot must be consistent. Thus, calculations are performed to look at such consistency and refine the data. As shown in these plots, the wall characteristics for this seamless pipe behave in a helical manner. Heavier and lighter wall bands move helically along the pipe.
The next plot in the figure shows the calculated pitch of this helix behavior and is an indicator of the pipe manufacturing uniformity. Tabular statistics and a wall histogram are also shown. The helical character is an important observation. Since internal pressure creates a maximum principal stress in the circumferential direction, the pipe's ability to sustain these stresses is dependent on thinner wall sections of the pipe being aligned axially and these sections extending for a significant length.
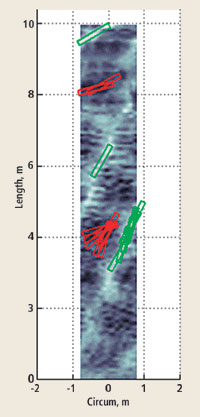 |
Fig. 5. Advanced scan for thin wall areas on 3-D joint wall map.
|
|
As shown in this plot, the coincidence of thin wall areas that align axially is limited. Such areas are shown in the gray plot as red rectangles. Since these areas are short, they are reinforced by the surrounding thicker wall areas.
These considerations support use of wall metrics closer to nominal for calculating actual pressure capacity. More precisely, these wall maps can be scanned for the average minimum wall that occurs in an axial “slice” of the pipe. Such “slices” will be narrow, i.e., aligned axially at same circumferential position, and of lengths on the order of 3 to 6 OD. A wall scan for such thin wall areas is shown in Fig. 5.
Relative to minimum-wall statistics in this case, the minimum wall of (15.354 mm or 0.604 in.) is ~93% of the nominal wall (17.07 mm or 0.672 in.). The mean wall (16.561 mm or 0.652 in.) is ~97% of the nominal wall. Note that the variation between 97% mean to nominal vs. 100% is really a small margin and typical of the type of precision that world-class mills can achieve. Such fine tuning of the target walls are performed to optimize drift performance while still meeting all wall requirements.
Investigating yield strength. Regarding yield strength, review of mill test reports (MTRs) can provide a statistical basis for how actual yield strength relates to minimum yield strength. The ratio of actual yield strength mean to minimum yield is generally referred to as yield strength bias. Yield strength bias will vary between mills and between products. Sour-service materials with controlled yields are limited to a maximum yield 15 ksi above minimum. Thus, such yield biases are smaller and on the order of 7 – 8 ksi, i.e., actual yield is targeted to the middle of allowed range.
For non-sour service materials, the yield window is usually a 30-ksi spread between maximum and minimum. For these materials, yield biases can be as much as 15 to 20 ksi. These properties were studied in detail in the DEA-130 JIP. Fig. 6 summarizes yield behaviors for a wide range of materials. For Q-125, a yield bias of ~11% is shown.
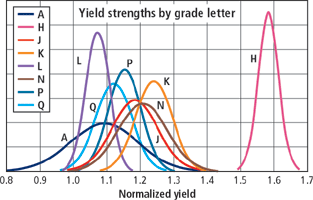 |
Fig. 6. Typical yield strength statistical bias from DEA-130 JIP.
|
|
Combining these wall and yield statistics results in a probabilistic rating for this product, such as shown in Fig. 7. A functional yield pressure rating on the product is probabilistically estimated at 16,815 psi. This approach thus provides a rational basis for an increased pressure rating ~21% above the minimum API MIYP rating. With such additional design margins, the opportunity for design optimization is clear.
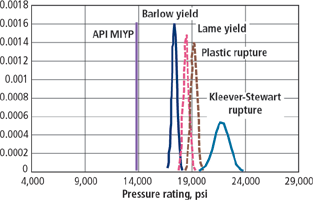 |
Fig. 7. Probabilistic internal pressure capacity analysis using actual well and yield strength statistics.
|
|
In addition to margins associated with actual wall and yield strength characteristics, note also that the API MIYP rating is not intended to predict the pressure at which the casing will rupture. The API MIYP rating is a conservative rating of the pressure at which yielding will begin. Studies have been made of the pipe rupture behavior, and accurate equations are available to predict rupture. Equations of this form are part of the current ISO DIS 10400.
As an example of the difference between initial yield and rupture pressures, consider the following data on rupture of 9-7/8-in., 62.8-ppf Q-125 samples:
| |
OD, in. |
Initial
yield, ksi |
Min wall, in. |
Measured
rupture press., psi |
Ratio to
API MIYP |
|
|
|
|
|
9.921 |
134.9 |
0.606 |
0,740 |
1.50 |
|
|
9.953 |
133.9 |
0.620 |
20,853 |
1.51 |
|
|
9.931 |
133.9 |
0.620 |
20,631 |
1.49 |
|
Although this data is limited, it clearly shows the substantial margins that exist between ratings based on the onset of yielding at the ID and actual rupture pressures of tubulars. This margin results from the increased pressure required to fully yield and plasticize the tubular wall, ultimately straining the material to a critical point. In this case, the rupture pressure is ~50% greater than the API MIYP rating.
Readers are cautioned that use of a rupture rating for design requires careful consideration of appropriate design factors. Readers are also cautioned that in environmentally corrosive conditions and/or when dealing with materials of inadequate toughness, pipe may fail in a brittle manner prior to reaching a fully ductile rupture. Nevertheless, when properly evaluated, such pressure margins can be very important in allowing refinement and optimization of deepwater well designs.
Regarding collapse, similar design margins are also available and have been the focus of in-depth studies. For brevity, however, interested readers are referred to existing work.2,3
CONCLUSIONS
Critical-service deepwater wells are posing engineering challenges related to tubular and well design not previously dealt with by the drilling community. Severe loading of casings, liners, tubings, drillstrings and landing strings are some of the challenges requiring new technological advances, to achieve effective and robust well designs.
Key advances now offer new analysis opportunities in the area of wall-thickness inspections for critical service deepwater drillstrings.
Full-body wall inspections are a substantial improvement that is being embraced by inspection companies. From the new wealth of information being provided, enhancements will be made to drilling operations, providing a safer, better-controlled environment.
Similar to the drillstring optimization technology, advanced inspection technology, coupled with detailed mechanics approaches, have enabled substantial opportunity for optimization using probabilistic design methods for downhole tubular goods. Such advanced techniques are being successfully used to alleviate design constraints, optimize well designs, and maximize quality assurance and service life integrity. 
ACKNOWLEDGMENT
The authors would like to thank the management of BP for permission to prepare this paper and present the subject material. They further acknowledge the substantial contributions of operating and engineering team members including V&M Tubulars (Advanced Mill Inspection Technology), Technical Industries and Tuboscope (Advanced Yard Inspection Technology), and Stress Engineering Services (primary contractor for DEA-130). This article was prepared largely from information in the paper titled, “Advanced topics for critical service deepwater well design,” presented at the “DOT03” Deep Offshore Technology Conference, Marseille, France, November 19 – 21, 2003.
LITERATURE CITED
1 ISO TC67/SC5/WG2B working jointly with API SC5, Dr. M. L. Payne, Convenor.
2 Drilling Engineering Association Joint-Industry Project DEA-130, Project Manager, W. T. Asbill, Stress Engineering Services, 13800 Westfair East Drive, Houston, Texas 77041.
3 Adams, A., P. Moore, and M. Payne, “On the calibration of design collapse strengths for quenched and tempered pipe,” OTC 13048, presented at the 2001 Offshore Technology Conference, April 30 – May 3, Houston, Texas.
THE AUTHORS
|
 |
Dr. Mike Payne, a senior advisor for BP in its Exploration and Production Technology Group (EPTG), holds BS and PhD degrees in mechanical engineering from Rice University, an MS degree in petroleum engineering from the University of Houston, and executive education from the University of Chicago GSB. Previously an advisor for ARCO, he has 24 years' drilling experience including operations, computing, technology and consulting. Dr. Payne has extensive industry publications, is chairman of the API Pipe Committee (SC5) and convenor of ISO SC5 WG2 and SC4 WG1. He serves on the board of the DEA, and has been recognized by SPE as a distinguished lecturer, and as the SPE International Drilling Engineering Award recipient for 2000.
|
 |
Burnie Simpson, is a senior consulting engineer for BP America's Deepwater Thunderhorse Group, where he works in all areas of drilling and completion. He holds a BSc honors degree from Aberdeen University and has 28 years' experience in various regions of the world. His area of expertise is in HPHT and deepwater operations.
|
 |
Ron Livesay, Hecate Software, has been providing computer-related assistance to engineering/ scientific/ manufacturing efforts in a variety of venues for more than 30 years. He holds a BS degree in physics from the University of Texas at Arlington, and a master's degree in software design from Texas Christian University.
|
|

